Báo cáo y học: "Procalcitonin kinetics within the first days of sepsis: relationship with the appropriateness of antibiotic therapy and the outcome" pptx
Bạn đang xem bản rút gọn của tài liệu. Xem và tải ngay bản đầy đủ của tài liệu tại đây (353.55 KB, 11 trang )
Open Access
Available online />Page 1 of 11
(page number not for citation purposes)
Vol 13 No 2
Research
Procalcitonin kinetics within the first days of sepsis: relationship
with the appropriateness of antibiotic therapy and the outcome
Pierre Emmanuel Charles
1
, Claire Tinel
1
, Saber Barbar
1
, Serge Aho
2
, Sébastien Prin
1
,
Jean Marc Doise
1
, Nils Olivier Olsson
3
, Bernard Blettery
1
and Jean Pierre Quenot
1
1
Service de Réanimation Médicale, Hôpital Le Bocage, C.H.U. de Dijon, 21000 Dijon, France
2
Service d'Epidémiologie et d'Hygiène Hospitalière, Hôpital Le Bocage, C.H.U. de Dijon, 21000 Dijon, France
3
Laboratoire d'Immunologie, Hôpital Le Bocage, C.H.U. de Dijon, 21000 Dijon, France
Corresponding author: Pierre Emmanuel Charles,
Received: 2 Jan 2009 Revisions requested: 3 Feb 2009 Revisions received: 19 Feb 2009 Accepted: 16 Mar 2009 Published: 16 Mar 2009
Critical Care 2009, 13:R38 (doi:10.1186/cc7751)
This article is online at: />© 2009 Charles et al.; licensee BioMed Central Ltd.
This is an open access article distributed under the terms of the Creative Commons Attribution License ( />),
which permits unrestricted use, distribution, and reproduction in any medium, provided the original work is properly cited.
Abstract
Introduction Management of the early stage of sepsis is a
critical issue. As part of it, infection control including appropriate
antibiotic therapy administration should be prompt. However,
microbiological findings, if any, are generally obtained late
during the course of the disease. The potential interest of
procalcitonin (PCT) as a way to assess the clinical efficacy of
the empirical antibiotic therapy was addressed in the present
study.
Methods An observational cohort study including 180 patients
with documented sepsis was conducted in our 15-bed medical
intensive care unit (ICU). Procalcitonin measurement was
obtained daily over a 4-day period following the onset of sepsis
(day 1 (D1) to D4). The PCT time course was analyzed
according to the appropriateness of the first-line empirical
antibiotic therapy as well as according to the patient outcome.
Results Appropriate first-line empirical antibiotic therapy (n =
135) was associated with a significantly greater decrease in
PCT between D2 and D3 (ΔPCT D2–D3) (-3.9 (35.9) vs. +5.0
(29.7), respectively; P < 0.01). In addition, ΔPCT D2–D3 was
found to be an independent predictor of first-line empirical
antibiotic therapy appropriateness. In addition, a trend toward a
greater rise in PCT between D1 and D2 was observed in
patients with inappropriate antibiotics as compared with those
with appropriate therapy (+5.2 (47.4) and +1.7 (35.0),
respectively; P = 0.20). The D1 PCT level failed to predict
outcome, but higher levels were measured in the nonsurvivors (n
= 51) when compared with the survivors (n = 121) as early as
D3 (40.8 (85.7) and 21.3 (41.0), respectively; P = 0.04).
Moreover, PCT kinetics between D2 and D3 were also found to
be significantly different, since a decrease ≥ 30% was expected
in the survivors (log-rank test, P = 0.04), and was found to be an
independent predictor of survival (odds ratio = 2.94; 95%
confidence interval 1.22 to 7.09; P = 0.02).
Conclusions In our study in an ICU, appropriateness of the
empirical antibiotic therapy and the overall survival were
associated with a greater decline in PCT between D2 and D3.
Further studies are needed to assess the utility of the daily
monitoring of PCT in addition to clinical evaluation during the
early management of sepsis.
Introduction
Bacterial sepsis is a leading cause of morbidity and death
among critically ill patients [1-3]. Since the first days of the
management of such patients are thought to be critical, both
clinical and biological objectives are required to optimize ther-
apies [4-6]. Cumulative evidence supports the fact that severe
sepsis arises from the inability of the host to control bacterial
growth as well as from an overwhelming inflammatory
response that could itself subsequently cause remote organ
dysfunction [7]. Eradicating the bacterial invader as well as
keeping in check the host's immune response over these so-
called golden hours of sepsis are therefore believed to be crit-
ical issues. Accordingly, the early administration of appropriate
antibiotics leads to a significant improvement in the outcome
ΔPCT: difference between two subsequent values; PaO
2
/FiO
2
: partial arterial pressure of O
2
/fraction of inspired O
2
; PCT: procalcitonin; SAPS: Sim-
plified Acute Physiologic Score; SOFA: Sepsis-related Organ Failure Assessment; VAP: ventilator-associated pneumonia.
Critical Care Vol 13 No 2 Charles et al.
Page 2 of 11
(page number not for citation purposes)
of the patients with sepsis [8,9]. At least 48 hours, however,
are generally required to accurately identify the bacteria, if any,
as well as the susceptibility to antimicrobial agents. In addition,
the appropriateness of the host response is far more difficult
to appreciate routinely.
Elevated levels of serum procalcitonin (PCT), a 116-amino-
acid peptide, are strongly associated with systemic bacterial
infections [10]. In addition, PCT elevation is thought to be
closely dependent on the host cytokine response to microbial
challenge, which could be mitigated by the antibacterial effect
of antibiotics. Furthermore, the magnitude and time course of
this response could be closely related to patient outcome
[11,12]. Two studies have emphasized that the relationship
between the daily variations of PCT could affect sepsis man-
agement regarding the length of antibiotic therapy [13,14]. Lit-
tle is known, however, about PCT behavior in septic patients
according to the appropriateness of the first-line antibiotic
therapy. In addition, previously published studies are sparse
and provide conflicting results regarding the prognosis value
of PCT [15-21].
We therefore conducted an observational study in our 15-bed
medical intensive care unit (ICU) to assess to which extent an
appropriate empirical antimicrobial therapy could hasten the
PCT decrease within the first days of sepsis management.
Materials and methods
Study population
Every episode of bacteremia, community-acquired pneumonia
and ventilator-associated pneumonia (VAP), as defined below,
was prospectively recorded by one of the investigators (PEC)
in our ICU throughout the study period, for an epidemiological
survey. In addition, PCT dosage was usually performed daily in
every patient with suspected sepsis as a reliable tool to
improve diagnosis and antimicrobial management [13]. In
accordance with French law, no informed consent was
required since all measurements were part of routine manage-
ment. Accordingly, our local Ethics Committee approved the
study.
Every patient with either bacteremia, community-acquired
pneumonia or VAP, as defined below, on admission to or dur-
ing the stay in the ICU was therefore eligible for the study if the
PCT dosage had been obtained at the onset of clinical sepsis
according to the American College of Chest Physicians/Soci-
ety of Critical Care Medicine Consensus Conference (that is,
day 1 (D1)) and at least twice more within next 3 days. No rule
was applied regarding the availability of C-reactive protein
dosages since our study focused on PCT. Only patients with
proven bacterial infection as described below were kept for
further analysis, provided they had not received any appropri-
ate antibiotics during the 48 hours prior to the diagnosis of
sepsis.
The following information was prospectively collected: the
main clinical and epidemiological data at ICU admission, such
as age, gender, type of admission (admission was considered
surgical in patients who had undergone surgery within the 30
days preceding the onset of bloodstream infection, and medi-
cal otherwise), and severity of illness on admission expressed
by the Simplified Acute Physiology Score (SAPS) II; patient
characteristics at the onset of sepsis and then daily until D4,
including main biological results, the septic condition (that is,
sepsis, severe sepsis or septic shock), and organ dysfunction
expressed by the Sepsis-related Organ Failure Assessment
(SOFA) score; the infection source, if known; microbiological
findings; and outcome in the ICU (that is, death or discharge).
Other data were collected retrospectively. Each medical chart
was therefore reviewed by an external observer (CT), unaware
of the purpose of the study, following a standard record sheet.
The available PCT measurements were then recorded. Antimi-
crobial susceptibility testing reports were reviewed by an
expert in infectious disease (PEC) unaware of the PCT values
as well as of the outcome, in order to determine the appropri-
ateness of the antibiotics administered to the patient as
defined below.
Definitions
One episode of bacteremia was defined as the recovery of any
bacterial species, in one or more blood cultures. Patients in
whom Staphylococcus non-aureus were isolated in blood cul-
tures were not eligible, except if at least two consecutive sam-
ples grew for the same species harboring the same antibiotic
resistance pattern. Blood samples were obtained by blood
punctures before being processed using the BACTEC system
based both on standard aerobic and anaerobic media coupled
with the 9240 automate (Beckton Dickinson Diagnostic Instru-
ment System, Paramus, NJ, USA). Bacteria identification was
based on standard methods. The onset of bacteremia was
defined as the day when the first positive blood culture was
obtained. Two distinct episodes of bloodstream infection were
considered in one patient if at least 6 days had elapsed
between the two sets of positive blood cultures, provided
appropriate therapy was implemented and significant clinical
improvement was obtained between the two episodes. This
time interval was chosen since previously published data indi-
cate that blood culture negativation is obtained in a median
time of around 2 days in patients with bacteremia receiving
appropriate antimicrobial treatment.
VAP was considered in every patient submitted to mechanical
ventilation for more than 2 days if the following conditions
were present: new lung infiltrate on the chest X-ray scan; pos-
itive tracheal aspirate cultures (>10
6
colony forming units/ml);
and Clinical Pulmonary Infection Score > 6 points.
Community-acquired pneumonia was considered in every
patient presenting on admission with lung infiltrate on the
Available online />Page 3 of 11
(page number not for citation purposes)
chest X-ray scan, a history of respiratory symptoms and the
presence of a putative lung pathogen within the respiratory
secretions and/or a positive urinary antigene for Streptococ-
cus pneumoniae or Legionella pneumophila serotype 1 using
the corresponding Binax assay.
In patients with bacteremia, other septic states were consid-
ered according to standard definitions if considered as the
infection source (for example, catheter related-bacteremia, uri-
nary tract infection, and so forth).
Sepsis was considered nosocomial if it had appeared more
than 2 days after hospital admission.
Main endpoints
The main clinical endpoint was the appropriateness of the anti-
biotic therapy given within the first 24 hours following the
onset of sepsis (that is, first-line empirical antibiotic therapy).
The empirical antibiotic therapy was considered appropriate if
the isolated pathogen(s) was (were) susceptible to at least
one drug administered at the onset of sepsis according to the
corresponding susceptibility testing report. The crude ICU
mortality was also considered.
Measurement of the procalcitonin level
The Kryptor
®
immunoassay was used according to the manu-
facturer's instructions (Brahms, Hennigsdorf, Germany). The
functional sensitivity of the assay is 0.06 ng/ml. Patients for
whom the PCT measurement was either unavailable or were
not performed within the 12 hours following the blood sample
were excluded from further analysis because of the risk of
false-negative results.
Statistical analysis
Values are expressed as the mean ± standard deviation unless
otherwise stated. PCT levels were log-transformed for all anal-
yses. PCT kinetics are expressed as ΔPCT values. ΔPCT was
defined as the difference between two subsequent values. For
example, ΔPCT D2–D3 was the difference in PCT between
the second and third days (ΔPCT D2–D3 = PCT-D3 – PCT-
D2) following the onset of sepsis (that is, D1). As a result,
ΔPCT D2–D3 > 0 if PCT had increased from D2 to D3. ΔPCT
was also expressed as proportions. For example, ΔPCT
D2–D3 > 50% meant that PCT has increased by more than
50% between D2 and D3.
Continuous variables were compared with the Mann–Whitney
U test. Categorical variables were compared using the chi-
square test. We then examined the independent contribution
of factors that had been predictive of death in the ICU by uni-
variate analysis. Prior to logistical regression, conformity with
the linear gradient of each continuous variable was checked. If
the linear model was not appropriate to describe its variations,
the variable was transformed according to the parcimonious
rule. The candidate variables were then manually entered into
a logistical regression model if the associated regression coef-
ficient had P < 0.20 by univariate analysis, and then removed
if P > 0.05 was obtained by multivariate analysis.
It is worth noting that the SAPS II was not entered into the
model regardless of the value obtained by univariate analysis.
Actually, it has been established that the SAPS II has been val-
idated in a large cohort of patients with various conditions dif-
ferent from sepsis. As a result, although this score is thought
to provide a reliable assessment of the mortality risk, it does
not specifically measure the risk of death from infectious
causes. In addition, since sepsis onset does not always occur
on admission, the SAPS II value does not necessarily reflect a
patient's condition at this time, especially in terms of organ
dysfunction and failure. Actually, sepsis was an ICU-acquired
condition in more than one-third of our patients (data not
shown). Finally, the sequential measurement of the SAPS II
has not yet been validated. The SOFA score was therefore cal-
culated daily during the course of sepsis, and was preferred to
the SAPS II as a predictive model of organ dysfunction and
outcome. The survival of patients regarding the PCT decrease
expressed as proportions were also analyzed through the con-
struction of the corresponding Kaplan–Meier curves com-
pared by the log-rank test.
The relationship between the PCT kinetics and the appropri-
ateness of the first-line antibiotic therapy was investigated
through the comparison of the ΔPCT values. A multivariate
analysis was conducted following the same rules as described
previously.
The diagnosis accuracy of ΔPCT and SOFA for the distinction
between survivors and nonsurvivors was then expressed as
the area under the corresponding receiver operating charac-
teristic curve.
P < 0.05 was considered statistically significant for all analy-
ses. STATA software was used for all analyses (College Sta-
tion, TX, USA).
Results
Patients' characteristics
Between 1 May 2005 and 31 June 2007, 319 patients pre-
sented with sepsis on admission to the ICU or during their stay
in our ICU. Among these patients, 29 were excluded because
the required PCT dosages were not available, 26 were
excluded because fungi were isolated, 71 were excluded
because bacterial cultures remained sterile and 13 were
excluded because appropriate antibiotics had been given
within the 48 hours preceding the onset of sepsis. The remain-
ing 180 patients were considered eligible for further analysis.
The main baseline characteristics of the included patients are
presented in Table 1. The main source of infection was found
to be the lung (51.7%). In more than one-half of the cases of
Critical Care Vol 13 No 2 Charles et al.
Page 4 of 11
(page number not for citation purposes)
Table 1
Baseline characteristics of patients with bacterial sepsis, appropriateness of first-line empirical antibiotic therapy, and outcome
Overall population (n
= 180)
First-line empirical antibiotic therapy Outcome
Appropriate (n = 135) Inappropriate (n = 45) Survivors (n = 129) Nonsurvivors (n = 51)
Age (years) 64.0 (15.3) 63.4 (15.9) 65.9 (13.1) 62.2 (15.5) 68.6 (14.0)
a
Sex (male/female) 122 (67.8%)/58
(32.2%)
87 (64.4%)/48
(35.6%)
35 (77.8%)/10
(22.2%)
b
91 (70.5%)/38
(29.5%)
31 (60.8%)/20
(39.2%)
SAPS II on admission
(points)
46.3 (16.9) 45.2 (17.7) 49.9 (13.7) 41.6 (15.2) 58.1 (15.3)
a
Time between ICU
admission and sepsis
(days)
4.7 (8.9) 4.9 (9.7) 4.1 (5.8) 3.8 (8.1) 7.1 (10.3)
a
Sepsis source
Pneumonia 93 (51.7%) 68 (54.4%) 25 (55.6%) 59 (45.7%) 34 (66.7%)
a
Miscellaneous
c
59 (32.8%) 43 (31.8%) 16 (35.6%) 47 (36.4%) 5 (9.8%)
Urinary tract 28 (15.5%) 24 (17.8%) 4 (8.8%) 23 (17.8%) 12 (23.5%)
Bacteremia 101 (56.1%) 72 (53.3%) 29 (64.4%) 73 (56.6%) 28 (54.9%)
Isolated pathogenes
Gram-negative 87 (48.3%) 60 (44.5%) 29 (60.0%)
a
57 (44.2%) 30 (58.8%)
a
Enterobacteriac
ae
59 (32.8%) 39 (28.9%) 20 (44.4%) 43 (33.3%) 16 (31.4%)
Pseudomonas
aeruginosa
16 (8.9%) 12 (8.9%) 4 (8.9%) 7 (5.4%) 9 (17.6%)
Miscellaneous 12 (6.7%) 9 (6.7%) 3 (6.7%) 7 (5.4%) 5 (9.8%)
Gram-positive 79 (43.9%) 65 (51.1%) 14 (31.1%)
a
62 (48.1%) 17 (33.3%)
a
Staphylococcus
aureus
31 (17.2%) 28 (20.7%) 3 (6.7%) 23 (17.8%) 8 (15.7%)
Streptococcus
spp.
40 (22.2%) 33 (24.4%) 7 (15.5%) 32 (24.8%) 8 (15.7%)
Miscellaneous 8 (4.4%) 4 (3.0%) 4 (8.9%) 7 (5.4%) 1 (1.9%)
Polymicrobial 14 (7.8%) 10 (7.4%) 4 (8.9%) 10 (7.7%) 4 (7.9%)
Sepsis characteristics
by D1
Septic shock 70 (41.2%) 57 (42.2%) 21 (46.7%) 39 (32.8%) 31 (63.3%)
a
SOFA score
(points)
6.2 (3.6) 6.2 (3.5) 6.2 (3.9) 5.4 (3.2) 8.2 (3.5)
a
Platelet count
(giga/l)
208.6 (137.5) 201.4 (123.1) 231.3 (175.2) 229.8 (135.9) 159.2 (129.4)
a
PaO
2
/FiO
2
(mmHg)
244 (140) 229.2 (129.7) 285.3 (161.0)
a
256.3 (140.1) 217.9 (139.2)
b
Mean arterial
pressure (mmHg)
73.5 (19.4) 74.2 (18.7) 71.3 (21.3) 74.4 (18.8) 71.2 (20.7)
Lactate (mmol/l) 3.2 (2.9) 3.4 (3.2) 2.7 (1.8) 2.8 (2.6) 4.1 (3.4)
a
Bilirubinemia
(μmol/l)
28.3 (43.8) 30.8 (47.9) 20.5 (26.1) 28.6 (48.8) 27.7 (28.5)
Creatininemia
(μmol/l)
199.1 (181.2) 197.6 (184.2) 203.6 (173.5) 204.7 (196.4) 184.9 (135.9)
Available online />Page 5 of 11
(page number not for citation purposes)
sepsis included, the diagnosis was bacteremia (56.1%).
Gram-negative bacteria and Gram-positive bacteria were iso-
lated in the same proportions (48.3% and 43.9% of all iso-
lates, respectively). Gram-negative bacteria of the
enterobacteriacae family were the most frequently isolated
(32.8% of all isolates). Gram-positive sepsis was mainly
caused by Staphylococcus aureus and Streptococcus spp.
(17.2% and 22.2%, respectively). The sepsis was polymicro-
bial in 7.8% of cases. Septic shock was present in 41.2% of
the episodes.
Appropriateness of empirical first-line antibiotic therapy
One-quarter of the patients were given inappropriate antibiot-
ics within the first 24 hours of sepsis management (Table 1).
The proportion of Gram-negative bacteria isolated was signif-
icantly higher in patients who did not receive appropriate anti-
biotics than in those who did (60.0% vs. 44.5%, respectively;
P = 0.04), whereas no difference existed in terms of severity
of the disease as assessed by the SAPS II on admission as
well as the D1 SOFA score.
Even though the magnitude of the PCT elevation between D1
and D2 seemed larger in patients who were given inappropri-
ate empirical antibiotic therapy than in those who received
active molecules, we failed to demonstrate any statistically sig-
nificant difference (Table 2). In contrast, the PCT variation was
significantly different between D2 and D3 (that is, ΔPCT
D2–D3) (P < 0.01). In addition, the ΔPCT D2–D3 was found
to be independently associated with antibiotic appropriate-
ness by logistic regression (Table 3). Finally, PCT elevation by
D4 was significantly lower in patients who had received appro-
priate antibiotics than in those who had not (P = 0.03).
In contrast, no difference was found from D1 to D4 if other
potential relevant clinical or biological endpoints were consid-
ered (that is, SOFA score, platelet count, blood lactate con-
centration, mean arterial pressure, PaO
2
/FiO
2
, creatininemia,
C-reactive protein), as detailed in Table 4.
C-reactive protein
(mg/l)
151.1 (111.9) 159.9 (112.9) 121.1 (105.0)
b
152.1 (114.2) 148.6 (107.7)
Nosocomial sepsis 98 (54.4%) 70 (51.8%) 28 (62.2%) 64 (49.6%) 34 (66.7%)
b
ICU length of stay 18.8 (19.9) 19.3 (22.2) 17.5 (13.9) 16.2 (18.2) 25.6 (22.5)
a
Baseline characteristics for 180 patients with bacterial sepsis, and description of the episodes according to the appropriateness of the first-line
empirical antibiotic therapy and the outcome. D1, day sepsis is diagnosed; SAPS II, Simplified Acute Physiology Score II; SOFA, Sepsis-related
Organ Failure Assessment; ICU, Intensive Care Unit.
a
P < 0.05.
b
P < 0.20.
c
Includes soft tissue, central nervous system and catheter-related
infections.
Table 1 (Continued)
Baseline characteristics of patients with bacterial sepsis, appropriateness of first-line empirical antibiotic therapy, and outcome
Table 2
Procalcitonin changes at various time points in patients with bacterial sepsis according to antibiotic therapy
First-line empirical antibiotic therapy P value
Appropriate Inappropriate
PCT at D1 (n = 180; 129 S, 51 NS)
a
27.2 (62.7) 29.6 (96.7) 0.92
PCT at D2 (n = 163; 117 S, 46 NS)
a
27.4 (45.1) 40.9 (74.3) 0.09
ΔPCT D1–D2 +1.7 (35.0) +5.2 (47.4) 0.20
PCT at D3 (n = 164; 117 S, 47 NS)
a
24.4 (58.4) 34.4 (55.7) 0.12
ΔPCT D2–D3 -3.9 (35.9) +5.0 (29.7) <0.01
PCT at D4 (n = 121; 80 S, 41 NS)
a
17.3 (45.8) 32.4 (46.2) 0.03
ΔPCT D1–D4 -9.1 (46.7) -0.8 (102.5) 0.01
ΔPCT D3–D4 -8.3 (21.5) -8.4 (16.6) 0.97
Changes in procalcitonin (PCT) values at various time points in patients with bacterial sepsis according to the appropriateness of the first-line
empirical antibiotic therapy. S, survivors; NS, nonsurvivors. ΔPCT D1–D2, procalcitonin decrease between day 2 and day 1 after the onset of
sepsis, and so forth.
a
Missing data are due to insufficient serum sample or death of patients within the 1-day, 2-day or 3-day-period following the
onset of sepsis. D1, day sepsis is diagnosed.
Critical Care Vol 13 No 2 Charles et al.
Page 6 of 11
(page number not for citation purposes)
Survival analysis
The crude ICU 28 day-mortality was 24.4% in the study pop-
ulation. Age, SAPS II value on admission and SOFA score on
the first day of sepsis were found to be associated with an
unfavorable outcome (Table 1). Septic shock at the onset of
sepsis was also more frequent in nonsurvivors than survivors
(63.3% vs. 32.8%, respectively; P < 0.01). In addition, these
nonsurviving patients were more likely to present with pneu-
monia and to suffer from Gram-negative infection than were
survivors. Among biological and physiological variables, the
serum lactates and the platelet count were found to be signif-
icantly different between survivors and nonsurvivors.
In contrast, neither the PCT baseline value (that is, the D1
value) nor the D2 value was associated with death in the study
population despite a trend toward greater values in the non-
survivors (Table 5). PCT was found to be significantly higher,
however, in nonsurvivors than in survivors by D3 and D4. The
ΔPCT D2–D3 value was calculated for only 147 patients
because of missing data and because of the death of some
patients within this period. ΔPCT D2–D3 was found to be an
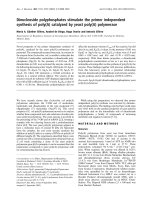
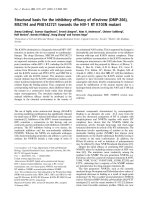
independent predictor of a bad outcome. In addition, a ΔPCT
D2–D3 lower than -30% was associated with death in our
study (log-rank test: P = 0.04) (Figure 1). ΔPCT D2–D3 was
also found to be an independent predictor of a bad outcome
in our multivariate analysis (odds ratio = 2.94; 95% confi-
dence interval = 1.22 to 7.09; P = 0.02) (Table 6).
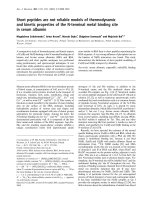
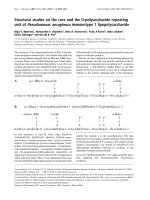
The predictive value of ΔPCT D2–D3 was compared with that
of the SOFA score on D1 through construction of the corre-
sponding ROC curves. It is worth noting that the areas under
the receiver operating characteristic curve achieved by both
markers were comparable (mean (standard deviation)) 0.697
(0.051) and 0.713 (0.048), respectively; P = not significant)
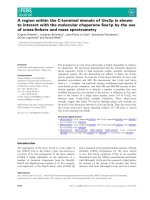
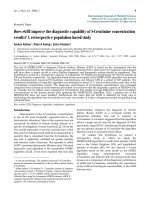
(Figure 2). In addition, we found that the combination of the
two led to a significant, although slight, improvement in the
predictive value of each factor taken alone (mean (standard
deviation)) area under the receiver operating characteristic
curve = 0.758 (0.048) (Figure 3).
Discussion
We show herein that the PCT kinetic within the first 48 hours
of management of sepsis could be significantly different
according to the appropriateness of the first-line empirical
antibiotic therapy. Actually, PCT variations between D2 and
Table 3
Factors predictive of the appropriateness of first-line empirical antibiotic therapy in patients with bacterial sepsis
Odds ratio Variable type 95% confidence interval P value
Gram staining (positive) 2.61 Dichotomous 1.13 to 6.03 0.02
ΔPCT D2–D3 10.29 Continuous 1.66 to 63.9 0.01
Multivariate analysis of factors predictive of the appropriateness of the first-line empirical antibiotic therapy in 147 patients with bacterial sepsis.
PCT, procalcitonin; D1, day sepsis is diagnosed; ΔPCT D2–D3, procalcitonin decrease between day 3 and day 2 after the onset of sepsis.
Figure 1
Kaplan–Meier estimated survival after the onset of bacterial sepsisKaplan–Meier estimated survival after the onset of bacterial sepsis. Kaplan–Meier estimated survival in the intensive care unit after the onset of bac-
terial sepsis in 147 patients with bacterial sepsis according to the procalcitonin variation between day 3 and day 2 (log-rank test, P = 0.04). D1, day
sepsis is diagnosed; ΔPCT D2-D3, procalcitonin decrease between day 3 and day 2 after the onset of sepsis.
Available online />Page 7 of 11
(page number not for citation purposes)
D3 were shown to be critical since a significantly greater PCT
decline within this period was expected in the patients with
appropriate empirical antibiotic therapy. In addition, a trend
toward a greater rise in PCT between D1 and D2 was
observed in patients with inappropriate antibiotics as com-
pared with those with appropriate therapy. As a result, our
findings suggest that patient management might be reas-
sessed if PCT does not decrease by 30% between D2 and
D3. In such cases, empirical antibiotic therapy modification
Table 4
Time course to endpoints other than procalcitonin in bacterial sepsis patients according to antibiotic therapy
First-line empirical antibiotic therapy P value
Appropriate Inappropriate
D1
SOFA score (points) 6.2 (3.5) 6.4 (4.0) 0.77
Mean arterial pressure (mmHg) 74.2 (18.7) 71.3 (21.3) 0.41
Platelet count (giga/l) 201.4 (123.0) 231.4 (175.2) 0.23
Creatininemia (μmol/l) 197.7 (184.2) 203.6 (173.5) 0.85
Lactate (mmol/l) 3.4 (3.2) 2.8 (1.8) 0.26
PO
2
/FiO
2
(mmHg) 229 (129) 280 (163) 0.05
C-reactive protein (mg/l) 159.9 (112.9) 121.1 (105.0) 0.11
D2
SOFA score (points) 6.0 (3.8) 6.1 (4.3) 0.89
Mean arterial pressure (mmHg) 78.6 (18.6) 76.2 (18.7) 0.48
Platelet count (giga/l) 193.0 (128.9) 194.8 (159.9) 0.94
Creatininemia (μmol/l) 183.9 (175.7) 206.0 (185.5) 0.49
Lactate (mmol/l) 2.8 (2.8) 2.1 (0.8) 0.15
PO
2
/FiO
2
(mmHg) 252 (132) 251 (129) 0.96
C-reactive protein (mg/l) 171.7 (101.8) 159.3 (86.6) 0.59
D3
SOFA score (points) 5.5 (4.0) 5.7 (4.2) 0.73
Mean arterial pressure (mmHg) 82.3 (19.1) 78.2 (22.3) 0.26
Platelet count (giga/l) 192.1 (127.6) 177.6 (144.2) 0.55
Creatininemia (μmol/l) 173.0 (151.9) 199.9 (189.3) 0.35
Lactate (mmol/l) 2.4 (2.8) 1.8 (0.7) 0.24
PO
2
/FiO
2
(mmHg) 263 (120.7) 275 (108.6) 0.61
C-reactive protein (mg/l) 176.4 (116.4) 160.0 (86.1) 0.53
D4
SOFA score (points) 4.5 (3.8) 5.8 (3.9) 0.24
Mean arterial pressure (mmHg) 81.1 (26.8) 77.0 (14.1) 0.53
Platelet count (giga/l) 189.8 (139.3) 135.8 (122.9) 0.14
Creatininemia (μmol/l) 181.1 (161.4) 216.6 (166.7) 0.39
Lactate (mmol/l) 2.6 (3.5) 1.5 (0.5) 0.09
PO
2
/FiO
2
(mmHg) 249 (122.5) 276 (79) 0.36
C-reactive protein (mg/l) 139.8 (103.7) 122.2 (74.5) 0.48
Time course of relevant endpoints other than procalcitonin in patients with bacterial sepsis according to appropriateness of first-line empirical
antibiotic therapy. SOFA, Sepsis-related Organ Failure Assessment; D1, day sepsis is diagnosed.
Critical Care Vol 13 No 2 Charles et al.
Page 8 of 11
(page number not for citation purposes)
towards a broader spectrum should be considered while the
microbiological findings, if any, are still pending.
Since the adequacy of early management of critically ill
patients with sepsis including antibiotic administration is
thought to be critical, objective markers are required. Given
the lack of reliability of clinical endpoints such as body temper-
ature, biomarkers are of potential interest. Among them, PCT
has appeared as one of the most promising in the setting of
severe bacterial sepsis [22]. Only a few studies about the early
time-dependent changes of PCT have so far been published,
and none of them focused on the appropriateness of the first-
line antibiotic therapy. Some experimental data do, however,
support the fact that PCT elevation is related to the bacterial
load [23]. PCT kinetics during the first days of sepsis could
therefore reflect the efficacy of the host immune response with
respect to bacterial clearance, with or without the contribution
of an appropriate antibiotic therapy. The clinical relevance of
such an explanation has already been demonstrated, but only
at the late stage of sepsis management (that is, once the con-
tinuation of antibiotic therapy becomes a matter of concern)
[13,14].
Only one published study provides data about PCT variations
according to the adequacy of the empirical antibiotic therapy
[24]. In the setting of VAP, these authors failed to demonstrate
any difference in either PCT or C-reactive protein variations
within the first 5 days of management in patients to whom
appropriate treatment was promptly given compared with oth-
ers. In contrast, a recently published study has shown that a
C-reactive protein decline could be more rapidly achieved if
empirical antibiotic therapy was effective against the microor-
ganism that was subsequently identified as responsible for the
VAP episode [25]. Unfortunately, however, PCT was not
measured in that study despite the faster than expected kinet-
ics. As a result, one could argue that the clinical utility of
biomarkers is limited since the microbiological findings, if any,
are usually available before the fifth day following the onset of
sepsis. Our findings, however, suggest that daily monitoring of
PCT could be useful to assess the appropriateness of the
empirical antibiotic therapy at an earlier stage (that is, within
the first 48 hours of management).
Besides these findings, we showed that a decrease of 30% at
Table 5
Procalcitonin changes at various time points in patients with bacterial sepsis according to the outcome
Survivors Nonsurvivors P value
PCT at D1 (n = 180; 129 S, 51 NS)
a
21.7 (52.0) 43.0 (107.4) 0.30
PCT at D2 (n = 163; 117 S, 46 NS)
a
25.7 (41.5) 43.9 (76.3) 0.13
ΔPCT D1–D2 +1.8 (35.9) +4.8 (44.6) 0.44
PCT at D3 (n = 164; 117 S, 47 NS)
a
21.3 (41.0) 40.8 (85.7) 0.04
ΔPCT D2–D3 -4.5 (24.0) +5.4 (52.3) <0.01
PCT at D4 (n = 121; 80 S, 41 NS)
a
14.0 (29.1) 34.9 (66.6) <0.01
ΔPCT D1–D4 -3.2 (38.8) -14.1 (97.8) 0.05
ΔPCT D3–D4 -5.9 (14.8) -13.1 (28.2) 0.06
S, survivors; NS, nonsurvivors; PCT, procalcitonin; D1, day sepsis is diagnosed; ΔPCT D1–D2, procalcitonin decrease between day 2 and day 1
after the onset of sepsis, and so forth.
a
Missing data are due to insufficient serum samples or death of patients within the 1-day, 2-day or 3-day
period following the onset of sepsis.
Table 6
Multivariate analysis of prognosis factors of outcome in 147 patients with bacterial sepsis
Odds ratio Variable type 95% confidence interval P value
Age (years) 1.05 Continuous 1.02 to 1.08 <0.01
SOFA score by day 1 1.28 Continuous 1.12 to 1.45 <0.01
ΔPCT D2–D3 >-30% 2.94 Dichotomous 1.22 to 7.09 0.02
Lung source of infection 3.14 Dichotomous 1.40 to 8.26 0.01
SOFA, Sepsis-related Organ Failure Assessment; D1, day sepsis is diagnosed; ΔPCT D2–D3, procalcitonin decrease between day 3 and day 2
after the onset of sepsis.
Available online />Page 9 of 11
(page number not for citation purposes)
least was associated with survival. Although low, the predic-
tive value of ΔPCT D2–D3 regarding the outcome was com-
parable with those of the D1 SOFA score. In contrast, the rise
in PCT we generally noticed between D1 and D2 did not
appear as a relevant indicator of prognosis. Some authors
have reported that the PCT baseline value could differentiate
survivors from nonsurvivors in patients with sepsis, while oth-
ers found that only the level achieved several days later could
differentiate the two patient groups [17-19,21]. Differences in
the case mix as well as the small size of the study groups could
account for such discrepancies. In addition, variations regard-
ing the respective proportions of Gram-negative and Gram-
positive bacteria as well as the isolation of yeast in the
included patients could offer some additional explanations
[26,27]. Previous reports have also pointed out that PCT kinet-
ics, rather than the baseline or the peak values, correlate with
patient outcome [28]. Some authors have therefore reported
that if PCT remained elevated in critically ill patients with sep-
sis, then the risk of death was increased, sometimes regard-
less of the absolute levels [15,16,29].
Although these findings provide a consistent overview of the
time course of PCT levels in the patients with sepsis according
to the outcome, however, drawing parallels with daily clinical
practice remains difficult. Accordingly, changes with time were
accurately analyzed in only very few of them. Interestingly, in a
study involving 53 patients with septic shock, some authors
showed that the rate of PCT decrease (that is, a decrease of
25% at least from baseline value) by D3 was greater in the sur-
vivors than in the patients with an unfavorable outcome [20].
Another study investigated the daily kinetics of PCT alone or
in combination with other prognosis indicators in 72 patients
with septic shock [30]. They found that the combination of an
increase in PCT and lactates between D1 and D2 was the
best predictor of 28-day mortality, whereas no difference was
found when these markers were considered alone. The
increase in PCT, however, was not defined in this study.
A study of 75 patients with VAP showed that a decrease in
PCT between D5 and baseline (simply defined as a negative
Δ value) could predict a good outcome [24]. Similar results
were obtained in 100 patients with severe community-
acquired pneumonia by comparing D3 PCT levels with base-
line values [31]. Unfortunately, PCT was not measured earlier
by the authors of the two latter studies. In addition, the LumiT-
est
®
(Brahms) was used for PCT measurement in all of these
reports, despite lower functional sensitivity when compared
with the Kryptor
®
immunoassay as used in the present study.
As a result, PCT variations in patients with low baseline values
might be questionable.
It is worth noting that survival was not influenced by the appro-
priateness of the empirical antibiotic therapy. The fact that the
treatment was modified in most patients as early as D2 of sep-
sis (85.6% of appropriate antibiotic therapy at this time point)
may account for this finding. In addition, this could reflect the
fact that, in some cases, antibiotic therapy has been modified
because of an undesirable course of PCT within this time
frame, such as a high ΔPCT D1–D2. Another explanation
could be that microbiological findings were available earlier
(that is, before D2) in some patients since routine cultures are
performed regularly in our ICU. Accordingly, sepsis was more
likely to be nosocomial in the patients who were given inappro-
priate therapy.
Figure 2
Procalcitonin variation and Sepsis-related Organ Failure Assessment for differentiating between survivors and nonsurvivorsProcalcitonin variation and Sepsis-related Organ Failure Assessment
for differentiating between survivors and nonsurvivors. Receiver operat-
ing characteristic curves of procalcitonin variation between day 2 and
day 3 after the onset of sepsis (red line) and Sepsis-related Organ Fail-
ure Assessment (blue line) for differentiating between survivors and
nonsurvivors in the intensive care unit in 147 patients with bacterial
sepsis. Area under the receiver operating characteristic curve = 0.713
(0.048) and 0.697 (0.051) (mean (standard deviation)), respectively (P
= 0.80).
Figure 3
Procalcitonin variation in combination with Sepsis-related Organ Failure Assessment for differentiating between survivors and nonsurvivorsProcalcitonin variation in combination with Sepsis-related Organ Failure
Assessment for differentiating between survivors and nonsurvivors.
Receiver operating characteristic curves of procalcitonin variation
between day 2 and day 3 after the onset of sepsis in combination with
Sepsis-related Organ Failure Assessment for differentiating between
survivors and nonsurvivors in the intensive care unit in 163 patients
with bacterial sepsis. Area under the receiver operating characteristic
curve = 0.758 (0.048) (mean (standard deviation)).
Critical Care Vol 13 No 2 Charles et al.
Page 10 of 11
(page number not for citation purposes)
Several limitations of our study have to be mentioned. First, the
small size of our sample could account for our failure to dem-
onstrate some statistically significant difference between the
patients with or without appropriate first-line empirical antibi-
otic therapy while obvious trends have arisen from our results.
This is especially true when considering the difference of
ΔPCT D1–D2 between these patients. Second, the present
investigation was a single-center study. Any generalization of
our data should therefore be cautious. In addition, given the
study design, there was a high proportion of missing data. As
a result, although excluded patients did not differ from those
included in terms of age and severity, one cannot exclude the
possibility that PCT values did not follow the same distribution
as in the analyzed cohort. Such a weakness is also the
strength of our study, however, since PCT dosages were per-
formed in a real-life manner, in theory making it easier to trans-
late our findings to clinical practice. Moreover, we cannot
exclude the possibility that some confounding variables have
been missed. Hence, although not significant, the higher levels
of serum creatininemia could account for the differences
between nonsurvivors and survivors with regard to the PCT
levels we recorded, as has recently been reported [32].
Conclusions
Our findings suggest that PCT kinetics within the first 48
hours of sepsis management could be related to the appropri-
ateness of first-line empirical antibiotic therapy as well as to
the patient outcome. A prospective study is therefore required
to assess the clinical relevance of such results. Actually, the
daily variations in PCT in addition to the clinical findings could
be used as a surrogate to assess the effectiveness of therapy
and to trigger more aggressive therapies and diagnostic inves-
tigations in an attempt to improve outcome. As a part of this,
broadening the spectrum of the empirical antibiotic therapy
should be considered. Accordingly, this hypothesis is currently
under investigation through a multicenter prospective interven-
tional study [33].
Competing interests
PEC has received payments from Brahms (Hennigsdorf, Ger-
many) to attend several meetings about sepsis management.
The other authors declare that they have no competing
interests.
Authors' contributions
PEC designed the study, analyzed the data and drafted the
manuscript. SB and CT collected the data and participated in
their interpretation. SA performed the statistical analysis. J-
PQ, J-MD, SP and BB participated in critical revision of the
manuscript. N-OO managed the activity of the Immunology
Laboratory.
References
1. Annane D, Aegerter P, Jars-Guincestre MC, Guidet B: Current
epidemiology of septic shock: the cub-rea network. Am J
Respir Crit Care Med 2003, 168:165-172.
2. Pittet D, Tarara D, Wenzel RP: Nosocomial bloodstream infec-
tion in critically ill patients. Excess length of stay, extra costs,
and attributable mortality. JAMA 1994, 271:1598-1601.
3. Garrouste-Orgeas M, Timsit JF, Tafflet M, Misset B, Zahar JR,
Soufir L, Lazard T, Jamali S, Mourvillier B, Cohen Y, De Lassence
A, Azoulay E, Cheval C, Descorps-Declere A, Adrie C, Costa de
Beauregard MA, Carlet J: Excess risk of death from intensive
care unit-acquired nosocomial bloodstream infections: A
reappraisal. Clin Infect Dis 2006, 42:1118-1126.
4. Munson EL, Diekema DJ, Beekmann SE, Chapin KC, Doern GV:
Detection and treatment of bloodstream infection: Laboratory
reporting and antimicrobial management. J Clin Microbiol
2003, 41:495-497.
5. Rivers E, Nguyen B, Havstad S, Ressler J, Muzzin A, Knoblich B,
Peterson E, Tomlanovich M: Early goal-directed therapy in the
treatment of severe sepsis and septic shock. N Engl J Med
2001, 345:1368-1377.
6. Luna CM, Aruj P, Niederman MS, Garzon J, Violi D, Prignoni A,
Rios F, Baquero S, Gando S: Appropriateness and delay to ini-
tiate therapy in ventilator-associated pneumonia. Eur Respir J
2006, 27:158-164.
7. Munford RS, Pugin J: Normal responses to injury prevent sys-
temic inflammation and can be immunosuppressive. Am J
Respir Crit Care Med 2001, 163:316-321.
8. Ibrahim EH, Sherman G, Ward S, Fraser VJ, Kollef MH: The influ-
ence of inadequate antimicrobial treatment of bloodstream
infections on patient outcomes in the ICU setting. Chest 2000,
118:146-155.
9. Harbarth S, Garbino J, Pugin J, Romand JA, Lew D, Pitet D: Inap-
propriate initial antimicrobial therapy and its effect on survival
in a clinical trial of immunomodulating therapy for severe
sepsis. Am J Med 2003, 115:529-535.
10. Christ-Crain M, Muller B: Procalcitonin in bacterial infections –
hype, hope, more or less? Swiss Med Wkly 2005,
135:451-460.
11. Riche FC, Cholley BP, Panis YH, Laisne MJ, Briard CG, Graulet
AM, Gueris JL, Valleur PD: Inflammatory cytokine response in
patients with septic shock secondary to generalized
peritonitis. Crit Care Med 2000, 28:433-437.
12. Bonten MJ, Froon AH, Gaillard CA, Greve JW, de Leeuw PW,
Drent M, Stobberingh EE, Buurman WA: The systemic inflamma-
tory response in the development of ventilator-associated
pneumonia. Am J Respir Crit Care Med 1997, 156:1105-1113.
13. Christ-Crain M, Stolz D, Bingisser R, Muller C, Miedinger D, Huber
PR, Zimmerli W, Harbarth S, Tamm M, Muller B: Procalcitonin
guidance of antibiotic therapy in community-acquired pneu-
monia: a randomized trial. Am J Respir Crit Care Med 2006,
174:84-93.
14. Nobre V, Harbarth S, Graf JD, Rohner P, Pugin J: Use of procal-
citonin to shorten antibiotic treatment duration in septic
patients: a randomized trial. Am J Respir Crit Care Med 2008,
177:498-505.
15. Harbarth S, Holeckova K, Froidevaux C, Pittet D, Ricou B, Grau
GE, Vadas L, Pugin J: Diagnostic value of procalcitonin, inter-
leukin-6, and interleukin-8 in critically ill patients admitted with
suspected sepsis. Am J Respir Crit Care Med 2001,
164:396-402.
16. Schroder J, Staubach KH, Zabel P, Stuber F, Kremer B: Procalci-
tonin as a marker of severity in septic shock. Langenbecks
Arch Surg 1999, 384:33-38.
Key messages
• The PCT time course within the first days of manage-
ment of sepsis could be a critical issue in the critically ill
patients.
• A marked decreased of PCT between the second and
third days might be expected in the patients with appro-
priate empirical antibiotic therapy and good outcome.
Available online />Page 11 of 11
(page number not for citation purposes)
17. Gibot S, Cravoisy A, Kolopp-Sarda MN, Bene MC, Faure G, Bol-
laert PE, Levy B: Time-course of sTREM (soluble triggering
receptor expressed on myeloid cells)-1, procalcitonin, and C-
reactive protein plasma concentrations during sepsis. Crit
Care Med 2005, 33:792-796.
18. Meisner M, Tschaikowsky K, Palmaers T, Schmidt J: Comparison
of procalcitonin (pct) and c-reactive protein (crp) plasma con-
centrations at different sofa scores during the course of sep-
sis and mods. Crit Care 1999, 3:45-50.
19. Luyt CE, Guerin V, Combes A, Trouillet JL, Ayed SB, Bernard M,
Gibert C, Chastre J: Procalcitonin kinetics as a prognostic
marker of ventilator-associated pneumonia. Am J Respir Crit
Care Med 2005, 171:48-53.
20. Claeys R, Vinken S, Spapen H, ver Elst K, Decochez K, Huyghens
L, Gorus FK: Plasma procalcitonin and C-reactive protein in
acute septic shock: clinical and biological correlates. Crit Care
Med 2002, 30:757-762.
21. Clec'h C, Ferriere F, Karoubi P, Fosse JP, Cupa M, Hoang P,
Cohen Y: Diagnostic and prognostic value of procalcitonin in
patients with septic shock. Crit Care Med 2004, 32:1166-1169.
22. Becker KL, Snider R, Nylen ES: Procalcitonin assay in systemic
inflammation, infection, and sepsis: clinical utility and
limitations. Crit Care Med 2008, 36:941-952.
23. Nylen ES, Whang KT, Snider RH Jr, Steinwald PM, White JC,
Becker KL: Mortality is increased by procalcitonin and
decreased by an antiserum reactive to procalcitonin in experi-
mental sepsis. Crit Care Med 1998, 26:1001-1006.
24. Seligman R, Meisner M, Lisboa TC, Hertz FT, Filippin TB, Fachel
JM, Teixeira PJ: Decreases in procalcitonin and C-reactive pro-
tein are strong predictors of survival in ventilator-associated
pneumonia. Crit Care 2006, 10:R125.
25. Lisboa T, Seligman R, Diaz E, Rodriguez A, Teixeira PJ, Rello J: C-
reactive protein correlates with bacterial load and appropriate
antibiotic therapy in suspected ventilator-associated
pneumonia. Crit Care Med
2008, 36:166-171.
26. Charles PE, Dalle F, Aho S, Quenot JP, Doise JM, Aube H, Olsson
NO, Blettery B: Serum procalcitonin measurement contribution
to the early diagnosis of candidemia in critically ill patients.
Intensive Care Med 2006, 32:1577-1583.
27. Charles PE, Ladoire S, Aho S, Quenot JP, Doise JM, Prin S, Olsson
NO, Blettery B: Serum procalcitonin elevation in critically ill
patients at the onset of bacteremia caused by either gram
negative or gram positive bacteria. BMC Infect Dis 2008, 8:38.
28. Jensen JU, Heslet L, Jensen TH, Espersen K, Steffensen P, Tvede
M: Procalcitonin increase in early identification of critically ill
patients at high risk of mortality. Crit Care Med 2006,
34:2596-2602.
29. Bossink AW, Groeneveld AB, Thijs LG: Prediction of microbial
infection and mortality in medical patients with fever: plasma
procalcitonin, neutrophilic elastase-alpha1-antitrypsin, and
lactoferrin compared with clinical variables. Clin Infect Dis
1999, 29:398-407.
30. Phua J, Koay ES, Lee KH: Lactate, procalcitonin, and amino-ter-
minal pro-B-type natriuretic peptide versus cytokine measure-
ments and clinical severity scores for prognostication in septic
shock. Shock 2008, 29:328-333.
31. Boussekey N, Leroy O, Alfandari S, Devos P, Georges H, Guery B:
Procalcitonin kinetics in the prognosis of severe community-
acquired pneumonia. Intensive Care Med 2006, 32:469-472.
32. Amour J, Birenbaum A, Langeron O, Le Manach Y, Bertrand M,
Coriat P, Riou B, Bernard M, Hausfater P: Influence of renal dys-
function on the accuracy of procalcitonin for the diagnosis of
postoperative infection after vascular surgery. Crit Care Med
2008, 36:1147-1154.
33. Jensen JU, Lundgren B, Hein L, Mohr T, Petersen PL, Andersen
LH, Lauritsen AO, Hougaard S, Mantoni T, Bømler B, Thornberg
KJ, Thormar K, Løken J, Steensen M, Carl P, Petersen JA, Tousi H,
Søe-Jensen P, Bestle M, Hestad S, Andersen MH, Fjeldborg P,
Larsen KM, Rossau C, Thomsen CB, Ostergaard C, Kjaer J,
Grarup J, Lundgren JD: The Procalcitonin And Survival Study
(PASS) – a randomised multi-center investigator-initiated trial
to investigate whether daily measurements biomarker Procal-
citonin and pro-active diagnostic and therapeutic responses
to abnormal Procalcitonin levels, can improve survival in inten-
sive care unit patients. Calculated sample size (target popula-
tion): 1000 patients. BMC Infect Dis 2008, 8:91.