Báo cáo y học: "Crystalloids versus colloids for goal-directed fluid therapy in major surgery" pdf
Bạn đang xem bản rút gọn của tài liệu. Xem và tải ngay bản đầy đủ của tài liệu tại đây (830.2 KB, 13 trang )
Open Access
Available online />Page 1 of 13
(page number not for citation purposes)
Vol 13 No 2
Research
Crystalloids versus colloids for goal-directed fluid therapy in
major surgery
Luzius B Hiltebrand
1
, Oliver Kimberger
2
, Michael Arnberger
1
, Sebastian Brandt
1
, Andrea Kurz
3
and
Gisli H Sigurdsson
4
1
Department of Anaesthesiology and Pain Therapy, Inselspital, Bern University Hospital, Freiburgstrasse, Bern, CH 3010, Switzerland
2
Department of Anaesthesia, General Intensive Care and Pain Medicine, Medical University of Vienna, Währinger Gürtel 18-20, Vienna, A 1090,
Austria
3
Department of Outcomes Research, The Cleveland Clinic, 9500 Euclid Avenue, Cleveland, OH 44195, USA
4
Department of Anaesthesia and Intensive Care Medicine, Landspitali University Hospital, and University of Iceland, Hringbraut, Reykjavik, IS 101,
Iceland
Corresponding author: Luzius B Hiltebrand,
Received: 4 Nov 2008 Revisions requested: 24 Dec 2008 Revisions received: 20 Feb 2009 Accepted: 21 Mar 2009 Published: 21 Mar 2009
Critical Care 2009, 13:R40 (doi:10.1186/cc7761)
This article is online at: />© 2009 Hiltebrand et al.; licensee BioMed Central Ltd.
This is an open access article distributed under the terms of the Creative Commons Attribution License ( />),
which permits unrestricted use, distribution, and reproduction in any medium, provided the original work is properly cited.
Abstract
Introduction Perioperative hypovolemia arises frequently and
contributes to intestinal hypoperfusion and subsequent
postoperative complications. Goal-directed fluid therapy might
reduce these complications. The aim of this study was to
compare the effects of goal-directed administration of
crystalloids and colloids on the distribution of systemic,
hepatosplanchnic, and microcirculatory (small intestine) blood
flow after major abdominal surgery in a clinically relevant pig
model.
Methods Twenty-seven pigs were anesthetized and
mechanically ventilated and underwent open laparotomy. They
were randomly assigned to one of three treatment groups: the
restricted Ringer lactate (R-RL) group (n = 9) received 3 mL/kg
per hour of RL, the goal-directed RL (GD-RL) group (n = 9)
received 3 mL/kg per hour of RL and intermittent boluses of 250
mL of RL, and the goal-directed colloid (GD-C) group (n = 9)
received 3 mL/kg per hour of RL and boluses of 250 mL of 6%
hydroxyethyl starch (130/0.4). The latter two groups received a
bolus infusion when mixed venous oxygen saturation was below
60% ('lockout' time of 30 minutes). Regional blood flow was
measured in the superior mesenteric artery and the celiac trunk.
In the small bowel, microcirculatory blood flow was measured
using laser Doppler flowmetry. Intestinal tissue oxygen tension
was measured with intramural Clark-type electrodes.
Results After 4 hours of treatment, arterial blood pressure,
cardiac output, mesenteric artery flow, and mixed oxygen
saturation were significantly higher in the GD-C and GD-RL
groups than in the R-RL group. Microcirculatory flow in the
intestinal mucosa increased by 50% in the GD-C group but
remained unchanged in the other two groups. Likewise, tissue
oxygen tension in the intestine increased by 30% in the GD-C
group but remained unchanged in the GD-RL group and
decreased by 18% in the R-RL group. Mesenteric venous
glucose concentrations were higher and lactate levels were
lower in the GD-C group compared with the two crystalloid
groups.
Conclusions Goal-directed colloid administration markedly
increased microcirculatory blood flow in the small intestine and
intestinal tissue oxygen tension after abdominal surgery. In
contrast, goal-directed crystalloid and restricted crystalloid
administrations had no such effects. Additionally, mesenteric
venous glucose and lactate concentrations suggest that
intestinal cellular substrate levels were higher in the colloid-
treated than in the crystalloid-treated animals. These results
support the notion that perioperative goal-directed therapy with
colloids might be beneficial during major abdominal surgery.
ANOVA: analysis of variance; CaO
2
: arterial oxygen content; CI: cardiac index; CVP: central venous pressure; GD-C: goal-directed colloid fluid ther-
apy; GD-RL: goal-directed Ringer lactate fluid therapy; GDT: goal-directed fluid therapy; Hb: hemoglobin concentration; HES: hydroxyethyl starch;
HVP: hepatic vein pressure; LDF: laser Doppler flowmetry; MAP: mean arterial blood pressure; PAP: pulmonary artery pressure; PCWP: pulmonary
capillary wedge pressure; pO
2
: oxygen partial pressure; PPV: pulse pressure variation; RL: Ringer lactate; R-RL: restricted Ringer lactate fluid therapy;
SMA: superior mesenteric artery; SMAI: superior mesenteric artery flow index; SO
2
: arterial oxygen saturation; SV: stroke volume; SvO
2
: mixed venous
oxygen saturation; SVRI: systemic vascular resistance index.
Critical Care Vol 13 No 2 Hiltebrand et al.
Page 2 of 13
(page number not for citation purposes)
Introduction
Perioperative care of high-risk surgical patients remains a chal-
lenge. Despite improvements in perioperative management,
the rate of severe complications after major surgery remains
high [1,2]. It has been shown that perioperative decrease in
oxygen transport is closely related to the development of
organ failure and death [3,4]. Failure of adequate fluid therapy
is a common cause of decreased oxygen transport [3,5,6].
Intraoperative gut hypoperfusion was identified in 63% of
major surgery patients and was associated with increased
morbidity and hospital stay [3]. As a consequence, low gastric
intramucosal pH assessed by gastric tonometry was among
the strongest predictors of various perioperative complica-
tions [3,7].
Although the importance of normovolemia is widely accepted,
there is an ongoing debate about the right amount and the
right type of fluid to be administered perioperatively in major
surgery. Several recent publications have suggested that goal-
directed fluid therapy [8-10] with crystalloid or colloid admin-
istration is a possible way to decrease morbidity and mortality
in major surgery patients. Despite reports of decreased mor-
bidity and mortality [5,8,11,12] in these studies, the actual
effect of a perioperative goal-directed fluid therapy and, in par-
ticular, effects of the kind of fluid (namely, crystalloid or colloid
solution) on the small bowel – the motor of multiorgan failure
– are still largely unknown. Goal-directed fluid therapy with
colloids has been shown to improve gastric tonometry values
in patients after cardiac surgery, suggesting improved gastric
perfusion [5]. On the other hand, distribution of blood flow
after a fluid challenge is heterogeneous and increased cardiac
output does not automatically result in increased hepat-
osplanchnic blood flow [13]. Thus, the question of which way
perioperative goal-directed fluid therapy influences regional
and microcirculatory blood flow as well as tissue oxygen ten-
sion in the gastrointestinal tract remains unresolved. Addition-
ally, the type of fluid administered is likely to play an important
role [14].
In the present study, we hypothesize that goal-directed colloid
fluid therapy in the setting of major abdominal surgery
increases intestinal microcirculatory blood flow and tissue oxy-
gen tension. The main aim of this study was to investigate the
influence of three different fluid management strategies on
systemic blood flow (cardiac index, or CI), regional blood flow
(hepatosplanchnic flow), local blood flow (microcirculatory
flow in the small intestine), and intestinal tissue oxygen tension
in a pig model of major abdominal surgery. An additional aim
was to identify possible differences in effects between crystal-
loid- and colloid-based fluid treatments.
Materials and methods
This study was performed in accordance with the National
Institutes of Health (Bethesda, MD, USA) guidelines for the
care and use of experimental animals. The protocol was
approved by the animal ethics committee of Canton Bern,
Switzerland. Twenty-seven domestic pigs (weight 28 to 32 kg)
were fasted overnight but had free access to water. The pigs
were sedated with intramuscular ketamine (20 mg/kg) and
xylazine (2 mg/kg). Then a peripheral intravenous catheter was
inserted in an ear vein for initial administration of fluids and
medications. Anesthesia was induced with midazolam 0.4 mg/
kg and atropine 1 mg. After induction, the pigs were orally intu-
bated and ventilated with oxygen in air (fraction of inspired oxy-
gen = 0.3). Anesthesia was maintained with midazolam 0.5
mg/kg per hour, fentanyl 15 μg/kg per hour, pancuronium 0.3
mg/kg per hour, and low-dose propofol 0.15 mg/kg per hour.
The animals were ventilated with a volume-controlled ventilator
with a positive end-expiratory pressure of 5 cm H
2
O (Servo
900C; Siemens, Solna, Sweden). Tidal volume was kept at 8
to 10 mL/kg, and the respiratory rate was adjusted (22 to 26
breaths per minute) to maintain end-tidal carbon dioxide ten-
sion (PaCO
2
) at 5.3 ± 0.5 kPa. Immediately after induction, all
animals received 1.5 g of Cefuroxim intravenously as an antibi-
otic prophylaxis. The stomach was emptied with a large-bore
orogastric tube.
Surgical preparation
Through a left cervical cut-down, indwelling catheters were
inserted into the left carotid artery and superior vena cava. A
balloon-tipped catheter was inserted into the pulmonary artery
through the right external jugular vein. Location of the catheter
tip was determined by observing the characteristic pressure
trace on the monitor as the catheter was advanced through the
right heart into the pulmonary artery. Similarly, a fiberoptic
hepatic vein catheter was inserted through the right jugular
vein. Correct positioning was verified by a 15% to 20%
decrease in the continuously measured hepatic vein saturation
versus the mixed venous saturation and by a significant
decrease in lactate concentration compared with mixed
venous blood. The right carotid artery was dissected free and
a 4-mm ultrasound transit time flow probe was placed around
the vessel to measure carotid artery blood flow.
With the pig in the supine position, a midline laparotomy was
performed. A catheter was inserted into the urinary bladder for
drainage of urine. A second catheter was inserted into the
mesenteric vein for blood sampling. The superior mesenteric
artery (SMA), the celiac trunk, and the hepatic artery were
identified close to their origin. After dissection to free these
vessels from the surrounding tissues, precalibrated ultrasonic
transit time flow probes (Transonic Systems, Ithaca, NY, USA)
were placed around the vessels and connected to an ultra-
sound blood flowmeter (T 207; Transonic Systems).
Through a small incision in the jejunum, a custom-made laser
Doppler flowmetry (LDF) probe (Oxford Optronix, Oxford, UK)
was sutured to the jejunum mucosa for measurements of
microcirculatory blood flow in the mucosa. A second LDF
probe was sutured to the adjacent jejunum muscularis. Both
Available online />Page 3 of 13
(page number not for citation purposes)
LDF probes were attached with six microsutures to ensure
continuous and steady contact with the tissue under investiga-
tion, preventing motion disturbance from respiration and gas-
trointestinal movements throughout the experiment. The
signals of the LDF probes were visualized on a computer mon-
itor. If the signal quality of a probe was poor, the position of the
probe was corrected immediately. The incision in the jejunum
also allowed controlled positioning of an air tonometer tube
(TRIP Sigmoid catheter; Datex-Ohmeda, GE Healthcare, Hel-
sinki, Finland). The bowel incision was then closed with con-
tinuous sutures.
For intramural intestinal tissue oxygen tension measurement, a
polarographic tissue oxygen tension sensor was inserted into
a section of healthy jejunum between the serosal and the
mucosal tissue planes. The method has been described previ-
ously [15,16]. Care was taken to minimize handling of the
small intestine and to return the bowel to a neutral position.
After preparation, the abdominal incision was closed and the
animals were allowed to recover from instrumentation and sta-
bilize for 60 minutes.
Throughout the entire study, all animals received a basal infu-
sion of 3 mL/kg per hour of Ringer lactate (RL) to avoid exces-
sive fluid administration. This fixed fluid administration resulted
in a low central venous and pulmonary capillary wedge pres-
sure (PCWP) of between 2 and 4 mm Hg at baseline. Body
temperature of the animals was maintained at 38.0 ± 0.5°C
with a forced-air patient air warming system (Warm Touch
5700; Mallinckrodt, Hennef, Germany). Baseline measure-
ments were performed after stabilization at t = 0 minutes. Sub-
sequently, all hemodynamic measurements were repeated
every 30 minutes for 4 hours. Blood samples were drawn
hourly after the measurements of the hemodynamic parame-
ters.
Immediately after baseline measurements, the pigs were ran-
domly assigned to one of three fluid treatment groups using a
reproducible set of computer-generated random numbers.
The assignments were kept in sealed, opaque, and sequen-
tially numbered envelopes until used. Once the fluid therapy
was assigned, the investigators were not blinded anymore.
The assigned fluid therapy was started 15 minutes after the
first measurement. The fluid treatment groups were as follows.
Groups
The 'restricted Ringer lactate' (R-RL) group (n = 9) received a
fixed administration of 3 mL/kg per hour of lactated Ringer
solution throughout the experiment without additional fluids.
The 'goal-directed Ringer lactate' (GD-RL) group (n = 9)
received a fixed administration of 3 mL/kg per hour of lactated
Ringer solution throughout the experiment. Additionally, this
group received an administration of 250 mL of lactated Ringer
solution as a bolus (within 3 to 4 minutes) if the mixed venous
oxygen saturation (SvO
2
) was less than 60% ('lockout' time
between two boluses = 30 minutes).
The 'goal-directed colloid' (GD-C) group (n = 9) received a
fixed administration of 3 mL/kg per hour of lactated Ringer
solution throughout the experiment. Additionally, this group
received an administration of 250 mL of hydroxyethyl starch
(HES) (130/0.4) as a bolus (within 3 to 4 minutes) if the SvO
2
was less than 60% (lockout time between two boluses = 30
minutes).
Measurements
Respiratory monitoring
Expired minute volume, tidal volume, respiratory rate, peak and
other respiratory pressures, positive end-expiratory pressure,
inspired and end-tidal carbon dioxide fraction, and inspired/
expired oxygen fraction were monitored (S/5 Critical Care
Monitor; Datex-Ohmeda, GE Healthcare) throughout the
study.
Hemodynamic monitoring
Mean arterial blood pressure (MAP) (mm Hg), central venous
pressure (CVP) (mm Hg), mean pulmonary artery pressure
(PAP) (mm Hg), hepatic vein pressure (HVP) (mm Hg), and
PCWP (mm Hg) were recorded with quartz pressure trans-
ducers. Pulse pressure variation (PPV) and stroke volume (SV)
were measured with a PiCCO (pulse contour cardiac output)
plus hemodynamic monitor (Pulsion Medical Systems GmbH,
Munich, Germany) connected to the arterial pressure trans-
ducer. Heart rate was measured from the electrocardiogram.
Heart rate, MAP, PAP, and CVP were displayed continuously
on a multi-modular monitor (S/5 Critical Care Monitor). A ther-
modilution method was used to measure cardiac output at
each measurement point (mean value of three consecutive
manually performed measurements with 5 mL of cold saline).
Core temperature was measured from the thermistor in the
pulmonary artery catheter. Regional blood flow in the SMA, the
celiac trunk, and the hepatic artery was continuously meas-
ured throughout the experiments with ultrasonic transit time
flowmetry (mL per minute) using two double-channel HT 206
flowmeters (Transonic Systems).
Microcirculatory blood flow was monitored continuously in the
mucosa and the muscularis of the jejunum using a multi-chan-
nel laser Doppler flowmeter system (Oxford Optronix). A
detailed description of the theory of LDF operation and practi-
cal details of LDF measurements have been published previ-
ously [17,18]. The regional blood flow and the LDF data were
acquired online with a sampling rate of 10 Hz via a multi-chan-
nel interface (MP 150; Biopac Systems Inc., Goleta, CA, USA)
with acquisition software (Acqknowledge 3.9; Biopac Sys-
tems Inc.) and saved on a portable computer. Laser Doppler
flowmeters are not calibrated to measure absolute blood flow
but indicate microcirculatory blood flow in arbitrary perfusion
units. Due to a relatively large variability of baseline values, the
Critical Care Vol 13 No 2 Hiltebrand et al.
Page 4 of 13
(page number not for citation purposes)
results usually are expressed as changes relative to baseline
[19-22] and that was also the case in the present study.
The jejunal intramucosal carbon dioxide pressure was meas-
ured with air tonometry (Tonocap
®
Monitor; Datex-Ohmeda,
GE Healthcare). The jejunal mucosal-to-arterial carbon dioxide
pressure gap (CO
2
gap) was calculated at each measurement
point.
Arterial, mixed venous, mesenteric, and hepatic venous blood
samples were withdrawn hourly from the indwelling catheters
and immediately analyzed in a blood gas analyzer (ABL 620;
Radiometer, Copenhagen, Denmark) for oxygen partial pres-
sure (pO
2
) (kPa), carbon dioxide partial pressure (pCO
2
)
(kPa), pH, lactate (mmol/L), and base excess (BE). Arterial oxy-
gen saturation (SO
2
) (percentage) and total hemoglobin con-
centration (Hb) (g/dL) were measured with an analyzer
specially adjusted to porcine blood (OSM 3; Radiometer). All
values were adjusted to body temperature. Mixed and hepatic
venous saturations were displayed continuously on two con-
tinuous cardiac output monitors (Vigilance; Edwards Lifesci-
ences LLC, Baxter, Irvine, CA, USA).
CI (mL/kg per minute), SMA flow index (SMAI) (mL/kg per
minute), and systemic vascular resistance index (SVRI) (mm
Hg/kg per minute) were indexed to body weight. SVRI was cal-
culated as: SVRI = (MAP - CVP)/CI [20,23].
Systemic oxygen delivery index (sDO
2
I) (mL/kg per minute),
systemic oxygen consumption index (sVO
2
I) (mL/kg per
minute), and the corresponding mesenteric (splanchnic) varia-
bles (mDO
2
I and mVO
2
I) (mL/kg per minute) were calculated
using the following formulas: Systemic (total body) oxygen
delivery index (sDO
2
) = (CI × CaO
2
), where CaO
2
is the arte-
rial oxygen content. Systemic (total body) oxygen consumption
index (sVO
2
) = (CI × [CaO
2
- CvO
2
]), where CvO
2
is the mixed
venous oxygen content. Mesenteric (splanchnic) oxygen deliv-
ery index (mDO
2
) = SMAI × CaO
2
. Mesenteric (splanchnic)
oxygen consumption index (mVO
2
) = SMAI × (CaO
2
- CmO
2
),
where CmO
2
is the mesenteric vein oxygen content. Oxygen
content (mL of O
2
/mL of blood) = ([pO
2
× 0.0031] + [Hb ×
SO
2
× 1.36])/100.
In the same animals an additional hypothesis was tested
regarding the changes of microcirculatory blood flow in
healthy colon and in a critically perfused colon anastomosis.
This data is published elsewhere [24].
Statistical analysis
Data were tested for normality by QQ-plot and Kolmogorov-
Smirnov test. All baseline data (that is, before the start of the
respective treatment at t = 0 minutes) were compared with
analysis of variance (ANOVA) or Kruskal-Wallis test to exclude
initial group discrepancies. Differences between the three
fluid treatment groups were assessed by ANOVA for repeated
measurements using group as between-subject factor and
time as within-subject factor. If a significant difference
between the groups was detected, a Tukey post hoc test was
performed to assess differences at individual time points.
Additionally, the area under the variable-time curve for each
variable of interest was calculated and compared with ANOVA
for group differences. A Tukey post hoc test was performed to
compare individual treatments if the ANOVA had detected sig-
nificant differences between the groups. Measurements of
microcirculatory blood flow (LDF) were transformed with base-
line set to 100% (t = 0 minutes) prior to statistical analysis.
Absolute values were used for all other calculations. Data are
presented as means ± standard deviations unless otherwise
specified. A P value of less than 0.05 was considered signifi-
cant. For statistical calculations, SAS version 8 (SAS Institute
Inc., Cary, NC, USA) was used.
Results
All animals survived until the end of the experiment and were
included in the final data analysis. The continuous intravenous
infusions of basal RL administered during the entire experi-
ments (induction until the end of the study) to the R-RL, GD-
RL, and GD-C groups were 924 ± 44, 943 ± 68, and 917 ±
41 mL, respectively. RL administered as repeated bolus infu-
sions (triggered by an SvO
2
of less than 60%) was 1,794 ±
211 mL in the GD-RL group while the GD-C group received a
total of 831 ± 267 mL of 6% HES (130/0.4) as bolus infu-
sions.
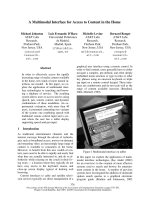
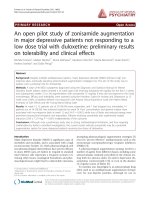
Systemic hemodynamic data are presented in Figure 1 and
Table 1. At baseline, there were no significant differences
between the three groups in any parameter measured. In the
R-RL group, SvO
2
was 49.5 ± 4.0% at baseline and remained
low (Figure 1). The target value of 60% was not reached in any
of the animals in this group at any time point. In the GD-RL
group, SvO
2
increased over time and was 56 ± 5% after 4
hours. Only in three out of nine animals was the target value
reached in this group. In the GD-C group, SvO
2
increased to
63 ± 4% after the first bolus and remained high. The target
value for SvO
2
was reached in all nine animals in this group.
In the R-RL group, CI, SV, PPV, MAP, PAP, CVP, hepatic
venous pressure (HVP), and PCWP remained largely
unchanged. In the GD-RL group, CI and MAP increased
slowly (by 15%) over the 4 hours of observation time. SV
increased continuously (by greater than 30%) during the
study. In the GD-C group, CI and MAP increased by 30%
already after the first fluid bolus and remained significantly
higher than in the GD-RL group. SV increased by more than
50% after the first fluid bolus and decreased slightly thereaf-
ter, resulting in almost identical SV compared with the GD-RL
group at the end of the study. PPV in the GD-C group
decreased sharply after the first bolus, followed by an increase
after 60 minutes. During the remainder of the study, PPV val-
ues in the two goal-directed groups were similar and
Available online />Page 5 of 13
(page number not for citation purposes)
Figure 1
Systemic hemodynamic parametersSystemic hemodynamic parameters. (a) Changes in mixed venous oxygen saturation (SvO
2
) (mean ± SD) before (baseline) and during the different
fluid treatment strategies. SvO
2
was the target parameter for fluid administration. (b) Changes in mean arterial pressure (mean ± SD) before (base-
line) and during the different fluid treatment strategies. (c) Changes in cardiac index (mean ± SD) before (baseline) and during the different fluid
treatment strategies. The restricted Ringer lactate fluid therapy (R-RL) group received 3 mL/kg per hour of lactated Ringer solution throughout the
entire experiment. The goal-directed Ringer lactate fluid therapy (GD-RL) group received 3 mL/kg per hour of lactated Ringer solution plus 250 mL
of lactated Ringer solution if SvO
2
was less than 60%. The goal-directed colloid fluid therapy (GD-C) group received 3 mL/kg per hour of lactated
Ringer solution plus 250 mL of hydroxyethyl starch (130/0.4) if SvO
2
was less than 60%. Significant differences (P < 0.05) for area under the curve:
#
R-RL versus GD-RL,
†
R-RL versus GD-C,
$
GD-RL versus GD-C. Significant differences (P < 0.05) for analysis of variance for repeated measure-
ments (Tukey post hoc test): *R-RL versus GD-RL,
≠
R-RL versus GD-C,
§
GD-RL versus GD-C. SD, standard deviation.
Critical Care Vol 13 No 2 Hiltebrand et al.
Page 6 of 13
(page number not for citation purposes)
decreased over time. Filling pressures (that is, PAP, CVP,
HVP, and PCWP) increased similarly in the GD-RL and GD-C
groups.
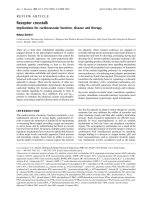
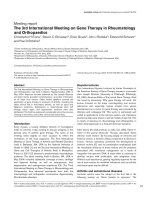
Regional blood flow (Figure 2 and Table 1) in the carotid artery
was unchanged in the R-RL group but increased by 20% in
the GD-RL group and by almost 50% in the GD-C group. On
the other hand, blood flow in the celiac trunk and the hepatic
artery remained virtually unchanged in all three groups
throughout the experiment. SMA flow decreased by 20% in
the R-RL group over time but remained nearly unchanged in
the GD-RL group. On the other hand, SMAI flow increased
significantly in the GD-C group (by 20%).
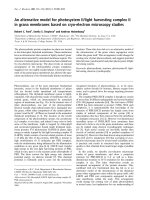
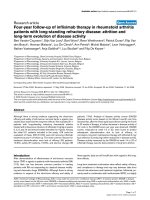
Microcirculatory blood flow in the jejunum mucosa (Figure 3)
remained largely unchanged in the R-RL and GD-RL groups
throughout the 4 hours of treatment but rapidly increased by
up to 50% in the GD-C group and remained high until the end
of the experiments. Microcirculatory blood flow in the jejunum
muscularis (Table 1) remained unchanged in the GD-C group
but decreased significantly in the other two groups.
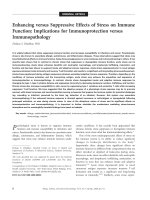
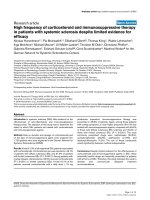
Jejunum tissue oxygen tension (Figures 3 and 4) decreased by
15% in the R-RL group but remained unchanged in the GD-RL
group. In the GD-C group, it increased by more than 40%, vir-
tually in parallel with mucosal microcirculatory flow, and
remained high until the end. Jejunal mucosa carbon dioxide
tension (Figure 3) remained almost unchanged in the two crys-
talloid fluid groups but decreased by 10% in the colloid group.
Systemic oxygen delivery increased by almost 40% in the GD-
C group and 20% in the GD-RL group, and systemic oxygen
extraction ratio decreased by 25% in the GD-C group and
15% in the GD-RL group. Both parameters decreased in the
R-RL group (Table 2). Hepatic venous oxygen saturation (Fig-
ure 5) increased rapidly by 40% in the GD-C group but
increased slowly in the GD-RL group and decreased in the R-
RL group. Mesenteric oxygen extraction ratio (Figure 5)
decreased by more than 20% in the GD-C group but
increased by 10% in the two crystalloid fluid groups. Lactate
levels in the mesenteric vein (Figure 5) remained unchanged in
the R-RL and GD-RL groups and decreased by 50% in the
GD-C group. Hepatic vein lactate was similar in all groups.
Table 1
Systemic, regional, and local hemodynamic variables
Heart rate
a, b
(beats per minute)
SV
b
(mL/beat)
SVRI
a, b
(mm Hg/kg per minute)
CVP
(mm Hg)
HVP
(mm Hg)
PCWP
b
(mm Hg)
CeliacusI
(mL/kg per minute)
MBF JM
a, b
(percentage of baseline)
Restricted Ringer lactate solution (R-RL)
0 minutes 117 ± 2 28.1 ± 8.4 732 ± 84 2.8 ± 1 3.8 ± 1.4 3.1 ± 0.6 4.0 ± 0.9 100 ± 0
30 minutes 117 ± 4 26.6 ± 6.7 744 ± 123 3.1 ± 0.8 4.5 ± 1 3.3 ± 0.7 4.1 ± 1.0 93 ± 20
180 minutes 123 ± 15 23.7 ± 5.7 868 ± 161 3.3 ± 0.7 3.9 ± 1.4 3.2 ± 0.9 4.9 ± 1.2 74 ± 24
240 minutes 128 ± 14 24.2 ± 5.2 835 ± 149 2.8 ± 1.1 3.9 ± 0.9 2.9 ± 0.7 5.1 ± 1.1 71 ± 18
Goal-directed Ringer lactate solution (GD-RL)
0 minutes 110 ± 11 25.4 ± 6.6 705 ± 140 3 ± 1.1 4.3 ± 1.4 3.3 ± 1.1 3.8 ± 1.4 100 ± 0
30 minutes 101 ± 4 28.3 ± 7 652 ± 157 3.3 ± 1.1 4.6 ± 1.1 3.6 ± 1 3.9 ± 1.5 97 ± 22
180 minutes 106 ± 15
a
30.8 ± 6.5 666 ± 147 3.8 ± 1.1 5.5 ± 0.9 3.9 ± 1.2 6.2 ± 1.7 54 ± 18
240 minutes 103 ± 18
a, c
33.2 ± 6.7 646 ± 90
a
4 ± 0.9 5.6 ± 1 4.4 ± 1.2 5.8 ± 1.1 49 ± 11
Goal-directed colloid solution (GD-C)
0 minutes 113 ± 7 25.2 ± 9.8 682 ± 155 3 ± 0.7 4.1 ± 0.9 3.3 ± 0.5 4.3 ± 1.3 100 ± 0
30 minutes 98 ± 9 38.7 ± 7.3
d
589 ± 76 4.3 ± 0.7
d
5.4 ± 1 4.6 ± 0.8 5.0 ± 1.5 122 ± 19
180 minutes 106 ± 16
d
35.1 ± 11
d
622 ± 109
d
3.8 ± 1.1 5.1 ± 1 3.9 ± 1.1 5.4 ± 1.5 101 ± 19
d, e
240 minutes 109 ± 20
d
33.9 ± 12 563 ± 53
d
4.2 ± 0.9
d
5.7 ± 0.9 3.7 ± 0.9 5.4 ± 1.5 94 ± 22
d, e
Data are presented as mean ± standard deviation. Microcirculatory blood flow was set at 100% at t = 0 minutes. t = 0 baseline values are from
before the start of the respective fluid therapy. At t = 30 minutes, effects of one fluid bolus, 250 mL of lactated Ringer solution in the GD-LR group
or hydroxyethyl starch in the GD-C group, are presented. At t = 240 minutes, effects after an additional 1,794 ± 211 mL of lactated Ringer
solution in the GD-LR group and an additional 831 ± 267 mL of hydroxyethyl starch (130/0.4) in the GD-C group are presented. Significant
differences (P < 0.05) for area under the curve:
a
R-RL versus GD-RL,
b
R-RL versus GD-C. Significant differences (P < 0.05) for analysis of
variance for repeated measurements (Tukey post hoc test):
c
R-RL versus GD-RL,
d
R-RL versus GD-C,
e
GD-RL versus GD-C. The R-RL group
received 3 mL/kg per hour of lactated Ringer solution throughout the entire experiment. The GD-RL group received 3 mL/kg per hour of lactated
Ringer solution plus 250 mL of lactated Ringer solution if SvO
2
was less than 60%. The GD-C group received 3 mL/kg per hour of lactated Ringer
solution plus 250 mL of hydroxyethyl starch (130/0.4) if SvO
2
was less than 60%. CeliacusI, truncus celiacus flow index; CVP, central venous
pressure; HVP, hepatic venous pressure; MBF JM, microcirculatory blood flow in the muscularis of the jejunum; PCWP, pulmonary capillary
wedge pressure; SV, stroke volume; SVRI, systemic vascular resistance index.
Available online />Page 7 of 13
(page number not for citation purposes)
Figure 2
Regional blood flow parametersRegional blood flow parameters. (a) Changes in superior mesenteric artery flow index (mean ± SD) before (baseline) and during the different fluid
treatment strategies. (b) Changes in hepatic artery flow index (mean ± SD) before (baseline) and during the different fluid treatment strategies. (c)
Changes in carotid artery flow index (mean ± SD) before (baseline) and during the different fluid treatment strategies. The restricted Ringer lactate
fluid therapy (R-RL) group received 3 mL/kg per hour of lactated Ringer solution throughout the entire experiment. The goal-directed Ringer lactate
fluid therapy (GD-RL) group received 3 mL/kg per hour of lactated Ringer solution plus 250 mL of lactated Ringer solution if mixed venous oxygen
saturation (SvO
2
) was less than 60%. The goal-directed colloid fluid therapy (GD-C) group received 3 mL/kg per hour of lactated Ringer solution
plus 250 mL of hydroxyethyl starch (130/0.4) if SvO
2
was less than 60%. Significant differences (P < 0.05) for area under the curve:
#
R-RL versus
GD-RL,
†
R-RL versus GD-C,
$
GD-RL versus GD-C. Significant differences (P < 0.05) for analysis of variance for repeated measurements (Tukey
post hoc test): *R-RL versus GD-RL,
≠
R-RL versus GD-C,
§
GD-RL versus GD-C. SD, standard deviation.
Critical Care Vol 13 No 2 Hiltebrand et al.
Page 8 of 13
(page number not for citation purposes)
Figure 3
Intestinal perfusion and oxygenation parametersIntestinal perfusion and oxygenation parameters. (a) Relative changes in microcirculatory blood flow in the jejunum mucosa (mean ± SD) before
(baseline) and during the different fluid treatment strategies. Blood flow was set at 100% at baseline. (b) Changes in jejunum wall tissue oxygen ten-
sion (mean ± SD) before (baseline) and during the different fluid treatment strategies. (c) Changes in mucosal carbon dioxide tension in the jejunum
(mean ± SD) before (baseline) and during the different fluid treatment strategies. The restricted Ringer lactate fluid therapy (R-RL) group received 3
mL/kg per hour of lactated Ringer solution throughout the entire experiment. The goal-directed Ringer lactate fluid therapy (GD-RL) group received
3 mL/kg per hour of lactated Ringer solution plus 250 mL of lactated Ringer solution if mixed venous oxygen saturation (SvO
2
) was less than 60%.
The goal-directed colloid fluid therapy (GD-C) group received 3 mL/kg per hour of lactated Ringer solution plus 250 mL of hydroxyethyl starch (130/
0.4) if SvO
2
was less than 60%. Significant differences (P < 0.05) for area under the curve:
#
R-RL versus GD-RL,
†
R-RL versus GD-C,
$
GD-RL ver-
sus GD-C. Significant differences (P < 0.05) for analysis of variance for repeated measurements (Tukey post hoc test): *R-RL versus GD-RL,
≠
R-RL
versus GD-C,
§
GD-RL versus GD-C. SD, standard deviation.
Available online />Page 9 of 13
(page number not for citation purposes)
Glucose concentration in the mesenteric vein decreased by
15% in the R-RL group, was virtually unchanged in the GD-RL
group, and increased by 12% in the GD-C group. Arterial Hb
(Table 2) increased slightly in the R-RL group but decreased
by approximately 10% in the two goal-directed groups.
Discussion
In this study, the effects of three different fluid regimens on
systemic and regional blood flow as well as intestinal microcir-
culation and tissue oxygen tension were investigated during
major abdominal surgery in pigs. The two groups receiving
goal-directed fluid therapy (the GD-RL and GD-C groups) had
increased cardiac output and increased regional blood flow to
the SMA compared with the group receiving a restricted fluid
regimen (the R-RL group). However, the effects of the two
goal-directed fluid regimens were remarkably different in
regard to microcirculatory blood flow, tissue oxygen tension,
and metabolic markers in the small bowel. The first bolus of
goal-directed administration of colloids resulted in a 30%
increase in microcirculatory blood flow in the small bowel
mucosa with a concomitant increase in tissue oxygen tension
(30%), an increase in mesenteric vein glucose (12%), and
decreases in mesenteric lactate (50%), mesenteric oxygen
extraction (20%), and intestinal carbon dioxide (Figures 3, 4
and 5). On the other hand, even repeated boluses of RL in the
GD-RL group did not increase microcirculatory blood flow in
the small bowel mucosa and showed virtually no effect on tis-
sue oxygenation, intestinal carbon dioxide, mesenteric lactate,
or glucose levels. Comparable PPV, SV, and Hb values at the
end of the study suggest similarly appropriate intravascular
fluid volume in the two GDT groups.
Although systemic and regional blood flow increased signifi-
cantly over time in the GD-RL group, the goal of SvO
2
of at
least 60% was not achieved in this group. It could be argued
that if even larger amounts of crystalloids (more than 15 mL/kg
per hour) had been administered microcirculatory blood flow
in the small bowel might have increased comparably to the col-
loid group. However, dynamic systemic hemodynamic param-
eters such as PPV, SV, and Hb suggest that the two goal-
directed groups had similar intravascular fluid volume at the
end of the study. Furthermore, despite increasing systemic
and regional blood flow over time, no trend of improvement in
intestinal tissue oxygen tension or microcirculatory blood flow
(Figure 3) in the goal-directed crystalloid group was found. In
addition, even larger amounts of crystalloids (over 20 mL/kg
per hour) did not increase perioperative small intestinal tissue
oxygen tension [25].
Intestinal autoregulation does not explain the differences
between the groups and suggests that the different pharma-
cological properties of the two fluid types, lactated Ringer
solution and 6% HES (130/0.4), were to a large extent
responsible for the effects on the intestinal microcirculation.
Figure 4
Relative changes in intestinal microcirculation and tissue oxygen tension (ptiO
2
)Relative changes in intestinal microcirculation and tissue oxygen tension (ptiO
2
). Black squares indicate relative changes in microcirculatory blood
flow (MBF) in the goal-directed colloid fluid therapy (GD-C) group. Open squares indicate relative changes in ptiO
2
in the GD-C group. Black trian-
gles indicate relative changes in MBF in the goal-directed Ringer lactate fluid therapy (GD-RL) group. Open triangles indicate relative changes in
ptiO
2
in the GD-RL group. Black circles indicate relative changes in MBF in the restricted Ringer lactate fluid therapy (R-RL) group. Open circles
indicate relative changes in ptiO
2
in the R-RL group. The R-RL group received 3 mL/kg per hour of lactated Ringer solution throughout the entire
experiment. The GD-RL group received 3 mL/kg per hour of lactated Ringer solution plus 250 mL of lactated Ringer solution if mixed venous oxygen
saturation (SvO
2
) was less than 60%. The GD-C group received 3 mL/kg per hour of lactated Ringer solution plus 250 mL of hydroxyethyl starch
(130/0.4) if SvO
2
was less than 60%. Baseline was set at 100% for all parameters. Significant differences (P < 0.05) for area under the curve:
†
R-
RL versus GD-C,
$
GD-RL versus GD-C. Significant differences (P < 0.05) for analysis of variance for repeated measurements (Tukey post hoc test):
≠
R-RL versus GD-C,
§
GD-RL versus GD-C.
Critical Care Vol 13 No 2 Hiltebrand et al.
Page 10 of 13
(page number not for citation purposes)
RL is distributed within the whole extracellular space (that is,
three fourths of the administered amount leave the intravascu-
lar space within minutes [26], thus expanding the extravascu-
lar space with interstitial fluid accumulation instead of
increasing nutritive microcirculatory perfusion). Colloids, on
the other hand, increase the intravascular volume as long as
the endothelial glycocalix is competent [26] and thus may
result in increased microcirculatory perfusion. The results are
also in accordance with studies from Lang and colleagues
[27] and Mythen and colleagues [5]. Lang and colleagues
showed that colloid administration resulted in increased skel-
etal muscle oxygen tension in patients but that RL did not.
Mythen and colleagues measured gastrointestinal blood flow
indirectly by gastric tonometry in patients undergoing cardiac
surgery. The authors found improved gastric mucosa pH and
outcome in patients receiving goal-directed administration of
colloids compared with control patients [5]. In addition, sev-
eral other clinical studies have reported improved outcome
after major surgery in patients receiving goal-directed HES
[8,28-31] compared with conventional fluid therapy. However,
none of these studies measured microcirculatory blood flow,
tissue oxygen tension, or regional metabolic parameters
directly in the gastrointestinal tract.
The strength of the present study is the combination of various
methods to explore small intestinal microcirculation, oxygen
transport, and markers of oxygen metabolism simultaneously.
Interestingly, mesenteric vein glucose decreased in the fluid-
Figure 5
Splanchnic oxygenation parametersSplanchnic oxygenation parameters. (a) Changes in hepatic vein oxygen saturation (mean ± SD) before (baseline) and during the different fluid treat-
ment strategies. (b) Changes in mesenteric vein glucose (mean ± SD) before (baseline) and during the different fluid treatment strategies. (c)
Changes in mesenteric oxygen extraction ratio (mean ± SD) before (baseline) and during the different fluid treatment strategies. (d) Changes in
mesenteric vein lactate (mean ± SD) before (baseline) and during the different fluid treatment strategies. The restricted Ringer lactate fluid therapy
(R-RL) group received 3 mL/kg per hour of lactated Ringer solution throughout the entire experiment. The goal-directed Ringer lactate fluid therapy
(GD-RL) group received 3 mL/kg per hour of lactated Ringer solution plus 250 mL of lactated Ringer solution if mixed venous oxygen saturation
(SvO
2
) was less than 60%. The goal-directed colloid fluid therapy (GD-C) group received 3 mL/kg per hour of lactated Ringer solution plus 250 mL
of hydroxyethyl starch (130/0.4) if SvO
2
was less than 60%. Significant differences (P < 0.05) for area under the curve:
#
R-RL versus GD-RL,
†
R-RL
versus GD-C,
$
GD-RL versus GD-C. Significant differences (P < 0.05) for analysis of variance for repeated measurements (Tukey post hoc test):
*R-RL versus GD-RL,
≠
R-RL versus GD-C,
§
GD-RL versus GD-C. SD, standard deviation.
Available online />Page 11 of 13
(page number not for citation purposes)
restricted animals but increased in the colloid group. This is in
accordance with a previous study from Krejci and colleagues
[32], which showed that a reduction in intestinal glucose lev-
els was an early sign (earlier than increased lactate) of gas-
trointestinal hypoperfusion.
In light of the microcirculatory effects of colloid administration
in the present study, intestinal tissue oxygen pressure as well
as mesenteric metabolic markers indicate augmented oxygen
supply and sufficient cellular substrate. These findings may
explain the basic, tissue-level mechanisms by which goal-
directed administration of colloids has a beneficial impact on
outcome.
The lack of effect of any of the fluid regimens used in this study
on blood flow in the celiac trunk and the hepatic artery com-
pared with a marked increase in systemic and SMA blood
flows was an unanticipated finding and demonstrates once
again the heterogeneous distribution of blood flow during dif-
ferent insults [13,20,33]. This underlines the fact that it is not
appropriate to assume that changes in systemic, regional, and
microcirculatory blood flow occur in unison under nonseptic
conditions.
The main limitation of this study is the relatively short observa-
tion time (4 hours), which is too short to verify the effect of the
respective fluid regimens on outcome. However, the aim of
this study was to identify possible mechanisms and compare
the acute effects of restricted and goal-directed fluid therapy
on microcirculatory blood flow as well as several markers of
tissue oxygenation and metabolism in the gut.
The study was performed in an animal model because direct
measurements of regional and local microcirculatory blood
flow in patients are invasive, time-consuming, and require spe-
cial skills and instruments that are not readily available at the
bedside. This is also the reason why no clinical study, to our
knowledge, has measured the direct effects of goal-directed
fluid therapy with crystalloid and colloid fluids on intestinal
microcirculation, tissue oxygen tension, and metabolism.
Therefore, the pathophysiologic background of improved out-
come with goal-directed fluid therapy based on colloids was
so far largely unknown. We chose the pig for this study
because of its anatomical and physiologic similarity to humans
with respect to the cardiovascular system and the digestive
tract [34].
Table 2
Oxygen delivery, extraction, and other variables
sDO
2
I
a, b
(mL/kg per minute)
sER
a-c
(percentage)
mDO
2
I
b
(mm Hg/kg per minute)
Mesent lac
(mmol/L)
Arterial Hb
b
(g/L)
Arterial pH Arterial pO
2
(mm Hg)
Arterial
pCO
2
(mm Hg)
Arterial
BE
(mmol/L)
Restricted Ringer lactate solution (R-RL)
0 minutes 109 ± 11 49 ± 5 25 ± 2 1.5 ± 0.4 101 ± 7 7.51 ± 0.02 138 ± 9 36 ± 2 5.4 ± 0.9
60 minutes 103 ± 11 48 ± 6 26 ± 2 1.4 ± 0.6 102 ± 6 7.51 ± 0.02 135 ± 10 36 ± 3 5.3 ± 1.2
180 minutes 97 ± 12 50 ± 6 21 ± 2 1.2 ± 0.3 105 ± 9 7.5 ± 0.02 134 ± 15 36 ± 2 4.5 ± 1.7
240 minutes 97 ± 12 50 ± 4 20 ± 1 1.3 ± 0.2 104 ± 6 7.49 ± 0.04 135 ± 12 37 ± 2 4.3 ± 2.0
Goal-directed Ringer lactate solution (GD-RL)
0 minutes 109 ± 17 51 ± 4 26 ± 6 1.4 ± 0.2 100 ± 10 7.52 ± 0.05 132 ± 11 37 ± 3 6.3 ± 1.9
60 minutes 116 ± 19 50 ± 4 30 ± 8 1.2 ± 0.2 99 ± 10 7.52 ± 0.04 132 ± 10 36 ± 2 6.4 ± 2.0
180 minutes 134 ± 26 44 ± 4 27 ± 6 1.2 ± 0.3 96 ± 6 7.49 ± 0.037 127 ± 10 38 ± 2 5.6 ± 2.0
240 minutes 130 ± 18 42 ± 7 26 ± 7 1.2 ± 0.3 90 ± 8 49 ± 0.03 126 ± 9 38 ± 3 5.1 ± 2.1
Goal-directed colloid solution (GD-C)
0 minutes 116 ± 18 50 ± 6 26 ± 6 1.4 ± 0.4 97 ± 12 7.52 ± 0.03 135 ± 12 37 ± 3 5.8 ± 1.2
60 minutes 141 ± 22
c
38 ± 5
b, c
35 ± 8 0.9 ± 0.2 86 ± 10 7.5 ± 0.02 132 ± 17 38 ± 3 5.7 ± 1.4
180 minutes 151 ± 33
d
38 ± 4
d, e
29 ± 6
d
0.8 ± 0.3 89 ± 11
d
7.49 ± 0.02 131 ± 14 38 ± 1 5.0 ± 1.3
240 minutes 158 ± 38
d
37 ± 5
d
27 ± 5
d
0.8 ± 0.3 87 ± 12
d
7.49 ± 0.02 128 ± 16 37 ± 1 4.6 ± 1.0
Data are presented as mean ± standard deviation. t = 0 baseline values are from before the start of the respective fluid therapy. The measurements
were performed hourly for 4 hours. Significant differences (P < 0.05) for area under the curve:
a
R-RL versus GD-RL,
b
R-RL versus GD-C,
c
GD-RL
versus GD-C. Significant differences (P < 0.05) for analysis of variance for repeated measurements (Tukey post hoc test):
d
R-RL versus GD-C,
e
GD-RL versus GD-C. The R-RL group received 3 mL/kg per hour of lactated Ringer solution throughout the entire experiment. The GD-RL group
received 3 mL/kg per hour of lactated Ringer solution plus 250 mL of lactated Ringer solution if SvO
2
was less than 60%. The GD-C group
received 3 mL/kg per hour of lactated Ringer solution plus 250 mL of hydroxyethyl starch (130/0.4) if SvO
2
was less than 60%. BE, standard base
excess; Hb, hemoglobin concentration; mDO
2
I, mesenteric oxygen delivery; mesent lac, mesenteric venous lactate; pCO
2
, carbon dioxide partial
pressure; pO
2
, oxygen partial pressure; sDO
2
, systemic oxygen delivery index; sER, systemic oxygen extraction ratio.
Critical Care Vol 13 No 2 Hiltebrand et al.
Page 12 of 13
(page number not for citation purposes)
Another limitation of this experimental study concerns the
choice of treatment target for fluid therapy. We do not suggest
that the target of mixed venous saturation above 60%, as used
in this study, is valid for patients undergoing major surgery.
First, the target of 60% for mixed venous saturation seems
rather low in patients, but it is ambitious in pigs because nor-
mal SvO
2
in pigs is lower than in humans [34]. Second, mixed
venous saturation measurements require a pulmonary artery
catheter, which appears invasive for patients undergoing
uncomplicated major surgery, particularly since other target
parameters have been evaluated [8-10]. Last but not least,
based on the currently available data, SV optimization for intra-
venous fluid challenges is the best evaluated method for indi-
vidualized goal-directed fluid therapy and therefore seems
preferable for human studies. However, for the purpose of this
study, we considered this method very reliable and our animals
were all instrumented with pulmonary artery catheters with
continuous SvO
2
monitoring.
An additional limitation of the study is that the two goal-
directed groups received the same size of fluid bolus with
identical lockout times. Thus, the GD-RL group may have
needed more time to receive a hemodynamically equally effec-
tive amount of fluid. The aim of goal-directed fluid therapy
(GDT) in the present study was to achieve a physiologic goal
over a certain time period. The size of the intravenous fluid
bolus administered in this study corresponds to 580 mL in a
70-kg patient and reflects clinical practice at our institution in
hemodynamically stable patients (bolus infusion of approxi-
mately 500 mL). After such a bolus, a re-evaluation of the
hemodynamics of the patient is mandatory. Thus, also
because fluid distribution after a rapid bolus administration
needed some time, it was not considered advisable to have a
lockout time shorter than 30 minutes. A slight delay in achiev-
ing the goal parameter in the GD-RL group was found to be
acceptable under the circumstances, particularly since it has
been shown in a previous study that early aggressive fluid
administration during surgery with crystalloids (> 20 mL/kg
per hour) did not improve intestinal tissue oxygen tension com-
pared with fluid restriction [25].
The present study indicates that, in the small bowel, fluid
restriction as reflected by the data from the R-RL group results
in impaired microcirculation and decreased tissue oxygen ten-
sion and cellular oxygen metabolism. Goal-directed fluid ther-
apy with crystalloids had virtually no beneficial effects on either
the intestinal microcirculation or the tissue oxygen tension but
requires considerable amounts of fluids. However, excessive
fluid administration may result in interstitial fluid accumulation
and weight gain. Significant perioperative weight gain, how-
ever, results in increased mortality [35].
Conclusions
The results from this animal study directly show for the first
time that goal-directed fluid therapy with colloids increases
intestinal microcirculatory blood flow and tissue oxygen ten-
sion compared with GDT with lactated Ringer solution or fluid
restriction. Neither goal-directed crystalloid treatment nor fluid
restriction had beneficial effects on intestinal microcirculation
or tissue oxygen tension. In addition, mesenteric venous glu-
cose and lactate concentrations suggest that intestinal cellular
substrate levels were increased in the colloid group compared
with the other groups. Consequently, the presented data sup-
port the notion that perioperative goal-directed fluid therapy
with colloids might be beneficial to restore intravascular vol-
ume depletion, intestinal microcirculatory blood flow, and tis-
sue oxygen delivery during major abdominal surgery.
Competing interests
The authors declare that they have no competing interests.
Authors' contributions
LBH participated in experimental design, animal preparation,
performance and supervision of experimental work, preliminary
analysis of the data, and writing of the manuscript and pro-
vided supervision and oversight of the entire project. OK par-
ticipated in experimental design, animal preparation,
performance and supervision of experimental work, and analy-
sis of the data and helped to draft the manuscript. MA partici-
pated in animal preparation, performance and supervision of
experimental work, and preliminary analysis of the data and
helped to draft the manuscript. SB participated in animal prep-
aration, performance and supervision of experimental work,
and preliminary analysis of the data. AK consulted on the
experimental design, assisted with statistics, and participated
in drafting the manuscript. GHS provided assistance with and
consulted on the experimental design, made a substantial con-
tribution to the manuscript (in particular, the Discussion sec-
Key messages
• Colloids (hydroxyethyl starch 130/0.4) markedly
increased microcirculatory blood flow and tissue oxygen
tension in the small intestinal mucosa.
• Colloids decreased intestinal carbon dioxide gap,
decreased mesenteric venous lactate, and increased
mesenteric venous glucose concentration, suggesting
improved intestinal cellular substrate levels.
• Colloids significantly increased mixed venous saturation
with less fluid administered compared with crystalloids.
• Different fluid therapy regimens had no apparent effects
on hepatic arterial blood flow, indicating sufficient liver
tissue oxygenation even during restricted fluid adminis-
tration.
• The results of this animal study suggest possible mech-
anisms for improved outcome after goal-directed ther-
apy with colloids in major abdominal surgery in patients.
This hypothesis, however, requires further studies.
Available online />Page 13 of 13
(page number not for citation purposes)
tion), and served as senior advisor. All authors read and
approved the final manuscript.
Acknowledgements
The authors thank Daniel Mettler, Daniel Zalokar, and Olgica Beslac for
assistance during animal preparation and support during the experi-
ments. This work was supported by the Research Fund of the Depart-
ment of Anaesthesiology, Inselspital, Bern University Hospital, Bern,
Switzerland, and the Stiftung für Forschung in Anaesthesiologie und
Intensivmedizin, Inselspital, Bern University Hospital, Bern, Switzerland.
References
1. Bozzetti F, Gianotti L, Braga M, Di Carlo V, Mariani L: Postopera-
tive complications in gastrointestinal cancer patients: the joint
role of the nutritional status and the nutritional support. Clin
Nutr 2007, 26:698-709.
2. Law WL, Choi HK, Lee YM, Ho JW, Seto CL: Anastomotic leak-
age is associated with poor long-term outcome in patients
after curative colorectal resection for malignancy. J Gastroin-
test Surg 2007, 11:8-15.
3. Mythen MG, Webb AR: Intra-operative gut mucosal hypoper-
fusion is associated with increased post-operative complica-
tions and cost. Intensive Care Med 1994, 20:99-104.
4. Bland RD, Shoemaker WC: Probability of survival as a prognos-
tic and severity of illness score in critically ill surgical patients.
Crit Care Med 1985, 13:91-95.
5. Mythen MG, Webb AR: Perioperative plasma volume expan-
sion reduces the incidence of gut mucosal hypoperfusion dur-
ing cardiac surgery. Arch Surg 1995, 130:423-429.
6. Theodoropoulos G, Lloyd LR, Cousins G, Pieper D: Intraopera-
tive and early postoperative gastric intramucosal pH predicts
morbidity and mortality after major abdominal surgery. Am
Surg 2001, 67:303-308. discussion 308–309.
7. Ivatury RR, Simon RJ, Islam S, Fueg A, Rohman M, Stahl WM: A
prospective randomized study of end points of resuscitation
after major trauma: global oxygen transport indices versus
organ-specific gastric mucosal pH. J Am Coll Surg 1996,
183:145-154.
8. Gan TJ, Soppitt A, Maroof M, el-Moalem H, Robertson KM, Moretti
E, Dwane P, Glass PS: Goal-directed intraoperative fluid
administration reduces length of hospital stay after major sur-
gery. Anesthesiology 2002, 97:820-826.
9. Pearse R, Dawson D, Fawcett J, Rhodes A, Grounds RM, Bennett
ED: Early goal-directed therapy after major surgery reduces
complications and duration of hospital stay. A randomised,
controlled trial [ISRCTN38797445]. Crit Care 2005,
9:R687-693.
10. Lopes MR, Oliveira MA, Pereira VO, Lemos IP, Auler JO Jr, Michard
F: Goal-directed fluid management based on pulse pressure
variation monitoring during high-risk surgery: a pilot rand-
omized controlled trial.
Crit Care 2007, 11:R100.
11. Sinclair S, James S, Singer M: Intraoperative intravascular vol-
ume optimisation and length of hospital stay after repair of
proximal femoral fracture: randomised controlled trial. BMJ
1997, 315:909-912.
12. Wakeling HG, McFall MR, Jenkins CS, Woods WG, Miles WF,
Barclay GR, Fleming SC: Intraoperative oesophageal Doppler
guided fluid management shortens postoperative hospital
stay after major bowel surgery. Br J Anaesth 2005,
95:634-642.
13. Ali SZ, Bracht H, Krejci V, Beck M, Stalder M, Hiltebrand L, Takala
J, Brandt S, Jakob SM: The immediate and sustained effects of
volume challenge on regional blood flows in pigs. Anesth
Analg 2008, 106:595-600. table of contents.
14. Grocott MP, Mythen MG, Gan TJ: Perioperative fluid manage-
ment and clinical outcomes in adults. Anesth Analg 2005,
100:1093-1106.
15. Fleischmann E, Herbst F, Kugener A, Kabon B, Niedermayr M,
Sessler DI, Kurz A: Mild hypercapnia increases subcutaneous
and colonic oxygen tension in patients given 80% inspired
oxygen during abdominal surgery. Anesthesiology 2006,
104:944-949.
16. Ratnaraj J, Kabon B, Talcott MR, Sessler DI, Kurz A: Supplemen-
tal oxygen and carbon dioxide each increase subcutaneous
and intestinal intramural oxygenation. Anesth Analg 2004,
99:207-211.
17. Kiel JW, Riedel GL, DiResta GR, Shepherd AP: Gastric mucosal
blood flow measured by laser-Doppler velocimetry. Am J
Physiol 1985, 249:G539-545.
18. Shepherd AP, Riedel GL: Continuous measurement of intesti-
nal mucosal blood flow by laser-Doppler velocimetry. Am J
Physiol 1982, 242:G668-672.
19. Krejci V, Hiltebrand LB, Sigurdsson GH: Effects of epinephrine,
norepinephrine, and phenylephrine on microcirculatory blood
flow in the gastrointestinal tract in sepsis. Crit Care Med 2006,
34:1456-1463.
20. Hiltebrand LB, Krejci V, Banic A, Erni D, Wheatley AM, Sigurdsson
GH: Dynamic study of the distribution of microcirculatory
blood flow in multiple splanchnic organs in septic shock. Crit
Care Med 2000, 28:3233-3241.
21. Banic A, Krejci V, Erni D, Wheatley AM, Sigurdsson GH: Effects
of sodium nitroprusside and phenylephrine on blood flow in
free musculocutaneous flaps during general anesthesia.
Anesthesiology 1999, 90:147-155.
22. Hiltebrand LB, Krejci V, tenHoevel ME, Banic A, Sigurdsson GH:
Redistribution of microcirculatory blood flow within the intes-
tinal wall during sepsis and general anesthesia. Anesthesiol-
ogy 2003, 98:658-669.
23. Hiltebrand LB, Krejci V, Jakob SM, Takala J, Sigurdsson GH:
Effects of vasopressin on microcirculatory blood flow in the
gastrointestinal tract in anesthetized pigs in septic shock.
Anesthesiology 2007, 106:1156-1167.
24. Kimberger O, Arnberger M, Brandt S, Plock J, Sigurdsson GH,
Kurz A, Hiltebrand LB: Goal – directed colloid administration
improves the microcirculation of healthy and perianastomotic
colon. Anesthesiology 2009, 110:496-504.
25. Hiltebrand LB, Pestel G, Hager H, Ratnaraj J, Sigurdsson GH, Kurz
A: Perioperative fluid management: comparison of high,
medium and low fluid volume on tissue oxygen pressure in the
small bowel and colon. Eur J Anaesthesiol 2007, 24:927-933.
26. Chappell D, Jacob M, Hofmann-Kiefer K, Conzen P, Rehm M: A
rational approach to perioperative fluid management.
Anesthesiology 2008, 109:723-740.
27. Lang K, Boldt J, Suttner S, Haisch G: Colloids versus crystal-
loids and tissue oxygen tension in patients undergoing major
abdominal surgery. Anesth Analg 2001, 93:405-409.
28. Conway DH, Mayall R, Abdul-Latif MS, Gilligan S, Tackaberry C:
Randomised controlled trial investigating the influence of
intravenous fluid titration using oesophageal Doppler moni-
toring during bowel surgery. Anaesthesia 2002, 57:845-849.
29. Venn R, Steele A, Richardson P, Poloniecki J, Grounds M, New-
man P: Randomized controlled trial to investigate influence of
the fluid challenge on duration of hospital stay and periopera-
tive morbidity in patients with hip fractures. Br J Anaesth 2002,
88:65-71.
30. Price J, Sear J, Venn R: Perioperative fluid volume optimization
following proximal femoral fracture. Cochrane Database Syst
Rev 2002:CD003004.
31. Pearse R, Dawson D, Fawcett J, Rhodes A, Grounds RM, Bennett
ED: Changes in central venous saturation after major surgery,
and association with outcome. Crit Care 2005, 9:R694-699.
32. Krejci V, Hiltebrand L, Buchi C, Ali SZ, Contaldo C, Takala J, Sig-
urdsson GH, Jakob SM:
Decreasing gut wall glucose as an early
marker of impaired intestinal perfusion. Crit Care Med 2006,
34:2406-2414.
33. Krejci V, Hiltebrand L, Banic A, Erni D, Wheatley AM, Sigurdsson
GH: Continuous measurements of microcirculatory blood flow
in gastrointestinal organs during acute haemorrhage. Br J
Anaesth 2000, 84:468-475.
34. Hannon JP, Bossone CA, Wade CE: Normal physiological val-
ues for conscious pigs used in biomedical research. Lab Anim
Sci 1990, 40:293-298.
35. Lowell JA, Schifferdecker C, Driscoll DF, Benotti PN, Bistrian BR:
Postoperative fluid overload: not a benign problem. Crit Care
Med 1990, 18:728-733.