Báo cáo y học: " Site-specific dose-response relationships for cancer induction from the combined Japanese A-bomb and Hodgkin cohorts for doses relevant to radiotherapy" ppsx
Bạn đang xem bản rút gọn của tài liệu. Xem và tải ngay bản đầy đủ của tài liệu tại đây (836.32 KB, 21 trang )
RESEARCH Open Access
Site-specific dose-response relationships for
cancer induction from the combined Japanese
A-bomb and Hodgkin cohorts for doses
relevant to radiotherapy
Uwe Schneider
1,2*
, Marcin Sumila
1
and Judith Robotka
1
* Correspondence:
1
Radiotherapy Hirslanden AG,
Institute for Radiotherapy, Rain 34,
5001 Aarau, Switzerland
Full list of author information is
available at the end of the article
Abstract
Background and Purpose: Most information on the dose-response of radiation-
induced cancer is derived from data on the A-bomb survivors. Since, for radiation
protection purposes, the dose span of main interest is between zero and one Gy, the
analysis of the A-bomb survivors is usually focused on this range. However, estimates
of cancer risk for doses larger than one Gy are becoming more important for
radiotherapy patients. Therefore in this work, emphasis is placed on doses relevant
for radiotherapy with respect to radiation induced solid can cer.
Materials and methods: For various organs and tissues the analysis of cancer
induction was extended by an attempted combination of the linear-no-threshold
model from the A-bomb survivors in the low dose range and the cancer risk data of
patients receiving radiotherapy for Hodg kin’s disease in the high dose range. The
data were fitted using organ equivalent dose (OED) calculated for a group of
different dose-response models including a linear model, a model including
fractionation, a bell-shaped model and a plateau-dose-response relationship.
Results: The quality of the applied fits shows that the linear model fits best colon,
cervix and skin. All other organs are best fitted by the model including fractionation
indicating that the repopulation/repair ability of tissue is neither 0 nor 100% but
somewhere in between. Bone and soft tissue sarcoma were fitted well by all the
models. In the low dose range beyond 1 Gy sarcoma risk is negligible. For increasing
dose, sarcoma risk increases rapidly and reaches a plateau at around 30 Gy.
Conclusions: In this work OED for various organs was calculated for a linear , a bell-
shaped, a plateau and a mixture between a bell-shaped and plateau dose-response
relationship for typical treatment plans of Hodgkin’s disease patients. The model
parameters (a and R) were obtained by a fit of the dose-response relationships to
these OED data and to the A-bomb survivors. For any three-dimensional
inhomogenous dose distribution, cancer risk can be compared by computing OED
using the coefficients obtained in this work.
Schneider et al. Theoretical Biology and Medical Modelling 2011, 8:27
/>© 2011 Schneider et al; licensee BioMed Central Ltd. This is an Open Access article distributed under the terms of the Creative
Commons Attribution License (http ://creativecommons. org/licenses/by/2.0), which permits unrestricted use, distribut ion, and
reproduction in any medium, provided the original work is properly cited.
Introduction
The dose-response relationship for radiation carcinogenesis up to one or two Gy has
been quantified in several major analyses of the atomic bomb survivors data. Recent
papers have been published , for example, by Preston et al. [1,2] and Walsh et al. [3,4].
This dose range is important for radiati on protection purposes where low doses are of
particular interest. However, it is also important to know the shape of the dose-
response curve for radiation induced cancer for doses larger than one Gy. In patients
who receiv e radiotherapy, parts of the patient volume can receive high dose s and it is
therefore of great importance to know the risk for the patient to develop a cancer
which could have been caused by the radiation treatment.
There is currently much debate concerning the sha pe of the dose-response curve for
radiation-induced cancer [5-17]. It is not known whether cancer risk as a function of
dose continues to be linear or decreases at high dose due to cell killing or levels off
due to, for example, a balance between cell killing and repopulation effects. The work
presented here, aims to clarify the dose-response shape for the radiotherapy dose
range. In this dose range, the linear-no-threshold model (LNT) derived from the
atomic bomb surv ivors from Hiroshima and Nagasaki ca n be combined with cancer
risk data available from about 30,000 patients with Hodgkin’s disease who were irra-
diated with localized doses of up to around 40 Gy.
The usual method for obtaining empirical dose-response relationships for radiation
associated cancer is to perform a case control study. For each patient with a second
cancer the location of, and the point dose at the malignancy can be de termined. If the
dose is obtained also for a number of controls the dose-response relationship for radia-
tion induced cancer can be obtained. The advantage of this method is a direct determi-
nation of risk as a function of point dose, the major disadvantage are the large errors
involved when det ermining the location and dose to the origin of the tum or. In this
work another method was used by assuming certain shapes of dose-response curves
based on model assumptions. The free model parameters for each organ are adjusted
in two steps. First, the models have to reprod uce in the limit of low dose the risk coef-
ficients of the A-bomb survivors. Second, by applying the models to typical dose-
volume histograms of treated patients they have to predict the co rresponding observed
second cancer ris k which was obtained from epidemiological studies. An advantage of
this method is that no point dose estimates at the tumor origin are necessar y; a disad-
vantage is that the obtained dose-response curve is dependent on the a priori model.
The aim of this paper is to attempt a combination of the LNT model derived from
the atomic bomb survivors and cancer risk data from a Hodgkin cohort treated with
radiotherapy, in order to determine possible d ose-response relationships for radiation
associated site specific solid cancers for radi otherapy doses. This work is an extension
of recently published results on possible dose-response relationships for radiation
induced solid cancers for all organs combined [11,14,18]. The main difference to pre-
vious work is the use of a more realistic dose-response relationship including fractiona-
tion effects which is more suitable for radiotherapy applications. Many problems and
uncertaint ies are involved in combing these two data-sets. However, since very little is
currently known about the shape of dose-response relationships for radiation-induced
cancer in the radiotherapy dose ran ge, this approach could be regarded as an attempt
to acquire more information in this area.
Schneider et al. Theoretical Biology and Medical Modelling 2011, 8:27
/>Page 2 of 21
Materials and methods
Cancer risk from the Atomic bomb survivor data
Theexcessabsoluteriskinasmallvolumeelementofanorgan(EAR ) is factorized
into a function of dose RED(D) and a modifying function that depends on the variables
age at exposure (agex) and age attained (agea):
EAR
D, agex, agea
= β RED
(
D
)
μ
agex, agea
,
(1)
where RED (risk equivalent dose) is the dose-response relationship for radiation
induced cancer in units of dose and b is the initial slope, which is the slope of the
dose-response curve at low dose. The modifying function μ contains the population
dependent variables:
μ
agex, agea
= exp
γ
e
agex − 30
+ γ
a
ln
agea
7
0
(2)
In this form the fit parameters are gender-averaged and centered at an age at expo-
sure of 30 years and an attained age of 70 years. The initial slopes b
EAR
and the age
modifying parameters g
e
and g
a
for a Japanese population and for different sites are
taken from Preston et al. [1] and are listed in Table 1.
In this work it is intended to combine the Japanese A-bomb survivor data with sec-
ondary cancer data from of Hodgkin’s patients from a Western population. This raises
the issue of risk transfer between Japane se and Western populations. In this work we
transfer risk according to ICRP 103 [19] by establishing a weighting of ERR (excess
relativ e risk) and EAR that provides a r easonable basis for general izing across popula-
tions with different baselin e risks. For this purpose ERR:EAR weights of 0:100% were
Table 1 Initial slopes b (in brackets 95% confidence interval) of the A-bomb survivors
for age at exposure of 30 and attained age of 70 years and age modifying parameters
g
e
and g
a
for different sites.
Site b
EAR
- Japan* b
EAR
- UK* g
e
g
a
All solid 52 (43 60) 74 (61 86) -0.024 2.38
Female breast 9.2 (6.8 12) 8.2 (6.1 11) -0.037 1.7
Lung 7.5 (5.1 10) 8.0 (5.5 11) 0.002 4.23
Rectum 0.56 (-0.13 1.4) 0.73 (-0.17 1.8) -0.024 2.38
Colon 8.0 (4.4 12) 7.4 (4.0 11.0) -0.056 6.9
Mouth and pharynx
◇
0.56 (0.2 1.2) 0.73 (0.3 1.6) -0.024
‡
2.38
‡
Esophagus 0.58 (0.18 1.1) 3.2 (1.0 6.1) -0.002+ 1.9+
Stomach 9.5 (6.1 14) 5.2 (3.4 7.7) -0.002 1.9
Small Intestine
†
8.0 (4.4 12) 10 (5.7 16) -0.056 6.9
Liver 4.3 (0.0 7.2) 2.4 (0.0 4.0) -0.021 3.6
Cervix 0.56 (0.0 1.9) 0.73 (0.0 2.5) -0.024
‡
2.38
‡
Bladder 3.2 (1.1 5.4) 3.8 (1.3 6.5) -0.024
‡
2.38
‡
Skin 0.35 (0.03 1.1) 0.46 (0.04 1.43) -0.61 4.36
Brain and CNS 0.51 (0.17 0.95) 0.70 (0.23 1.31) -0.024
‡
2.38
‡
Thyroid 1.2 (0.5 2.2) 0.40 (0.2 0.8) -0.046 0.6
Salivary Gland
◇
0.56 (0.2 1.2) 0.73 (0.26 1.6) -0.024
‡
2.38
‡
Bone - - -0.013
‡
-0.56
‡
Soft tissue - - -0.013
‡
-0.56
‡
The values for the Japanese population (b
EAR
- Japan) were taken from the analysis of Preston et al. [1]. Risk was
transferred to a Western population (b
EAR
-UK) by est ablishing a ERR-EAR weighting according to ICRP 103 [19].
*excess cases per 10’ 000 PY Gy, †initial slope from colon,
◇
initial slope from oral cavity, +age dependence from
stomach,
‡
age dependence from all solid
Schneider et al. Theoretical Biology and Medical Modelling 2011, 8:27
/>Page 3 of 21
assigned for breast, 100:0% for thyroid and skin, 30:70% for lung, and 50:50% for all
others [19]. The risk ratios ERR:EAR from [20] are listed in Table 2 for the Japanese
and UK population normalized to the initial slopes b
EAR
of a Japanese population. The
ratio of the ERR:EAR weighted initial slope for a UK population and a Japanese popu-
lation is given in the last column of Table 2. This ratio was used to transfer b
EAR
of
the Japanese population to a UK population listed in the second column of Table 1.
Application of cancer risk models to radiotherapy patients
A word of caution is necessary here. EAR as defined by Eq. 1 is the mathematically
modeled excess absolute risk in a small volume element of an organ or tissue and
must be distinguished from the usually used epidemiologically obtained excess abso-
lute risk for a whole organ EAR
org
. Although this notation might appear confusing
we followed this approach as it was previously used by other authors [16,17]. If the
dose-volume-histogram V(d) in an organ of interest is known, excess absolute risk in
that organ can be obtained with Eq. 1 by a convolution of the dose-volume histo-
gram with EA R:
EAR
org
=
1
V
T
i
V
(
D
i
)
β RED(D
i
)μ
agex, agea
,
(3)
where V
T
is the total organ volume and the sum is taken over all bins of the dose-
volume histogram V(D). For a completely ho mogenously irradiated organ with a dose
D
hom
excess absolute risk is simply EAR
org
= EAR(D
hom
).
Table 2 Transfer of risks between the Japanese and the UK population using
weighting between a generalized ERR and EAR model according to ICRP 103 [19]
and UNSCEAR [20].
Site b
ERR
/b
EAR
- Japan b
ERR
/b
EAR
-UK w
ERR
/w
EAR
b
weighted
- UK/b
EAR
- Japan
All solid 1.14/1.00 1.95/0.91 0.5/0.5 1.43
Female breast 1.04/1.00 2.88/0.89 0/1 0.89
Lung 1.46/1.00 1.56/0.87 0.3/0.7 1.07
Rectum
†
1.01/1.00 1.70/0.90 0.5/0.5 1.30
Colon 0.96/1.00 0.92/0.93 0.5/0.5 0.92
Mouth and pharynx
†
1.01/1.00 1.70/0.90 0.5/0.5 1.30
Esophagus 8.20/1.00 10.0/1.00 0.5/0.5 5.50
Stomach 0.69/1.00 0.13/0.97 0.5/0.5 0.55
Small Intestine
†
1.01/1.00 1.70/0.90 0.5/0.5 1.30
Liver 2.03/1.00 0.19/0.93 0.5/0.5 0.56
Cervix
†
1.01/1.00 1.70/0.90 0.5/0.5 1.30
Bladder 1 0.95/1.00 1.59/0.82 0.5/0.5 1.20
Bladder 2 0.95/1.00 1.59/0.82 0.5/0.5 1.20
Skin
†
1.01/1.00 1.70/0.90 1/0 1.30
Brain and CNS 0.94/1.00 1.76/1.00 0.5/0.5 1.38
Thyroid 0.45/1.00 0.35/0.98 1/0 0.35
Salivary Gland
†
1.01/1.00 1.70/0.90 0.5/0.5 1.30
Bone 39.0/1.00 48.0/1.00 0/1 1.00
Soft tissue
†
1.01/1.00 1.70/0.90 0.5/0.5 1.30
All values are normalized to EAR of the Japanese population. The weighting w between the model is taken from
ICRP103 [19].
†
transfer between populations and models taken from “all other solids” of UNSCEAR [20]
Schneider et al. Theoretical Biology and Medical Modelling 2011, 8:27
/>Page 4 of 21
If risk estimates are applied to radiotherapy patients it is usually of interest to know
the advantage of a treatment plan A relative to another treatment plan B with respect
to cancer induction in one organ and one patient (same gender, age at exposure and
age attained). It is therefore necessary to evaluate the risk ratio:
EAR
A
org
EAR
B
org
=
1
V
T
i
V
A
(
D
i
)
β RED(D
i
)μ
agex, agea
1
V
T
i
V
B
(
D
i
)
β RED(D
i
)μ
agex, agea
=
1
V
T
i
V
A
(
D
i
)
RED(D
i
)
1
V
T
i
V
B
(
D
i
)
RED(D
i
)
=
OED
A
OED
B
,
(4)
where we introduced organ equivalent dose (OED)[11]whichisadose-response
(RED) weighted dose variable averaged over the whole organ volume:
OED =
1
V
T
i
V
(
D
i
)
RED(D
i
),
(5)
It becomes instantly clear that risk ratios for different radiotherapy treatment plans
are equivalent to OED ra tios which can be simply determined on the basis of an organ
specific dose-response relationship (RED)anddosevolumehistogram(V(D)). OED
values are independent of the initial slope b and the modifying function μ and are thus
keeping the necessary variables and the corresponding uncertainties at a minimum.
It should be noted here that for highly inhomogeneous dose distributions, cancer risk
isproportionaltoaveragedoseonlyforalinear dose-response relationship. For any
other dose-response relationship, cancer risk is proportional to OED.
Dose-response models for carcinoma induction
Several different dose-response relationships for carcinoma induction are considered
here. The first is a linear response over the whole dose range:
RED
(
D
)
=
D
(6)
The second is a recently developed mechanistic model which accounts for cell killing
and fractionation effects and is for carcinoma induction of the form [21]:
RED
(
D
)
=
e
−α
D
α
R
⎛
⎜
⎝
1 − 2R + R
2
e
α
D
−
(
1 − R
)
2
e
−
α
R
1 − R
D
⎞
⎟
⎠
,
(7)
where it assumed that the tissue is irradiated with a fractionated treatment schedule
of equal dose fractions d up to a dose D. The number of cells is reduced by cell killing
which is proportional to a’ and is defined using the linear quadratic model
α
= α + βd = α + β
D
D
T
d
T
,
(8)
where D
T
and d
T
is the prescribed dose to the target volume with the corresponding
fractiona tion dose, respectively. For analyzing the Hodgkin data from Dores et al. [22]
we used for D
T
=40Gyandford
T
= 2 Gy. The repopulation/repair parameter
Schneider et al. Theoretical Biology and Medical Modelling 2011, 8:27
/>Page 5 of 21
R characterizes the repopulation/repair-ability of the tissue between two dose fractions
and is 0 if no and 1 if full repopulation/repair occurs. It is assumed here an a/b =3
Gy for all tissues, since analysis of breast cancer data has shown that the dose-response
model is robust with variations in a/b [23].
Since a dose-response model as described by Eq. 7 is based on various assumptions
and thus related to uncertainties it was decided to includ e two limiting cases. The first
one, commonly named bell-shaped dose-response curve, is defined by completely
neg lecting any repopulation/repair effect and thus fractionation and is derived by tak-
ing Eq. 7 in the limit of R=0:
RED
(
D
)
= D exp
−α
D
(9)
Although the case R=0represents an acute dose exposure, repopulation/repair
effects are certainly important. However, any repopulated cell is not irradiated (as long
as the time scale of irradiation is small) and thus, in the context of carcinogenesis,
repopulation/repair effects are in this case irrelevant.
The second limiting case is a dose-response relationship in case of full repop ulation/
repair, and is derived by taking Eq. 7 in the limit of R=1:
RED
(
D
)
=
1 − exp
−α
D
α
(10)
Organ equivalent dose for the dose-response curves defined by Eqs. 6,7,9 and 10
become in the limit of small dose:
lim
D→0
OED =
1
V
T
i
V
i
RED
(
D
i
)
=
1
V
i
V
i
D
i
= D
(11)
Hence OED is, in the case of a homogenous distribution of small dose, average
absorbed organ dose D;
-
. Thus in the limit of small dose all proposed dose-response
relationships approach the LNT model and the initial slope b can be obtained from
the most recent data for solid cancer incidence. Here the data for a follow-up period
from 1958 to 1998 was used from a publication of Preston et al. [1].
Dose-response models for sarcoma induction
The excess risk of sarcomas observed from the study of the A-bomb survivors [1] is an
order of magnitude smaller than for carcinomas. Data from radiotherapy patients indi-
cate however that sarcoma induction at high dose is at a comparable magnitude than
carcinoma induction. Therefore it is not a ppropriate to assume a pure linear dose-
response relationship for sarcoma induction. A recently developed sarcoma induction
model was used which accounts for cell killing and fractionation effects and is based
on the assumption that stem cells remain quiescent until externa l stimuli like ionizi ng
radiation trigger re-entry into the cell cycle. The corresponding mechanistic model
which accounts also for cell killing and fractionation effects is of the form [21]:
RED
(
D
)
=
e
−α
D
α
R
⎛
⎜
⎝
1 − 2R + R
2
e
α
D
−
(
1 − R
)
2
e
−
α
R
1 − R
D
− α
RD
⎞
⎟
⎠
,
(12)
Schneider et al. Theoretical Biology and Medical Modelling 2011, 8:27
/>Page 6 of 21
where is assumed that the tissue is irradiated with a fra ctionated treatment schedule
of equal dose fractions d up to a dose D and the parameters have the same meaning
than in Eq. 7. Since a dose-response model as d escribed by Eq. 12 is based on various
assumptio ns and thus related to uncertainties it was decided, similar to the carcinoma
case, to study three cases. The first one is defined by looking at minimal repopulation/
repair effects by using Eq. 12 with a fixed R=0.1. The second one is defined by look-
ing at intermedi ate repopulation/repair effects by using Eq. 12 with a fixed R=0.5.
The third case is a dose-response relationship in case of full repopulation/repair, and is
derived by taking Eq. 12 in the limit of R=1:
RED
(
D
)
=
exp
−α
D
α
−1 − α
D + exp
α
D
.
(13)
Organ equivalent dose for the dose-response curves for sarcoma induction defined
by Eqs. 12 and 13 become, in the limit of small dose:
lim
D→0
OED =
1
V
T
i
V
i
RED
(
D
i
)
=
α
2
R
6
(
1 − R
)
D
3
(14)
Sarcoma risk from a homogenous distribution of small dose is proportional to the
cube of dose and thus results in a much lower cancer risk than expected from a linear
model. This is consistent with the observations of the A-bomb survivors.
Modeling of the Hodgkin’s patients
Cancer risk is only proportional to average organ dose as long as the dose-response
curve is linear. At high dose it could be that the dose-response relationship is non-lin-
ear and as a consequence, OED replaces average dose to quantify radiation induced
cancer. In order to calculate OED in radiotherapy patients, informatio n on the three-
dimensional dose distribution is necessary. This information is usually not provided in
epidemiological studies on second cancers after radiotherapy. However, in Hodgkin’s
patients the three-dimensional dose distribution can be reconstructed.
For this purpose data on secondary cancer incidence rates in various organs for
Hodgkin’s patients treated with radiation were included in this analysis. Data on Hodg-
kin’ s patients treated with radiation seem to be ideal for an attempted combination
with the A-bomb data. These patients were treated at a relatively young age, with cura-
tive intent and hence secondary cancer incidence rates for various organ s are know n
with a good degree of precision. Since the treatment of Hodgkin’sdiseasewithradio-
therapy has been highly successful in the past, the treatment techniques have not been
modified very much over the last 30 years. This can be verified, for example, by a com-
parison of the treatment planning techniques used from 1960 to 1970 [24] with those
used from 1980 until 1990 [25]. Additionally, the therapy protocols do not differ very
much between the institutions that apply this form of treatment. These factors make it
possible to reconstruct a statistically averaged OED for each dose-response model RED
(D), which is characteristic for a large patient collective of Hodgkin’s disease patients.
The overall risk of selected second malignancies of 32,591 Hodgkin’spatientsafter
radiotherapy has been quantified by Dores et al. [22]. They found, for all solid cancers
after the application of radiotherapy as the only treatment, an excess absolute risk of
33.1 per 10,000 patients per year. The site-specific excess risks are listed i n Table 3.
Schneider et al. Theoretical Biology and Medical Modelling 2011, 8:27
/>Page 7 of 21
The total number of person years in these studies was 92,039 with a mean patient age
at diagnosis of 37 y ears. The mean follow-up time of the Hodgkin’spatientswas8
years. The me an age at diagnosis (agex = 37) and the mean attained age (agea =45)
was then used with the tempo ral patterns of the atomic bomb data (Eq. 2) to obtain
the site specific risks at agex =30andagea = 70 years for the Dores data (Table 3).
For bladder cancer the temporal pattern could be determined only with a large error
which results in a variation of the corresponding EAR
org
by more than one order of
magnitude. Therefore it was deci ded to apply for bladder cancer the temporal pattern
for all solid cancers.
Typical treatment techniques for Hodgkin’s disease radiotherapy were reconstructed
in an Alderson Rando Phantom with a 200 ml breast attac hment. Treatment planning
was performed on the basis of the review by Hoppe [25] and the German Hodgkin dis-
ease study protocol s . We used for treatment planning the Eclipse
External Beam Planning system version 8.6 (Varian Oncology Systems, Palo Alto, CA)
using the AAA-algorithm (versi on 8.6.14) with corrected dose distributions for head-,
phantom- and collimator-scatter. Three different treatment plans were computed
which included a mantle field, an inverted-Y field and a p ara-aortic field. All plans
were calculated with 6 MV photons and consisted of two oppo sed fields. The techni-
que for shaping large fields included divergent lead blocks. Treatment was performed
at a distance of 100 cm (SSD). Anterior-posterior (ap/pa) opposed field treatment tech-
niques were applied to insure dose homogeneity.
The dose-volume histograms of the organsandtissues(exclusiveofboneandsoft
tissue) which are listed in Table 1 were converted into OED according to the dose-
response relationships for carcinomas (Eqs. 6, 7, 9 and 10). A statistically a veraged
OED was t hen obtained by combining the OED from different plans with respect to
Table 3 Observed excess absolute risk of site-specific radiation induced cancer from the
study of Dores et al. [22].
Site EAR
org
agex = 37 and agea =45
EAR
org
agex = 30 and agea =70
All solid 33.1 112.1
Female breast 10.5 28.8
Lung 9.7 62.0
Rectum 0.40 1.53
Colon 2.0 62.4
Mouth and pharynx 2.7 9.1
Esophagus 0.7 1.6
Stomach 1.5 3.5
Small Intestine 0.1 3.1
Liver 0.4 2.3
Cervix 1.6 5.4
Bladder 0.8 2.7
Skin 0.9 9.5
Brain and CNS 0.5 1.7
Thyroid 1.4 2.5
Salivary Gland 0.5 1.7
Bone 0.3 0.3
Soft tissue 1.0 0.9
Patients were primarily treated for Hodgkin’s disease with radiotherapy. The data for agex = 30 and agea = 70 years
were converted using the temporal patterns of the atomic bomb data (Eq. 2) with the coefficients listed in Table 2.
Schneider et al. Theoretical Biology and Medical Modelling 2011, 8:27
/>Page 8 of 21
the statistical weight of the involvement of the individual lymph nodes [26]. The same
was executed with bone and soft tissue using the sarcoma dose-response relationships
from Eqs. 12 and 13. Here it is assumed that radiation causes in bone and soft tissue
exclusively sarcomas, in all other organs which are listed in Table 1 carcinomas.
Combined fit of A-bomb survivor and Hodgkin’s patients
Since the dose distribution in a Hodgkin’s patient is highly inhomogenous and the
dose-response relationships as described by Eqs. 7, 9, 10, 12 and 13 are non-linear, it is
not appropriate to apply a straight forward fit to t he data. An iterative fitting proce-
dure needs to be used instead. F or this purp ose, as described in the previous section,
the dose-volume histograms for the different organ s of interest were converted into
OED for given model parameters a and R. The initial slope b was taken from Table 1
for carcinoma induction and kept fix. For sarcoma dose-response curves the para-
meters b and a were varied and R was kept fix at 0.1, 0.5 and 1, respectively.
The fitted EAR values were compared to the original data. The a- and R-values, and
a-andb-values were fitted iteratively by minimizing c
2
for carcinoma and sarcoma
induction, respectively
χ
2
=
EAR
org
− β
UK
EAR
1
V
T
i
V
(
D
i
)
RED
(
D
i
, α, R
)
2
,
(15)
where the sum is taken over all bins of the dose volume histogram of the specific
organ. The coefficient of variation (CV) was calculated to estimate the quality of the
fit:
CV =
χ
2
EAR
org
(16)
A fit was accepted as significant good when CV < 0.05.
The linear model from Eq. 6 was optimized by allowing a variation of the initial
slope b in the 95% confidence interval of the A-bomb survivor data (Table 1).
The procedure described above was slightly varied to fit all solid cancers, since for all
solid cancers combined statistically significant A-bomb data up to approximately 5 Gy
are available. Thus the a- value for all solid cancers combined could be obtained using
the A-bomb data and was fixed at 0.089 [18].
Results
The results of the parameter fits are listed in Table 4 for carcinoma induction and in
Table 5 for sarcoma induction. Not all dose-response models could fit the data well
(CV > 0.05). This was indicated by “nc” in the tables. The Figures show the fitted dose
response models for the different organs and tissues. In Figures 1 (all solid), 2 (female
breast), 3 (lung), 4 (colon), 5 (mouth and pharynx), 6 (stomach), 7 (small intestine), 8
(liver), 9 (cervix), 10 (bladder), 11 (skin), 12 (brain and CNS) and 13 (salivary glands)
carcinoma induction is plotted using the linear model indicated by the black line, the
full model marked by the red line, the model neglecting fractionation and thus repopu-
lation with R=0(sometimes called a bell-shaped dose-response) labeled by the green
line and finally the model describing full repopulation between dose fractions with R=
1 (sometimes called a plateau dose-response) marked by the blue line. Figures 14
Schneider et al. Theoretical Biology and Medical Modelling 2011, 8:27
/>Page 9 of 21
(bone) and 15 (soft tissue) show sarcoma induction for the model with low repopula-
tion effects and R=0.1labeled by the green line, with intermediate repopulation
effects and R = 0.5 labeled by the red line and finally the model describing full repopu-
lation between dose fractions with R=1marked by the blue line.
All dose-response models are plotted for a age at diagnosis of 30 and an attained age
of 70 years, but they can easily converted to other ages by using the temporal patterns
described by Eq. 2 with the parameters listed in Table 1.
From the analysis excluded were Esophagus and Thyroid, since theses organs were
covered by a limited dose range of 30-55 Gy and 44-46 Gy, respectively.
Discussion
Figure 1 shows the dose-response models fitted to the whole body structure (the com-
plete Alderson phantom). The initial slope b oftheA-bombsurvivordataisthatfor
all solid tumors. The linear model was not converging, all other models could be fitted.
Table 4 Results of the fits to the Hodgkin data for the different dose-response models
for carcinoma induction.
Site Linear
(Eq.6)
Full model
(Eq.7)
No fractionation (bell
shape) R = 0
(Eq.9)
Full tissue recovery
(plateau) R = 1
(Eq.10)
b
†
CV a*RCV a*CVa* CV
All solid nc 0.089 0.17 6.4E-3 0.065 4.8E-3 0.317 8.7E-4
Female breast nc 0.044 0.15 1.1E-5 0.041 8.6E-4 0.115 1.9E-3
Lung nc 0.042 0.83 2.0E-5 0.022 1.2E-2 0.056 1.7E-3
Rectum nc nc 8.7E-1 nc 8.7E-1 nc 8.7E-1
Colon 7.2 1.8E-4 0.001 0.99 7.1E-3 0.001 2.5E-2 0.001 2.0E-4
Mouth and pharynx nc 0.043 0.97 3.8E-4 0.017 2.0E-3 0.045 6.6E-3
Esophagus excluded
Stomach nc 0.460 0.46 8.4E-6 0.111 4.7E-3 nc 1.4E0
Small Intestine nc 0.591 0.09 3.0E-5 0.480 2.9E-5 nc 3.2E0
Liver 0.22 3.4E-3 0.323 0.29 2.6E-5 0.243 3.4E-5 0.798 4.5E-2
Cervix 1.9 5.4E-4 nc 6.2E-1 nc 6.2E-1 nc 6.2E-1
Bladder nc 0.219 0.06 1.9E-5 0.213 4.1E-4 0.633 1.0E-4
Skin 1.1 2.5E-3 nc 5.8E-1 nc 5.9E-1 nc 5.8E-1
Brain and CNS 0.44 9.8E-3 0.018 0.93 1.3E-4 0.009 4.8E-3 0.021 4.2E-3
Thyroid excluded
Salivary Gland nc 0.087 0.23 3.4E-5 0.059 4.0E-3 0.282 2.2E-4
The fitted variables b, a and R are listed for each organ and each model. In addition the coefficient of variation (CV) is
given. A fit corresponding to a CV > 0.05 was denoted as not converging (nc).
*inGy
-1
†
in (10,000 PY Gy)
-1
Table 5 Results of the fit to the Hodgkin data for the different dose-response models
for sarcoma induction.
Site Low repopulation R = 0.1
(Eq.10)
Intermediate repopulation R = 0.5
(Eq.10)
Full tissue recovery R = 1
(Eq.11)
b
†
a* CV b
†
a* CV b
†
a* CV
Bone 1.70 0.019 2.1E-4 0.20 0.067 1.1E-3 0.10 0.078 4.3E-3
Soft tissue 3.30 0.040 1.9E-6 0.60 0.060 1.7E-4 0.35 0.093 5.8E-4
The fitted variables b and a are listed for each organ and for three different values for R (0.1, 0.5 and 1.0). In addition
the coefficient of variation (CV) is given.
*inGy
-1
†
in (10,000 PY Gy)
-1
Schneider et al. Theoretical Biology and Medical Modelling 2011, 8:27
/>Page 10 of 21
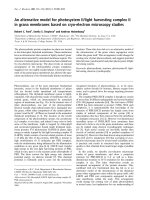
Figure 1 Plot of excess absolute carcinoma risk for all solid cancers per 10,000 persons per year as
a function of point dose in the organ. The bell-shaped, plateau and full dose-response relationships are
depicted by the green, blue and red line, respectively. The fits are presented for age at exposure of 30
years and attained age of 70 years.
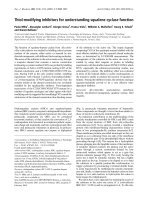
Figure 2 Plot of excess absolute carcinoma risk for female breast cancer per 10,000 persons per
year as a function of point dose in the organ. The bell-shaped, plateau and full dose-response
relationships are depicted by the green, blue and red line, respectively. The magenta curve represents the
results from a fits to case control studies [23]. The fits are presented for age at exposure of 30 years and
attained age of 70 years.
Schneider et al. Theoretical Biology and Medical Modelling 2011, 8:27
/>Page 11 of 21
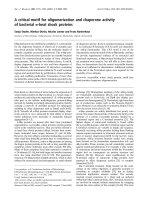
Figure 3 Plot of excess absolute carcinoma risk for lung cancer per 10,000 persons per year as a
function of point dose in the organ. The bell-shaped, plateau and full dose-response relationships are
depicted by the green, blue and red line, respectively. The magenta curve represents the results from a fits to
case control studies [27]. The fits are presented for age at exposure of 30 years and attained age of 70 years.
Figure 4 Plot of excess absolute carcinoma risk for colon cancer per 10,000 persons per year as a
function of point dose in the organ. The linear, bell-shaped, plateau and full dose-response relationships
are depicted by the black, green, blue and red line, respectively. The fits are presented for age at exposure
of 30 years and attained age of 70 years.
Schneider et al. Theoretical Biology and Medical Modelling 2011, 8:27
/>Page 12 of 21
Figure 5 Plot of excess absolute carcinoma risk for cancers of the mouth and pharynx per 10,000
persons per year as a function of point dose in the organ. The bell-shaped, plateau and full dose-
response relationships are depicted by the green, blue and red line, respectively. The fits are presented for
age at exposure of 30 years and attained age of 70 years.
Figure 6 Plot of excess absolute carcinoma risk for stomach cancer per 10,000 persons per year as
a function of point dose in the organ. The bell-shaped and full dose-response relationships are depicted
by the green and red line, respectively. The fits are presented for age at exposure of 30 years and attained
age of 70 years.
Schneider et al. Theoretical Biology and Medical Modelling 2011, 8:27
/>Page 13 of 21
Figure 7 Plot of excess absolute carcinoma risk for cancer of the small intestine per 10,000 persons
per year as a function of point dose in the organ. The bell-shaped and full dose-response relationships
are depicted by the green and red line, respectively. The fits are presented for age at exposure of 30 years
and attained age of 70 years.
Figure 8 Plot of excess absolute carcinoma risk for liver cancer per 10,000 persons per year as a
function of point dose in the organ. The linear, bell-shaped, plateau and full dose-response relationships
are depicted by the black, green, blue and red line, respectively. The fits are presented for age at exposure
of 30 years and attained age of 70 years.
Schneider et al. Theoretical Biology and Medical Modelling 2011, 8:27
/>Page 14 of 21
Figure 9 Plot of excess absolute carcinoma risk for cervix cancer per 10,000 persons per year as a
function of point dose in the organ. The linear dose-response relationship is depicted by the black line.
The fit is presented for age at exposure of 30 years and attained age of 70 years.
Figure 10 Plot of excess absolute carcinoma risk for bladder cancer per 10,000 persons per year as
a function of point dose in the organ. The bell-shaped, plateau and full dose-response relationships are
depicted by the green, blue and red line, respectively. The fits are presented for age at exposure of 30
years and attained age of 70 years.
Schneider et al. Theoretical Biology and Medical Modelling 2011, 8:27
/>Page 15 of 21
Figure 11 Plot of excess absolute carcinoma risk for skin cancer per 10,000 persons per year as a
function of point dose in the organ. The linear dose-response relationship is depicted by the black line.
The fit is presented for age at exposure of 30 years and attained age of 70 years.
Figure 12 Plot of excess absolute carcinoma risk for cancer of the brain and CNS per 10,000
persons per year as a function of point dose in the organ. The linear, bell-shaped, plateau and full
dose-response relationships are depicted by the black, green, blue and red line, respectively. The fits are
presented for age at exposure of 30 years and attained age of 70 years.
Schneider et al. Theoretical Biology and Medical Modelling 2011, 8:27
/>Page 16 of 21
Figure 13 Plot of excess absolute carcinoma risk for cancer of the salivary glands per 10,000
persons per year as a function of point dose in the organ. The bell-shaped, plateau and full dose-
response relationships are depicted by the green, blue and red line, respectively. The fits are presented for
age at exposure of 30 years and attained age of 70 years.
Figure 14 Plot of excess absolute risk for sarcoma incidence in bone per 10,000 persons per year as
a function of point dose in the organ. The dose-response relationships representing low, intermediate,
and full repopulation/repair are depicted by the green, red and blue line, respectively. The fits are
presented for age at exposure of 30 years and attained age of 70 years.
Schneider et al. Theoretical Biology and Medical Modelling 2011, 8:27
/>Page 17 of 21
There is strong variation for intermediate dose levels around 10 Gy. It should be noted
here that for inhomogenous dose distributionsadoseresponserelationshipforthe
whole body should be used with extreme care, as two completely different distributions
of dose in the organs could result in the same OED for the whole body. The dose-
response relationships for the whole body obtained in th is report should be therefore
used only for Hodgkin’s patients treated with mantle fields. In contrast the dose-
response relationships for single organs can be used generall y for an alyzing any dose
distribution.
The quality of the applied fit s shows that th e linear model fits best colon, cervix and
skin. All other organs are best fitted by the full model indicating that the repopulation/
repair ability of tissue is neither 0 nor 100% but somewhere in between. It seems that
for most organs at large doses the dose-resp onse relationship is flattening or
decreasing.
It should be noted that Mouth and Pharynx was covered by a limited dose range
from 16-45 Gy. Thus the resulting dose-response relationship for dose levels outside
thatrangeshouldbeusedwithcare.Forrectumnoneofthedoseresponsemodels
could predict the Hodgkin data. The linear model fitte d colon, liver, cervix, skin and
Brain/CNS. The model with full repopulation/repair did not fit rectum, cervix and
skin.
Bone and soft tissue sarcoma were fitted by all the models well. In the low dose
range beyond 1 Gy sarcoma risk is negligible. For increasing dose sarcoma risk
increases rapidly and reaches a plateau at around 30 Gy. This is in agreement with
Figure 15 Plot of excess absolute risk for sarcoma incidence in soft tissue per 10,000 persons per
year as a function of point dose in the organ. The dose-response relationships representing low,
intermediate, and full repopulation/repair are depicted by the green, red and blue line, respectively. The fits
are presented for age at exposure of 30 years and attained age of 70 years.
Schneider et al. Theoretical Biology and Medical Modelling 2011, 8:27
/>Page 18 of 21
observations which demonstrate small sarcoma risk at low dose from the A-bomb sur-
vivors and significant sarcoma risk in the high dose regions of radiotherapy patients.
The results of this study can be compared to EAR-modeling based on case control
studies. In two recent publications excess absolute risk of breast and lung cancer was
fitted to the model including fractionation [23,27]. For breast cancer the obtained
model parameters where a = 0.067 Gy
-1
and R = 0.62 and for lung a = 0.061 Gy
-1
and
R = 0.84. The corresponding dose-response curves are plotted in Figures 2 and 3 as
the magenta lines for comparison with the results obtained in this study. If it is consid-
ered that the dose-response relationships were derived from two completely different
data sets with two different methods the agreement is satisfying.
The epidemiological data from the Ato mic-bomb survivors and the Hodgkin’ s
patients are associated with large errors as discussed below. Nevertheless some basic
conclusion can be tentatively drawn from the analysis presented here.
Increased risks of solid cancers after Hodgkin’s disease have been generally attributed
to radiotherapy. An important question is whether chemotherapy for Hodgkin’s disease
also adds to the solid cancer risk, an d if so, at which sites. If chemotherapy indeed
affects induction of solid tumors, one would e xpect that patients receiving combined
modalit y treatment would have a greater relative risk than pati ents treated solely with
radiotherapy. In several studies, no increased risk of solid cancers overall was observed
after the application of chemotherapy alone. Dores et al. [22] calculated both the risk
after radiotherapy alone and the solid cancer risk after combined modality therapy and
found an excess absolute risk of 39 and 43 per 10,000 patients per year, respectively.
As a c onsequence, the difference in risk betw een combined modality treatment a nd
radiotherapy alone (4 per 10,000 patients per year) can be tentatively attributed to
either chemotherapy or a genetic susceptibility of the Hodgkin patient population with
regard to cancer or both. The risk difference accounts approximately for 10% of all
solid cancers and can be regarded as not substantial when compared to other errors
involved for risk estimation and is also not statistically significant (see Table 1).
It is well known that genetic susceptibility underlies Hodgkin’s disease [28]. It is not
clear whether this genetic susceptibility would also affect the development of other
cancers. There is the possibility of a cancer diathesis, the prospect that, for some rea-
sons related to genetic makeup, a person who developed one cancer has an inherently
incr eased risk of developing another. However, such cancer susceptibility would result
in a minimal excess cancer incidence compared to the incidence of radiation related
tumors, since such an excess cancer incidence of solid tumors should also be seen in
Hodgkin’s patients after treatment with chemotherapy alone. However, there is no sta-
tistically significant increase for all solid tumors combined. Therefore, such an effect
will be hidden in the 95% confidence interval of the observed cancer incidence after
chemotherapy.
In this work EAR has been used to quantify radiation-induced cancer. EAR is used
here, since the risk calculations of the Hodgkin’s cohort are based on extremely inho-
mogenous dose distributions. It is assumed that the total absolute risk in an organ is
the volume weighted sum of the risks of the partial volumes which are irradiated
homogenously. Currently there is no available method for obtaining analogous organ
risks using ERR without modeling the underlying baseline risk. Shuryak et al. [16,17]
recently published a model including the description of typical background
Schneider et al. Theoretical Biology and Medical Modelling 2011, 8:27
/>Page 19 of 21
carcinogenesis in addition to radiation induced cancer. They could thus obtain a
microscopic ERR model. The advantage of their model in comparison to our approach
is that they could determine directly ERR the disadvantage is a larger number of adjus-
table parameters (three more parameters) which must be introduced to model b ack-
ground cancer risk.
The A-bomb survivor data used in this work were taken from a recent report from
Preston et al. [1]. Preston determined the initial slope of the dose-response relationship
by using an RBE of 10 for the neutrons. Recent research by Sasaki et al. however indi-
cated that the neutron RBE might by larger and varying with dose [29]. It could be
important to determine site specific cancer induction also for a dose varying RBE simi-
lar to the work which was done for all solid cancers combined [18].
Conclusions
A comparison of dose distributions in humans, for example in radiothera py treatment
planning, with regard to cancer incidence or mortality can be performed by computing
OED, which can be based on any dose-response relationship. In this work OED for var-
ious organs was calculated for a linear, a bell-shaped, a plateau and a mixture between
a bell-shaped and plateau dose-response relationship for typical treatment plans o f
Hodgkin’s disease patients. The model parameters (a and R) were obtained by a fit of
the dose-response relationships to these OED data and to the A-bomb survivors. For
any three-dimensional inhomogenous dose distribution, cancer risk can be compared
by computing OED using the coefficients obtained in this work.
For absolute risk estimates, EAR
org
can be determined by taking additionally the
initial slope b from Table 1 and multiplyi ng it with the population-dependent modify-
ing function using the coefficients of Table 1. However, absolute risk estimates must
be viewed with care, since the errors involved are large.
Acknowledgements
This study was supported in part financially by the European Commission with ALLEGRO grant No. 231965.
Author details
1
Radiotherapy Hirslanden AG, Institute for Radiotherapy, Rain 34, 5001 Aarau, Switzerland.
2
Vetsuisse Facutly, University
of Zürich, Winterthurerstrasse 260, 8057 Zürich, Switzerland.
Authors’ contributions
US designed this study, performed the modeling, and drafted the manuscript. MS and JR performed the treatment
planning and the dose reconstruction for the risk predictions. All authors read and approved the final manuscript.
Competing interests
The authors state that there is no conflict of interest for the authors or the author’s institution and that they have no
financial or personal relationships that inappropriately influence their actions. They have no dual commitments,
competing interests, competing loyalties, employment, consultancies, stock ownership, honoraria, or paid expert
testimony.
Received: 13 April 2011 Accepted: 26 July 2011 Published: 26 July 2011
References
1. Preston DL, Ron E, Tokuoka S, Funamoto S, Nishi N, Soda M, Mabuchi K, Kodama K: Solid cancer incidence in atomic
bomb survivors: 1958-1998. Radiat Res 2007, 168(1):1-64.
2. Preston DL, Pierce DA, Shimizu Y, Cullings HM, Fujita S, Funamoto S, Kodama K: Effects of recent changes in Atomic
bomb survivor dosimetry on cancer mortality risk estimated. Radiat Res 2004, 162:377-389.
3. Walsh L, Rühm W, Kellerer AM: Cancer risk estimates for X-rays with regard to organ specific doses, part I: All solid
cancers combined. Radiat Environ Biophys 2004, 43:145-151.
4. Walsh L, Rühm W, Kellerer AM: Cancer risk estimates for γ-rays with regard to organ specific doses, part II: Site
specific solid cancers. Radiat Environ Biophys 2004, 43:225-231.
Schneider et al. Theoretical Biology and Medical Modelling 2011, 8:27
/>Page 20 of 21
5. Lindsay KA, Wheldon EG, Deehan C, Wheldon TE: Radiation carcinogenesis modelling for risk of treatment-related
second tumours following radiotherapy. Br J Radiol 2001, 74(882):529-36.
6. Hall EJ, Wuu CS: Radiation-induced second cancers: the impact of 3D-CRT and IMRT. Int J Radiat Oncol Biol Phys
2003, 56(1):83-8.
7. Davis RH: Production and killing of second cancer precursor cells in radiation therapy: in regard to Hall and Wuu
(Int J Radiat Oncol Biol Phys 2003;56:83-88). Int J Radiat Oncol Biol Phys 2004, 59(3):916, and author reply Int J Radiat
Oncol Biol Phys. 2005 Jan 1;61(1):312-3.
8. Schneider U, Besserer J, Mack A: Hypofractionated radiotherapy has the potential for second cancer reduction. Theor
Biol Med Model 2010, 7:4.
9. Dasu A, Toma-Dasu I: Dose-effect models for risk-relationship to cell survival parameters. Acta Oncol 2005,
44(8):829-35.
10. Dasu A, Toma-Dasu I, Olofsson J, Karlsson M: The use of risk estimation models for the induction of secondary
cancers following radiotherapy. Acta Oncol 2005, 44(4):339-47.
11. Schneider U, Zwahlen D, Ross D, Kaser-Hotz B: Estimation of radiation-induced cancer from three-dimensional dose
distributions: Concept of organ equivalent dose. Int J Radiat Oncol Biol Phys 2005, 61(5):1510-5.
12. Schneider U, Kaser-Hotz B: A simple dose-response relationship for modeling secondary cancer incidence after
radiotherapy. Z Med Phys 2005, 15(1):31-7.
13. Sachs RK, Brenner DJ: Solid tumor risks after high doses of ionizing radiation. Proc Natl Acad Sci USA 2005,
102(37):13040-5.
14. Schneider U, Kaser-Hotz B: Radiation risk estimates after radiotherapy: application of the organ equivalent dose
concept to plateau dose-response relationships. Radiat Environ Biophys 2005, 44(3):235-9.
15. Pfaffenberger A, Schneider U, Poppe B, Oelfke U: Phenomenological modelling of second cancer incidence for
radiation treatment planning. Z Med Phys 2009, 19(4):236-50.
16. Shuryak I, Hahnfeldt P, Hlatky L, Sachs RK, Brenner DJ: A new view of radiation-induced cancer: integrating short-
and long-term processes. Part I: approach. Radiat Environ Biophys 2009, 48(3):263-74.
17. Shuryak I, Hahnfeldt P, Hlatky L, Sachs RK, Brenner DJ: A new view of radiation-induced cancer: integrating short-
and long-term processes. Part II: second cancer risk estimation. Radiat Environ Biophys 2009, 48(3):275-86.
18. Schneider U, Walsh L: Cancer risk estimates from the combined Japanese A-bomb and Hodgkin cohorts for doses
relevant to radiotherapy. Radiat Environ Biophys 2008, 47(2):253-63.
19. The 2007 Recommendations of the International Commission on Radiological Protection. ICRP publication 103.
Ann ICRP 2007, 37(2-4)
:1-332.
20. UNSCEAR: United Nations Scientific Committee on the Effects of Atomic Radiation (2006) Effects of ionizing
radiation. UNSCEAR 2006 Report to the General Assembly, with Scientific Annex United Nations, New York.
21. Schneider U: Mechanistic model of radiation-induced cancer after fractionated radiotherapy using the linear-
quadratic formula. Med Phys 2009, 36(4):1138-43.
22. Dores GM, Metayer C, Curtis RE, Lynch CF, Clarke EA, Glimelius B, Storm H, Pukkala E, van Leeuwen FE, Holowaty EJ,
Andersson M, Wiklund T, Joensuu T, van’t Veer MB, Stovall M, Gospodarowicz M, Travis LB: Second malignant
neoplasms among long-term survivors of Hodgkin’s disease: a population-based evaluation over 25 years. J Clin
Oncol 2002, 20(16):3484-94.
23. Schneider U, Sumila M, Robotka J, Gruber G, Mack A, Besserer J: Dose-response relationship for breast cancer
induction at radiotherapy dose. Radiat Oncol 2011, 6(1):67.
24. Carmel RJ, Kaplan HS: Mantle irradiation in Hodgkin’s disease. An analysis of technique, tumor eradication, and
complications. Cancer 1976, 37(6):2813-25.
25. Hoppe RT: Radiation therapy in the management of Hodgkin’s disease. Semin Oncol 1990, , 6: 704-15.
26. Mauch PM, Kalish LA, Kadin M, Coleman CN, Osteen R, Hellman S: Patterns of presentation of Hodgkin disease.
Implications for etiology and pathogenesis. Cancer 1993, 71(6):2062-71.
27. Schneider U, Stipper A, Besserer J: Dose-response relationship for lung cancer induction at radiotherapy dose. Z Med
Phys 2010, 20(3):206-14.
28. Mack TM, Cozen W, Shibata DK, Weiss LM, Nathwani BN, Hernandez AM, Taylor CR, Hamilton AS, Deapen DM,
Rappaport EB: Concordance for Hodgkin’s disease in identical twins suggesting genetic susceptibility to the young-
adult form of the disease. N Engl J Med 1995, 332(7):413-8.
29. Sasaki MS, Nomura T, Ejima Y, Utsumi H, Endo S, Saito I, Itoh T, Hoshi M: Experimental derivation of relative biological
effectiveness of A-bomb neutrons in Hiroshima and Nagasaki and implications for risk assessment. Radiat Res 2008,
170(1):101-17.
doi:10.1186/1742-4682-8-27
Cite this article as: Schneider et al.: Site-specific dose-response relationships for cancer induction from the
combined Japanese A-bomb and Hodgkin cohorts for doses relevant to radiotherapy. Theoretical Biology and
Medical Modelling 2011 8:27.
Schneider et al. Theoretical Biology and Medical Modelling 2011, 8:27
/>Page 21 of 21