Báo cáo y học: " A network model for biofilm development in Escherichia coli K-12" ppsx
Bạn đang xem bản rút gọn của tài liệu. Xem và tải ngay bản đầy đủ của tài liệu tại đây (549.7 KB, 9 trang )
RESEARCH Open Access
A network model for biofilm development in
Escherichia coli K-12
Andrew A Shalá
1
, Silvia Restrepo
2
and Andrés F González Barrios
1*
* Correspondence:
1
Grupo de Diseño de Productos y
Procesos (GDPP), Departamento de
Ingeniería Química, Universidad de
los Andes. Carrera 1E No. 19ª14
Bogotá, Colombia
Full list of author information is
available at the end of the article
Abstract
Background: In nature, bacteria often exist as biofilms. Biofilms are communities of
microorganisms attached to a surface. It is clear that biofilm-grown cells harbor
properties remarkably distinct from planktonic cells. Biofilms frequently complicate
treatments of infections by protecting bacteria from the immune system, decreasing
antibiotic efficacy and dispersing planktonic cells to distant body sites. In this work,
we employed enhanced Boolean algebra to model biofilm formation.
Results: The network obtained describes biofilm formation successfully, assuming -
in accordance with the literature - that when the negative regulators (RscCD and
EnvZ/OmpR) are off, the positive regulator (FlhDC) is on. The network was modeled
under three different conditions through time with satisfactory outcomes. Each
cluster was constructed using the K-means/medians Clustering Support algorithm on
the basis of published Affymetrix microarray gene expression data from biofilm-
forming bacteria and the planktonic state over four time points for Escherichia coli K-
12.
Conclusions: The different phenotypes obtained demonstrate that the network
model of biofilm formation can simulate the formation or repression of biofilm
efficiently in E. coli K-12.
Background
In natural, medical or engineering environments, bacteria often exist as sessile commu-
nities called biofilms [1], which are e xquisite structures caused by a genetically pro-
grammed devel opmental process in which each stage entails dramatic modifications at
the genetic, biochemical, and phenotypic levels [2]. This phenotype enables bacteria to
adhere and anchor to surfaces in aqueous environments [3], so the cells acquire speci-
fic advantages when invading tissues, such as antiobiotic and shear stress resistance . It
is estimated that biofilms are involved in 65% of human bacterial infections [4], since
cell s in biofilms are 1000 times more resistant than cells in the planktonic state, mak-
ing medical treatments fail [1].
Many authors [5] have identified five steps in biofilm formation: (i) reversible attach-
ment, (ii) irreversible attachment, (iii) maturation-1, (iv) maturation-2, and finally (v)
dispersion [6]. Each step requires reprogramming of gene expression, and this repro-
gramming occurs in response to environmental changes [7,6]. The full development of
the biofilm includes the existence of a three-dimensional structure made of a polysac-
charide matrix that contains water channels for transporting nutrients and removing
Shalá et al. Theoretical Biology and Medical Modelling 2011, 8:34
/>© 2011 Shalá et al; licensee BioMed Central Ltd. This is an Open Access article distributed under the terms of the Creative Commons
Attribution License (http://creativecom mons.org/licenses/by/2.0), which permits unrestricted use , distribution, and reproduction in
any medium, provided the original work is properl y cited.
waste [5,7]. Different organelles play big roles during biofilm f ormation at d ifferent
stages on the bacterial surface, e.g. during reversible attachment flagella propel cells
toward the surface to overcome electrostatic interactions [6]. The irreversible attach-
ment process requires the cells to lose their flagella and develop adhesive organelles
such as curli or fimbria to attach to the surface [1]. Finally, the production of colanic
acid capsules allows the three -dimensional structures of the mature biofilm to be con-
struc ted [8]. For specific organelles to appear at each step in the proper order, expres-
sion of these organelles must be coordinated and thus regulated by a subset of
external signals, regulators and secondary messengers, e.g. flagellum biogenesis requires
the positive regulator FlhD/FlhC (Flh DC), environmental conditions such as approp ri-
ate temperature, osmolarity, and pH, the presence of acetate and the transcription fac-
tor HdfR, etc. [6]. Many types of genes with different functions seem to be involved in
biofilm formation [9].
Recently, there has been a dramatic upsurge of research on biofilms aimed at pre-
venting or controlling their formation or e radicating them [10], since they are often
deleterious and more complex to treat than planktonic forms owing to their high resis-
tance to antibiotics [2]. It is therefore important to understand the genetic basis of bio-
film formation in order to find effective ways to prevent it. Whole genome profiling for
each stage provides i nvaluable information about the underpinnings of the regulation
process [1,11,5,4]. Domka et al. [12] compared the gene expression in cells forming
biofilms and suspended (planktonic) cells over time in E. coli K-12.
The gene expression profile could be further interpreted to elucidate the gene regula-
tion network and variations in its topology over time. Once established, mathematical
models can be used to predict the system dynamics and understand it deeply. These
models are based on different approaches suc h as conservation mass balance and the
mass action law, and involve the use of o rdinary differential equations, or stochastic
kinetics in cases where it is no longer possible to apply mass action assumptions. How-
ever , these techniques demand extensive development if a unique solution is required,
and this kinetic background cannot easily be obtained [13]. For this reason, approaches
that do not demand so much information such as Boolean based network kinetics con-
stitute an ideal way of gaining a deeper understanding of the dynamics of gene net-
works, because this technique just requires the to pology of the network for different
time points [14-16].
The value of a Boolean logic network modeling resides in translating a continuous to
a discrete dynamic system [13]. However, this discretization is only possible when each
node resp onse can be described by binary variables [14], which is the general case for
gen e transcr iption regardless of the biological system. Boolean networks allow regula-
tory networks to be modeled and analyzed efficiently, making strong simplifying
assumptions about the structure and dynamics of a genetic regulato ry system [17]. In
this model each cluster (a group of genes) at a given time can display one or other of
two states, on or of f. The expression of a cluster A at time t + 1 is modeled by a Boo-
lean function, whose entries are the expression at time t of all K clusters related to
cluster A. Generally, K ≤ N where N is the total number of clusters obtained. After a
succession of times, the system traces its history in a space of states [14].
Domka et al. [12] compared the differential gene expression over time when E. coli
form biofilms, and gene expression between cells in suspension and biofilms. However,
Shalá et al. Theoretical Biology and Medical Modelling 2011, 8:34
/>Page 2 of 9
this study was limited to determining the proportion of genes induced and repressed
between 2.5 and 5 fold, without identifying the most important networks or pathways
for biofilm formation. Therefore, the aim of the present study is to build a network
model of biofilm formation in E. coli K -12, to identify clusters and regulators during
biofilm formation and to analyze the dynamics of each cluster to corroborate the
results previously obtained through whole genome profiling.
Results and disc ussion
Ten clusters for four time points were obtained with similarity levels greater than 82%.
We then identified relevant clusters regarding biofilm formation for E. coli (Table 1) to
calculate the weight matrix (Table 2). The connection between expre ssion (model) and
phenotype (biological conclusions) is based on the expression and presence of the posi-
tive regulators (clusters A and D).
Overall, we found no effect on the expression trend for the diff erent initial condi-
tions (Table 3) in Clusters E, G, H, I & J as they reached the active state, regardless of
the initial population (Figure 1). This result corrobo rated the importance of such clus-
ters for the whole biofilm formation process in basic cell functions such as replication,
transcription, translation and respiration.
We first observed the gene expression dynamics with non-zero initial conditions for
all clusters. Interestingly, the global positive regulator FlhDC cluster, capable of regu-
lating the expression of curli and flagella, was found to be re pressed after 0.4 s, possi-
bly indicating a negative effect from the FlhD repressors OmpR, RcsCD, hdfR and
LrhA. FlhD behavior was also propagated for the H-NS and QseBC positive regulator
clusters (Figure 1). Overall, these results suggest that the simultaneous presence of all
clusters does not allow biofilms to form owing to repression of key clusters at the
onset of the process (clusters A, D a nd F) [6,18-24]. Consistent with experimental
data, cluster F, which is quorum sensing-related, does not follow flagella and H-NS
regulator behavior because it is not strongly coupled with OmpR and RcsCD. Phenoty-
pically, these results suggest that quorum sensing requires the st rong action of the fla-
gella apparatus in order to play a role during activation; these results were previously
shown by González Barrios et al. [4].
In silico knockouts were also carried out in order to corroborate the phenotypes pre-
viously reported for critical genes during the different stages of t he biofilm formation
Table 1 Main features of each cluster in biofilm formation
Cluster Name Features of cluster
A FlhDc regulator and all flagella, curli and capsule genes
B EnvZ/OmpR regulator
C RcsBC regulator
D H-HS regulator, Fimbria gene (FimA), DnaAKJ and GrpE
E cold shock protein, Transfer RNA
F QseBC
G Basic genes for surviving i. e. NADH dehidrogenase, & hdfR
H Basic genes for surviving i. e. tryptophan genes, & LrhA
I 30-50S ribosomal subunits proteins
J 5S, 23S, 16S Operons
Some major genes and features for each cluster that takes part in biofilm formation. Each cluster was obtained from
cluster analysis of the microarray data of the whole E. coli K-12 genome.
Shalá et al. Theoretical Biology and Medical Modelling 2011, 8:34
/>Page 3 of 9
process. First, we wanted to evaluate the effect of deleting the EnvZ/Om pR regulator
(cluster B) in order t o establish a correspondence between this regulator and the mas-
ter flagella regulon and determine the potenti al formation of biofil m when the cluster
was knocked out. Overall, we again found no response for biofilm formation since the
presence of RcsCD, hdfR and LrhA, which are also reported to be negative regulators
in this context, possibly causing the absence of the expression of cluster A, the master
flagella regulon (FlhDC), the H-NS regulator (cluster D) and the quorum sensing sys-
tem (Cluster F). Regarding the initial conditions for this knockout, we noticed that
even though the system displays no positive response in silico when none is present
under the initial conditions, FlhDC almost reaches a positive value, possibly indicating
tha t the initial absence of cluster B could lead the cells to establi sh biofilm depend ing
on the time response; in other words, the lag time for RcsBC to reach the acti ve state
when cluster B is forced to remain shut down. This suggests synergism among the
three repressor systems in order to avoid the formation of the biofilm (Figure 2).
Moreover,wealsofoundthesameresultswhen cluster C (RcsBC) was deleted (data
not shown), corroborating this hypothesis of synergism.
Two additional knockouts were analyzed with the aim of identifying the expected
positive response from the system. First, we s hut down th e repressor c lusters EnvZ/
OmpR and RcsBC, as this has been previously reported to inhibit the flagella response.
In this case the master flagella regulon, FlhDC, demonstrated that the biofilm forma-
tion is activated and these responses are rapid when the stable state is reached (addi-
tional file 1). Also, the major role of the RcsCD and OmpR clusters in regulation was
corroborated [6] as these genes remained inactivated, in contrast to hdfR and LrhA.
Nevertheless,thefactthatA,B,C,DandFpresent a zero initial condition leads to
inactivation of H-NS and QseBC because there is insufficient of the activator FlhCD
and a negative phenotypical response (no biofilm formed). Therefore, the b iofilm
Table 2 Weight matrix for biofilm formation
Cluster number A B C D E F G H I J
A 1 -1 -1 1 0 1 -1 -1 0 0
B 0110000000
C 0110000000
D 1-1-10000 000
E 0000000011
F 1000000000
G 0010000011
H 0010000011
I 1111111101
J 1111111110
Correlations between clusters obtained from different literature that used microarray data for E. coli K-12. 0, 1 and -1
represent neutral, positive and negative interactions, respectively.
Table 3 Initial value for concentrations of gene products of the network
Conditions y
0
= 100mol y
0
=0mol Graphic Shape
I All Cluster -
II Clusters: A, D, F, E, G, H, I & J Clusters: B, C
Three set scenarios with different cluster initial concentration 100 or 0 [15]. Scenario I is set to observe the typical cell
behavior. Scenario II is set to show network’s response time to control biofilm formation. Scenario III is set to see if basic
cellular functions are for or against biofilm formation, since the clusters that take part in biofilm formation are off.
Shalá et al. Theoretical Biology and Medical Modelling 2011, 8:34
/>Page 4 of 9
regulation network demands positive action from the inductor clusters or genes
directly involved in the positive response such as FlhDC, and the cooperative interac-
tion of the negative regulators [6]. In order to corroborate this conclusion, we obtained
the profiles for the cases in which a virtual knockout in cluster A was made and clus-
ters A, B and C were knocked out, and in both cases no biofilm was formed (results
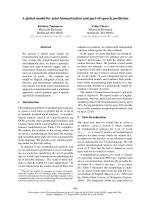
Figure 1 Profiles for th e ten clusters. Plots for the ten clusters (A-J) show the expression profile (y-axis)
vs. time (x-axis) for three scenarios: condition I (-), condition II ( ) and condition 3 ( ). Biofilm is not formed
under the null scenario because the biofilm positive regulators (clusters A and D) are repressed [expression
value (ev) = 0] for four negative regulators (clusters B, C, G and H) [ev = 700]. Quorum sensing (cluster F) is
at basal level [ev = 500].
Figure 2 Profiles for the ten clusters with virtual knockout in cluster B. Plots for the ten clusters (A-J)
show the expression profile (y-axis) vs. time (x-axis) for three scenarios: condition I (-), condition II ( ) and
condition 3 ( ). Biofilm is not formed under the null scenario because the biofilm positive regulators
(clusters A and D) are repressed [expression value (ev) = 0] for three negative regulators (clusters C, G and
H) [ev = 700]. However, under scenario II, the biofilm machinery is shown to be activated at 4000s.
Shalá et al. Theoretical Biology and Medical Modelling 2011, 8:34
/>Page 5 of 9
not shown). It is important to highlight that virtual knockout of hdfR and LrhA could
not be done because these are congregated in fundamental clusters.
Finally, we modeled the case when, in a community of cells that have already formed
a biofilm, a si gnal that activates the OmpR regulator and then RcsCD suddenly arrives
(results not shown). The profile displays a biofilm formed until 7000 s and then OmpR
begins to produce enough protein to inhibit biofilm formation, concomitantly with
RcdCD at 15000 s. Although OmpR starts at 7000 s, biofilm formation (cluster A, D
profiles) does not begin to disappear immediately but around 11500 s. This is because
OmpR expression is initially absent, and ge nes for surface organelles are not af fected
during the time necessary to raise their protein expression.
Conclusions
In this work we have built a network model of biofilm formation in E. coli K-12, using
cluster a nalysis and Boolean network kinetics, obtaining phenotypes already reported.
Throughout the modeling, we have used the most import ant regulators of biofilm for-
mation (FlhD, H-NS, QseBC, OmpR, RcsCD, hdfR and LrhA) under different initial
conditions, and obtained enough evidence to demonstrate that networks can efficiently
model a complex gene regulatory system such as the biofilm formation in E. coli K-12.
As in nature, the model simulated successful biofilm formation when the most signifi-
cant negative regulators (OmpR and RcsCD) are inactive, and when the positive global
regulator FlhDC is active.
Methods
Data
The Affymetrix Microarray data used were obtainedfromtheNCBIGeneExpression
Omnibus (GEO accession: GSE3905) [25,26]. These data were originally obtained by
Domka et al. [12]. The data included four time points: 4, 7, 15 and 24 h for cells pre-
senting a biofilm phenotype and for cells in the planktonic state. For this purpose, they
grew the two groups of cells in the same reactor in order to eliminate errors associated
with different environment conditions. Each set of data included the level of expression
of 7312 genes, and in total 8 sets of data were obtained [12].
Gene clustering
Whole genome profiling a llows cluster analysis to be carried out so the genes and clus-
ters that play important roles at each stage can be elucidated. Clustering of gene expres-
sion was perfor med using MultiExperiment Viewer v4.38 [27]. The K-means/medians
clustering support algorithm was used to make 10 clusters for each time poi nt with the
expression levels for biofilm and planktonic cells. The number of clusters was calculated
using the Figure of Merit encompassed in the software, and Euclidean distance was used
as the metric distance. The clustering process was restricted to eighty iterations and
twenty K-means/K-medians with a threshold percentage of occurrences in same cluster
of 0.8. We compared the level of similarity, confirming that most genes were clustered
with the same genes for all time points, in order to obtain ten merged clusters.
Model description
A network model is useful in applications where the information relevant to the pro-
blem to be solved is scant or incomplete, but where data are available. Dynamic
Shalá et al. Theoretical Biology and Medical Modelling 2011, 8:34
/>Page 6 of 9
modeling gives the relevant information about time responses that the ordinary Boo-
lean approximation cannot provide. We then employ an enhanced Boolean network i n
our model, which reduces the ne ed for large sets of data for network training and dis-
plays the dynami c evoluti on of the network. In the network model, the rate of expres-
sion of a gene i is given as [17]:
dy
i
dt
= k
1i
f
i
− k
2i
y
i
(1)
Where the first term quantifies the regulatory effect of other genes and the second
term describes the degradation. k
1i
and k
2i
are the rate constants. The decay rate con-
stant k
2i
can be expressed through the protein half-life t
1/2
as:
k
2
=
Ln2
t
1
/
2
(2)
The regulatory effect of gene f
i
, can be represented as follows:
f
i
=
1
1 + exp
−
n
j
w
ij
y
j
− τ
i
(3)
Where τ
i
is the bias (used as a delay parameter for the reaction), y
j
represents the
concentrations of gene products of the network, and w
ij
is the correlation coefficient
matrix, called the weight matrix. This matrix describes how various genes in the model
affect each other’s expression patterns over a period of time. A strong pos itive correla-
tion indicates that the genes may be co-expressed and have a value around one, and a
strong negative correlation indicates that the genes may inhibit each other’s expression
and have a value around negative one. Therefore the Boolean nature of this model is
conserved. Nevertheless, this approach constitutes an improved version as it involves
the dynamics of the process. The weight matrix was obtained from different microar-
rays aimed at studying gene regulation for the E. coli K-12 biofilm formation process
[2,4-7,12,28-33]. In order to keep track of the genes that play a maj or role according
to the liter ature , we first determined the interaction among them over time, localizing
them in different clusters . We only considered the most relevant genes because these
correlations are taken from literature and their functions are well known.
RNA mass balance allows the gene expression profile to be described in the follow-
ing manner:
dy
i
dt
=
k
1i
1 + exp
−
n
j
w
ij
y
j
− τ
i
−
Ln2
t
1
/
2
y
i
i, j =1, n
(4)
We solved the system of ordinary differential equations with the MATLAB
®
platform
using a fourth order Runge Kutta algorithm, with abso lute and rela tive tolerances o f
1.0e-006 and 1.0e-003, respectively. To reduce the dimensionality of the solution space
we assumed a single time delay τ
i
= τ for every regulatory interaction. Kinetic para-
meters were determined based on Gupta et al. [17] (τ = 1, t
1/2
=800s,andk
1i
=0.6
Shalá et al. Theoretical Biology and Medical Modelling 2011, 8:34
/>Page 7 of 9
mol/s). Simulations were performed using 2.64 GHz Intel Core 2 Duo Processor
T7500, 2 GB RAM. (Average time per analysis was 30 s).
Additional material
Additional file 1: Figure 1S - Profiles for the ten clusters with virtual knockout in clusters B and C. Plots for
the ten clusters (A-J) show the expression profile (y-axis) vs. time (x-axis) for three scenarios: condition I (-),
condition II ( ) and condition 3 ( ). Biofilm is formed under scenarios I and II because the biofilm positive
regulators (clusters A and D) are activated [expression value (ev) = 700] in the absence of two most important
negative regulators (clusters B and C) [ev = 500]. However, under scenario III, biofilm is not formed since the most
important positive regulators is off [ev = 0].
Acknowledgements
We thank Rishi Gupta for his assisting during the model construction.
Author details
1
Grupo de Diseño de Productos y Procesos (GDPP), Departamento de Ingeniería Química, Universidad de los Andes.
Carrera 1E No. 19ª14 Bogotá, Colombia.
2
Laboratorio de Micología y Fitopatología (LAMFU), Facultad de Ciencias
Biológicas, Universidad de los Andes, Universidad de los Andes. Carrera 1E No. 19ª14 Bogotá, Colombia.
Authors’ contributions
AAS carried out the gene clustering, performed the model and the statistical analysis, and drafted the manuscript. SRR
participated in the design of the study and helped to draft the manuscript. AFGB conceived of the study, and
participated in its design and coordination and drafted the manuscript. All authors read and approved the final
manuscript.
Competing interests
The authors declare that they have no competing interests.
Received: 27 October 2010 Accepted: 22 September 2011 Published: 22 September 2011
References
1. Schembri M, Kjærgaard K, Klemm P: Global Gene Expression in Escherichia coli Biofilms. Mol Microbiol 2003,
48(1):253-267.
2. Vidal O, Prigent-Combaret C, Dorel C, Lejeune P, Brobacher E, Amabert P, Landini A: Complex Regulatory Network
Controls Initial Adhesion and Biofilms Formation in Escherichia coli via Regulation of the csgD Gene. J Bacteriol
2001, 183(24):7213-7223.
3. Arce F, Carlson R, Monds J, Veeh R, Hu F, Stewart P, Lal R, Ehrlich G, Avci R: Tolerance of dormant and active cells in
Pseudomonas aeruginosa Haemophilus influenzae Biofilms. J Bacteriol 2009, 191(8):2512-2520.
4. Gonzalez A, Zuo R, Hashimoto Y, Yang L, Bentley W, Wood T: Autoinducer 2 Controls biofilms Formation in
Escherichia coli through a Novel Motility Quorum-Sensing Regulator (MqsR, B3022). J Bacteriol 2006, 188(1):305-316.
5. Ren D, Bedzyk L, Thomas S, Ye R, Wood T: Gene expression in Escherichia coli biofilms. Appl Microbiol Biotechnol 2004,
64:515-524.
6. Prüß B, Besemann C, Denton A, Wolfe A: A Complex Transcription Network Controls the Early Stages of biofilms
Development by Escherichia coli. J Bacteriol 2006, 188(11):3731-3739.
7. Vidal O, Longin R, Prigent-Combaret C, Dorel C, Hooreman O, Lejeune P: Isolation of an Escherichia coli K-12 Mutant
Strain Able To Form biofilms on Inert Surfaces: Involvement of a New ompR Allele That Increases Curli Expression.
J Bacteriol 1998, 180(9):2442-2449.
8. Danese P, Pratt L, Kolter R: Exopolysaccharide Production Is Required for Development of Escherichia coli K-12
Biofilms Architecture. J Bacteriol 2000, 182(12):3593-3596.
9. Garía-Contreras R, Zhang X, Kim Y, Wood T: Protein Translation and Cell Death: The Role of Rare tRNAs in Biofilm
Formation and in Activating Dormant Phage Killer Genes. PLoS ONE 2008, 3(6):1-15.
10. Ren D, Zuo R, Gonzalez A, Bedzyk L, Eldridge G, Pasmore M, Wood T: Differential Gene Expression for Investigation of
Escherichia coli Biofilms Inhibition by Plant Extract Ursolic Acid. Appl Environ Microbiol 2005, 71(7):4022-4034.
11. Beloin C, Valle J, Latour-Lambert P, Faure P, Kzreminski M, Balestrino D, Haagensen J, Molin S, Prensier G, Arbeille B,
Ghigo J: Global impact of mature biofilm lifestyle on Escherichia coli K-12 gene expression. Mol Microbiol 2004,
51(3):659-674.
12. Domka J, Lee J, Bansal T, Wood T: Temporal gene-expression in Escherichia coli K-12 Biofilms. Environ Microbiol 2006,
2:332-346.
13. Baldi P, Hatfield G: DNA Microarrays and Gene Expression: From Experiments to Data Analysis and Modeling.
1 edition.
Cambridge:
Cambridge University Press; 2002, 143-162.
14. Silvescu A, Honavar V: Temporal boolean network models of genetic networks and their inference from gene
expression time series. Complex Systems 2001, 13:54-70.
15. Sankar M, Osmont KS, Rolcik J, Gujas B, Tarkowska D, Strnad M, Xenarios I, Hardtke CS: A qualitative continuous model
of cellular auxin and brassinosteroid signaling and their crosstalk. Bioinformatics 2011, 10:1404-12.
16. Franke R, Theis FJ, Klamt S: From binary to multivalued to continuous models: the lac operon as a case study. Jof
Integr Bioinform 14:2010-2151.
Shalá et al. Theoretical Biology and Medical Modelling 2011, 8:34
/>Page 8 of 9
17. Gupta R, Achenie L: A Network Model For Gene Regulation. Computers and Chemical Engineering 2007, 31:950-961.
18. Stanley N, Lazazzera B: Environmental signals and regulatory pathways that influence biofilm formation. Mol
Microbiol 2004, 52(4):917-924.
19. Jubelin G, Vianney A, Beloin C, Ghigo J, Lazzaroni J, Lejeune P, Dorel C: CpxR/OmpR Interplay Regulates Curli Gene
Expression in Response to Osmolarity in Escherichia coli. J Bacteriol 2005, 187(6):2038-2049.
20. Wei B, Brun-Zinkernagel A, Simecka J, Prüß B, Babitzke P, Romeo T: Positive regulation of motility and flhDC
expression by the RNA-binding protein CsrA of Escherichia coli. Mol Microbiol 2001, 40(1):245-256.
21. Francez-Charlot A, Laugel B, Van Gemert A, Dubarry N, Wiorowski F, Castanié-Cornet M, Gutierrez C, Cam K: RcsCDB
His-Asp phosphorelay system negatively regulates the flhDC operon in Escherichia coli. Mol Microbiol 2003,
49(3):823-832.
22. Vianney A, Jubelin G, Renault S, Dorel C, Lejeune P, Lazzaroni J: Escherichia coli tol and rcs genes participate in the
complex network affecting curli synthesis. Microbiology 2005, 151:2487-2497.
23. Majdalani N, Gottesman S: The Rcs Phosphorelay: A Complex Signal Transduction System. Annu Rev Microbiol 2005,
59:379-405.
24. Sherlock O, Dobrindt U, Jensen J, Vejborg R, Klemm P: Glycosylation of the Self-Recognizing Escherichia coli Ag43
Autotransporter Protein. J Bacteriol 2006, 188(5):1798-1807.
25. Imbeaud S, Auffray C: ’The 39 steps’in gene expression profiling: critical issues and proposed best practices for
microarray experiments. Drug Discov Today 2005, 10(17):1175-1182.
26. Gene Expression Omnibus (GEO accession: GSE3905):[ />27. Saeed A, Bhagabati N, Braisted J, Liang W, Sharov V, Howe E, Li J, Thiagarajan M, White J, Quackenbush J: TM4
microarray software suite. Methods in Enzymology 2006, 411:134-193.
28. Beloin C, Ghigo J: Finding Gene-Expression Patterns In Bacterial Biofilms. Trends Microbiol 2005, 13(1):16-19.
29. Pratt A, Kolter R: Genetic analysis of Escherichia coli biofilms formation: roles of flagella, motility, chemotaxis and
type I pili. Mol Microbiol 1998, 30(2):285-293.
30. Herzberg M, Kaye I, Peti W, Wood T: YdgG (TqsA) Controls Biofilm Formation in Escherichia coli K-12 through
Autoinducer 2 Transport. J Bacteriol 2006, 188(2):587-598.
31. Delisa M, Wu C, Wang L, Valdes J, Bentley W: DNA Microarray-Based Identification of Genes Controlled by
Autoinducer 2-Stimulated Quorum Sensing in Escherichia coli. J Bacteriol 2001, 183(18):5239-5247.
32. Francez-Charlot A, Castanié-Cornet M, Gutierrez C, Cam K: Osmotic Regulation of the Escherichia coli bdm (Biofilm-
Dependent Modulation) Gene by the RcsCDB His-Asp Phosphorelay. J Bacteriol 2005, 187(11):3873-3877.
33. Hagiwara D, Sugiura M, Oshima T, Mori H, Aiba H, Yamashino T, Mizuno T: Genome-Wide Analyses Revealing a
Signaling Network of the RcsC-YojN-RcsB Phosphorelay System in Escherichia coli. J Bacteriol 2003,
185(19):5735-5746.
doi:10.1186/1742-4682-8-34
Cite this article as: Shalá et al.: A network model for biofilm development in Escherichia coli K-12. Theoretical
Biology and Medical Modelling 2011 8:34.
Submit your next manuscript to BioMed Central
and take full advantage of:
• Convenient online submission
• Thorough peer review
• No space constraints or color figure charges
• Immediate publication on acceptance
• Inclusion in PubMed, CAS, Scopus and Google Scholar
• Research which is freely available for redistribution
Submit your manuscript at
www.biomedcentral.com/submit
Shalá et al. Theoretical Biology and Medical Modelling 2011, 8:34
/>Page 9 of 9