Báo cáo y học: "Changes in regional distribution of lung sounds as a function of positive end-expiratory pressure" potx
Bạn đang xem bản rút gọn của tài liệu. Xem và tải ngay bản đầy đủ của tài liệu tại đây (1.06 MB, 10 trang )
Open Access
Available online />Page 1 of 10
(page number not for citation purposes)
Vol 13 No 3
Research
Changes in regional distribution of lung sounds as a function of
positive end-expiratory pressure
Shaul Lev
1
, Yael A Glickman
2
, Ilya Kagan
1
, David Dahan
1
, Jonathan Cohen
1
, Milana Grinev
1
,
Maury Shapiro
1
and Pierre Singer
1
1
Department of General Intensive Care, Rabin Medical Center, Beilinson Campus, 39 Jabotinski Street., Petach Tikva, 49100, Israel
2
Deep Breeze, Ltd., 2 Hailan St., P.O. Box 140, North Industrial Park, Or-Akiva, 30600, Israel
Corresponding author: Shaul Lev,
Received: 7 Nov 2008 Revisions requested: 16 Jan 2009 Revisions received: 27 Apr 2009 Accepted: 10 May 2009 Published: 10 May 2009
Critical Care 2009, 13:R66 (doi:10.1186/cc7871)
This article is online at: />© 2009 Lev et al.; licensee BioMed Central Ltd.
This is an open access article distributed under the terms of the Creative Commons Attribution License ( />),
which permits unrestricted use, distribution, and reproduction in any medium, provided the original work is properly cited.
Abstract
Introduction Automated mapping of lung sound distribution is a
novel area of interest currently investigated in mechanically
ventilated, critically ill patients. The objective of the present
study was to assess changes in thoracic sound distribution
resulting from changes in positive end-expiratory pressure
(PEEP). Repeatability of automated lung sound measurements
was also evaluated.
Methods Regional lung sound distribution was assessed in 35
mechanically ventilated patients in the intensive care unit (ICU).
A total of 201 vibration response imaging (VRI) measurements
were collected at different levels of PEEP between 0 and 15
cmH
2
O. Findings were correlated with tidal volume, oxygen
saturation, airway resistance, and dynamic compliance. Eighty-
two duplicated readings were performed to evaluate the
repeatability of the measurement.
Results A significant shift in sound distribution from the apical
to the diaphragmatic lung areas was recorded when increasing
PEEP (paired t-tests, P < 0.05). In patients with unilateral lung
pathology, this shift was significant in the diseased lung, but not
as pronounced in the other lung. No significant difference in lung
sound distribution was encountered based on level of ventilator
support needed. Decreased lung sound distribution in the base
was correlated with lower dynamic compliance. No significant
difference was encountered between repeated measurements.
Conclusions Lung sounds shift towards the diaphragmatic lung
areas when PEEP increases. Lung sound measurements are
highly repeatable in mechanically ventilated patients with various
lung pathologies. Further studies are needed in order to fully
appreciate the contribution of PEEP increase to diaphragmatic
sound redistribution.
Introduction
The use of acoustic monitoring technology offers the potential
for a radiation-free, noninvasive bedside assessment of lung
abnormality in patients during their stay in the intensive care
unit (ICU). Correlation between breath sound recordings and
regional distribution of pulmonary ventilation has been previ-
ously established, particularly in studies conducted by Ploy-
Song-Sang and colleagues and other groups who compared
acoustic findings with data obtained with radioactive gases [1-
3]. The effect of airflow and volume on the amplitude and
spectral content of breath sounds has been extensively stud-
ied in healthy [4-9] and diseased lungs [10-12]. Furthermore,
several studies assessed the effect of changes of mechanical
ventilation on lung sound distribution in animal models [13-
17]. Räsenen and colleagues reported that the acoustic
changes associated with oleic acid-induced lung injury allow
monitoring of its severity and distribution [13] and that acute
lung injury (ALI) causes regional acoustic transmission abnor-
malities that are reversed during alveolar recruitment with pos-
itive end-expiratory pressure (PEEP) [14]. Recently, Vena and
colleagues reported a reduction of amplitude and a change in
spectral characteristics of normal lung sounds when increas-
ADR: apico-diaphragmatic ratio; ALI: acute lung injury; ARDS: acute respiratory distress syndrome; Cdyn: dynamic compliance; CV: coefficients of
variation; FiO
2
: fraction of inspired oxygen; ICU: intensive care unit; LL: lower left; LR: lower right; ML: middle left; MR: middle right; PaO
2
: partial
arterial pressure of oxygen; PEEP: positive end-expiratory pressure; PSV: pressure support ventilation mode; R
2
: coefficients of determination; Raw:
airway resistance; RR: respiratory rate; SpO
2
: oxygen saturation; SIMV: synchronized intermittent mandatory ventilation; TL: total left lung; TR: total
right lung; UL: upper left; UR: upper right; VRI: vibration response imaging; VT: tidal volume.
Critical Care Vol 13 No 3 Lev et al.
Page 2 of 10
(page number not for citation purposes)
ing PEEP in mechanically ventilated pigs [15]. Finally, record-
ing of crackle-sound during mechanical ventilation was
employed to monitor lung recruitment–derecruitment in a por-
cine model [16,17].
The experience on acoustic monitoring in mechanically venti-
lated patients is limited [18,19] and only preliminary investiga-
tions were conducted to assess changes in regional
distribution of lung sound as a function of changes in mechan-
ical ventilator setting [20,21]. Waitman and colleagues classi-
fied breath sounds recorded in an intensive care setting using
different neural network configurations [22], and a computer-
ized respiratory sound monitor was used to detect wheezes in
pediatric ICU [23]. Detection of endobronchial [24-26] and
esophageal [27] intubation using lung sound monitoring dur-
ing anesthesia was also described. Dellinger and colleagues
recently reported the use of an acoustic-based imaging device
to map the geographical distribution of breath sound as a
function of mechanical ventilation mode [28]. Changes in lung
sound distribution map during recruitment maneuver and
PEEP increase were also reported in four abstracts [29-32].
These findings suggest that breath sound information can be
used to evaluate lung condition during mechanical ventilation;
however, information regarding lung sound monitoring to
adjusted PEEP levels is lacking. PEEP setting is widely used
by physicians and respiratory therapists in order to improve
gas exchange, mainly in patients with severe hypoxic respira-
tory failure such as acute respiratory distress syndrome
(ARDS) and ALI [33] while preventing end-expiratory alveolar
collapse [34] and inspiratory overinflation [35]. In practice
PEEP setting is adjusted to patient condition up to several
times a day, although no standardized method to adjust PEEP
has been accepted to date. The first step in the evaluation of
a new approach is to assess if a change in PEEP induces any
change in the measurement.
The aim of the present study was to evaluate the effect of
changes in PEEP on the regional distribution of lung sounds
as recorded by vibration response imaging (VRI), an acoustic
monitoring technology that creates a dynamic two-dimen-
sional functional image of lung sound distribution during
mechanical ventilation. Repeatability of lung sound measure-
ments was also evaluated.
Materials and methods
Patients
The study was performed in the general ICU of the Rabin Med-
ical Center in Petach-Tikva, Israel. The study protocol was
approved by the Institutional Review Board and informed con-
sent was obtained from all patients or their next-of-kin. Intra-
individual differences in lung sound measurements were inves-
tigated at different levels of PEEP in a prospective trial.
Inclusion and exclusion criteria
Patients enrolled in the study were adults (18 to 85 years old)
with a body mass index greater than 21. Exclusion criteria
included a body habitus or skin condition that would interfere
with sensor placement; the presence of a cardiac pacemaker,
implantable defibrillator or artificial heart valve; or pregnancy.
Study design
The levels of PEEP and the fraction of inspired oxygen (FiO
2
)
were adjusted according to clinical requirements. Among the
35 patients enrolled in this study, one was recorded at PEEP
5 and 10 cmH
2
O and 34 at PEEP 0, 5 and 10 cmH
2
O. Fifteen
of these 34 patients were also recorded at PEEP 15 cmH
2
O.
In 28 patients, PEEP was assigned from low to high level. In
order to assess any effect due to the lack of randomization,
PEEP levels were applied in a random order in a subgroup of
patients (n = 7). At the later stage of the protocol, repeatability
was tested on 26 patients for whom two repeated consecutive
measurements were performed at the same level of PEEP
under the same conditions, over a period of time not exceed-
ing five minutes. No recording was excluded from the repeat-
ability study. Measurements at different PEEP levels were
performed at an interval of at least five minutes. No interven-
tion, except for changes in PEEP, was allowed by the protocol.
Mode of mechanical ventilation, tidal volume (VT), respiratory
rate (RR), partial arterial pressure of oxygen (PaO
2
), FiO
2
, oxy-
gen saturation (SpO
2
), airway resistance (Raw) and online
dynamic compliance (Cdyn) as provided by the ventilator were
documented. Three consecutive measurements of Cdyn were
averaged in order to reduce variability. To keep consistency
and ensure that timing between spontaneous and controlled
cycles do not affect the results, the spontaneous breath was
used whenever available (31 out of 35 patients, 89%), includ-
ing in synchronized intermittent mandatory ventilation mode
(SIMV).
Recording procedure
A schema of the apparatus is provided in Figure 1. The record-
ings were performed using a VRIxv™ device (Deep Breeze
Ltd., Or-Akiva, Israel) with two arrays of six rows by three col-
umns sensors or microphones similar to those used in digital
stethoscopes. The recordings were made in supine position
with a bed angle between 30 to 45°. The arrays were posi-
tioned posterior to the patient's back using a disposable posi-
tioning unit to reduce risk of cross-contamination.
Morphological landmarks such as spine and scapula were
used in order to ensure accurate and repeatable placement of
the sensor arrays. Excessive secretions were removed by
endotracheal and oral suctioning before each series of record-
ings. Airway pressure and flow waveforms were sampled from
the ventilator using a proximal flow sensor inserted in the
patient's circuit. As displayed in Figure 2, these waveforms
were synchronized with the sound energy graph representing
the average sound energy in both lungs. Each recording lasted
for 20 seconds of acquisition time, followed by 40 seconds of
Available online />Page 3 of 10
(page number not for citation purposes)
processing time, and was stored digitally on the device for
later review and analysis.
Measurement output
The output of the measurement consisted of a normalized
dynamic image synchronized with airway pressure and flow
waveforms, revealing the geographical distribution of sound
energy during the respiratory cycle. Because of image normal-
ization, the measurement output aimed at describing the rela-
tive airflow distribution in the lung rather than the absolute
volume. As described in detail by Dellinger and colleagues
[36], this dynamic image was created from a series of gray-
scale still images or frames with each frame representing 0.17
seconds of sound energy. The digitized acoustic signals were
band-pass filtered between 150 and 250 Hz to remove heart
and muscle sounds; median filtering was applied to suppress
impulse noise, and truncation of samples above an automati-
cally determined signal-to-noise threshold was performed.
Sound energy was obtained following down-sampling.
Recording quality was assessed according to pre-determined
criteria [28]. The graph representing the average sound
energy as a function of time throughout the respiratory cycle in
both lungs was displayed underneath the dynamic image.
Each 20 second measurement included up to 10 respiratory
cycles. A normalized representative frame (or map) at peak-
inspiratory flow was automatically selected and displayed on
the screen (Figure 2). This map was also quantified by the soft-
ware and presented as the percentage of weighted pixels in
six lung regions: upper right (UR); middle right (MR); lower
right (LR); upper left (UL); middle left (ML) and lower left (LL),
up to a total of 100%. According to the recording procedure,
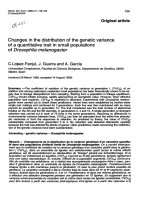
Figure 1
Schematic diagram describing the elements of the systemSchematic diagram describing the elements of the system. The patient lies on the acoustic sensor array and the flow sensor is inserted in the
breathing circuit. The vibration response imaging (VRI) system collects acoustic information simultaneously from the sensor array and pressure and
flow waveforms from the ventilator.
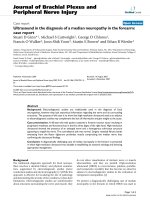
Figure 2
An example of acoustic data as displayed for a recording obtained from a 77-year-old male with myasthenia gravisAn example of acoustic data as displayed for a recording obtained from a 77-year-old male with myasthenia gravis. A representative peak-inspiratory
image (left panel); synchronized sound energy graph and ventilator airway pressure and flow waveforms (middle panel); sound energy distribution in
the six lung regions as automatically provided by the software in percentage of weighted pixel count (right panel). VRI = vibration response imaging.
Critical Care Vol 13 No 3 Lev et al.
Page 4 of 10
(page number not for citation purposes)
'lower' corresponded to the diaphragmatic lung region and
'upper' to the apical lung region. The percentage of sound
energy in the total right lung (TR = UR + MR + LR) and total
left lung (TL = UL + ML + LL) were also documented. The
apico-diaphragmatic ratio (ADR), defined as the ratio between
the lung sound distribution in the apical lung areas (UR + UL)
and the diaphragmatic lung areas (LR + LL) (ADR = (UL +
UR)/(LL + LR)), was used to assess changes in lung sound
distribution along the cephalocaudal axis. A larger ratio sug-
gested increased sound in the apical areas and a smaller ratio
increased sound in the diaphragmatic areas. Distribution was
considered more heterogeneous if the difference was larger
than two; this threshold was derived from experience with
healthy patients in supine positions.
Statistical analysis
Data are presented as the mean ± standard deviation. When
two recordings were performed under identical conditions, the
second recording was used for all analysis not related to the
repeatability aspect of the study. For samples including more
than 30 measurements, paired student's t-test (Microsoft
®
Office Excel 2003, Microsoft Corporation, Redmond, WA,
USA) was used. For the analysis of samples including less
than 30 measurements, Wilcoxon matched-pairs signed-ranks
test, Friedman two-way analysis on ranks test and Wilcoxon
two sample test were used (IFA Services Statistics, Amster-
dam, Holland). Friedman test was used to compare three or
more paired groups. Coefficients of determination (R
2
) and
coefficients of variation (CV) were used to test repeatability. A
P < 0.05 was considered significant.
Results
A total of 35 mechanically ventilated patients (26 males, 9
females, age 62 ± 20 years) were enrolled in the study
between April 2007 and January 2008. Patients were venti-
lated using one of two types of ventilators (Puritan Bennett,
Tyco Healthcare, Mansfield, MA, USA; Evita XL or Evita 4,
Draeger, Lübeck, Germany). The majority of the patients (n =
26; 74%) were mechanically ventilated on pressure support
ventilation mode (PSV) with a level between 8 and 24 cmH
2
O
(mean 14 ± 4 cmH
2
O). Six patients (17%) were ventilated
using SIMV. The rest of the patients (n = 3; 8%) were venti-
lated with other modes of mechanical ventilation. Patients
were not deeply sedated and none were paralyzed.
A total of 201 valid recordings were performed on the 35
patients. No adverse event related to the measurement was
registered. Ten recordings (less than 5% of the overall data)
were excluded from the analysis based on pre-determined cri-
teria as mentioned above [28]. Poor recording quality was
confirmed by an average sound energy level below a pre-
defined threshold (< 1 in the energy bar of the imaging dis-
play). Reasons for mechanical ventilation of these 35 patients
are described in Table 1. Chest radiography results revealed
that 19 of these patients had bilateral disease, 13 had unilat-
eral lung pathology inducing decreased lung sounds (i.e. one-
lung atelectasis, pneumothorax, or pleural fluid) and three had
normal lungs. Average VT was 551 ± 126 mL, SpO
2
97 ± 3%,
RR 21 ± 7 breaths/minute, Cdyn 60 ± 42 mL/mbar, and Raw
16 ± 5 mbar L/second. These parameters did not significantly
change with PEEP (Friedman test, paired groups).
Paired analysis conducted on the 34 patients for which
recordings at PEEP 0, 5, and 10 cmH
2
O were available
revealed that the proportion of sound energy in the diaphrag-
matic lung regions (LR and LL) was significantly increased
with PEEP (P < 0.05, paired t-test), while the proportion of
sound energy in the apical lung regions (UR and UL) was
decreased (P < 0.05 in UL, paired t-test). The proportion of
energy in the middle areas of the lungs (MR and ML) did not
significantly change with PEEP (Figure 3). No additional shift
was detected at PEEP 15 cmH
2
O (n = 15, Wilcoxon matched
paired test). In patients with unilateral lung pathology (n = 13),
the increase in sound energy in the diaphragmatic lung
regions was significant in the diseased lung (7 ± 6% at PEEP
0 cmH
2
O versus 10 ± 7% at PEEP 10 cmH
2
O, P = 0.01, Wil-
coxon matched-pairs) but not significant in the other lung (14
± 8% at PEEP 0 cmH
2
O versus 15 ± 9% at PEEP 10 cmH
2
O,
Wilcoxon matched-pairs). In patients with bilateral lung pathol-
ogy (n = 21), the increase was significant in both lungs (P =
0.04).
The majority of the patients were ventilated on PSV or SIMV,
spontaneous diaphragmatic activity was present in most of the
patients. In order to assess the extent of this confounding fac-
tor, analysis was conducted according to the level of ventilator
support provided to the patients. Patients were divided into
two subsets according to the level of ventilator support
needed (PSV < 15 cmH
2
O and PSV > 15 cmH
2
O). Sound
energy distribution was compared between the two groups at
Table 1
Reason for mechanical ventilation in 35 patients
Reason for intubation N %
Pneumonia 8 23
Acute respiratory failure 7 20
Severe chest trauma 3 9
Interstitial lung disease 2 6
Cerebrovascular accident 2 6
Congestive heart failure 2 6
Acute respiratory distress syndrome 2 6
Pancreatitis 2 6
Head trauma 2 6
Others* 5 14
*Sepsis, chronic obstructive pulmonary disease, myasthenia gravis,
failure to wean, mesenterial ischemia.
Available online />Page 5 of 10
(page number not for citation purposes)
each level of PEEP. No significant difference was detected
(Wilcoxon two sample tests).
As shown in Figure 4, per patient analysis revealed that when
increasing PEEP from 0 to 10 cmH
2
O, sound energy distribu-
tion increased in the diaphragmatic lung areas in 76% of the
patients (26 of 34). In these cases, a larger peak-inspiratory
flow image was obtained at higher PEEP (examples in Figure
5a and 5b). In several patients, an asymmetrical change of
lung sound energy distribution was recorded at PEEP 15
cmH
2
O (Figure 5c, d, and 5e). Comparisons between VT,
SpO
2
, Cdyn and Raw at two different levels of ADR are sum-
marized in Table 2. When adjusted for RR, no difference in VT,
Raw and SpO
2
was encountered between the two levels of
ADR. At RRs lower than 20 breaths/minute, Cdyn tended to
be higher for recordings with increased energy in the lower
lung regions (ADR < 2). This difference approached signifi-
cance (P = 0.058).
The repeatability of the measurement was assessed in 82 sets
of double recordings obtained from 26 patients (20 double
recordings at PEEP 0 cmH
2
O; 25 at PEEP 5 cmH
2
O; 26 at
PEEP 10 cmH
2
O, and 11 at PEEP 15 cmH
2
O to a total of 164
recordings). Repeatability was performed by comparing the
distribution of sound energy in each of the six lung regions of
two repeated measurements, as well as in total left and right
lungs. No significant difference was encountered between
repeated measurements (paired t-test). Mean R
2
obtained for
the different lung regions was 0.93 ± 0.02 (range 0.91 to
0.95) with a CV equal to 1.7%.
Discussion
In this study, we used an acoustic-based monitoring system in
order to assess possible shift in thoracic sound distribution
during PEEP changes and to evaluate the repeatability of lung
sound measurements in mechanically ventilated patients. Our
results revealed a significant increase in sound distribution
from the apical to the diaphragmatic lung areas when increas-
ing PEEP from 0 to 10 cmH
2
O. This shift was especially pro-
nounced in patients with severe lung pathology but was not
affected by the level of pressure support needed. These statis-
tical results were further supported by the analysis of the effect
of PEEP on lung sound distribution in individual patients. As
revealed in Figure 4, lung sound increased in the diaphrag-
matic lung areas in 76% of the patients.
The explanation for this acoustic phenomenon might be
related to an increase in ventilation distribution in the diaphrag-
matic part of the lungs at higher levels of PEEP or to the effect
of other PEEP-related physiologic factors, such as transloca-
tion of fluid from alveolar to interstitial spaces. A similar shift of
lung sound distribution towards the base was recently
described by Dellinger and colleagues [28], while changing
mode of mechanical ventilation from volume control to pres-
sure control and pressure support. The authors speculated
that this shift was produced by a diaphragm-generated nega-
tive intrapleural pressure in pressure-targeted modes. The
authors also proposed that the initial higher flow in pressure-
targeted modes may serve to prime the proximal airway, allow-
ing more time for slower, more laminar flow to produce a more
homogenous distribution of air to lower lung regions. Correla-
Figure 3
Mean ± standard deviation of sound energy distribution in 34 mechanically-ventilated patients recorded at three levels of PEEP (0, 5 and 10 cmH
2
O)Mean ± standard deviation of sound energy distribution in 34 mechanically-ventilated patients recorded at three levels of PEEP (0, 5 and 10
cmH
2
O). Significant P values are indicated (paired t-tests). LL = lower left; LR = lower right; ML = middle left; MR = middle right; PEEP = positive
end-expiratory pressure; UL = upper left; UR = upper right.
Critical Care Vol 13 No 3 Lev et al.
Page 6 of 10
(page number not for citation purposes)
tion between lung condition and heterogeneity of lung sound
distribution has been described in several additional studies.
Bentur and colleagues [37] identified greater heterogeneity of
lung sound distribution in pediatric patients with confirmed
cases of foreign body aspiration when compared with healthy
subjects. Lung sound heterogeneity was also described by
Jean and colleagues [38] when comparing measurements per-
formed on patients with normal lungs versus one diseased
lung on chest radiograph. In agreement with the image normal-
ization method used to generate the lung acoustic map, the
authors explained that a larger image was considered to indi-
cate a more homogeneous sound distribution and a smaller
image a more focal distribution. In our study, the shift of lung
sound distribution towards the base at PEEP 10 cmH
2
O was
accompanied by an increase in the size of the peak-inspiratory
flow image, in line with increased homogeneity of lung sound
distribution. At PEEP level of 15 cmH
2
O, however, the lack of
increased shift towards the base was adjunctive with a
decrease in the size of the image as exemplified in Figures 5c
to 5e. In light of the effect of PEEP elevation in lung sound dis-
tribution, comparison between measurements should be pref-
erably performed when similar PEEP levels are applied.
Repeatability of the lung acoustic measurements was compa-
rable with that reported in healthy subjects [8,39,40]. This
result in patients mechanically ventilated in pressure support
mode may be a priori unexpected, especially when consider-
ing the variability of VT anticipated in this mode. However, this
finding confirms that normalization of the acoustic distribution
map reduces the mere effect of changes in ventilator settings
when these changes do not affect the relative airflow distribu-
tion. Figure 6a, representing normalized images recorded from
the same patient ventilated with two different VT, and Figure
6b, representing normalized images recorded from the same
patient ventilated with two different airflow rates, further illus-
trate this finding.
The scope of this study was limited because of a restrictive
protocol. Enrollment of deeply sedated patients mechanically
ventilated in volume-controlled mode of mechanical ventilation
Figure 4
Individual sound energy distribution in diaphragmatic lung areas in 34 mechanically-ventilated patients recorded at PEEP levels 0 and 10 cmH
2
OIndividual sound energy distribution in diaphragmatic lung areas in 34 mechanically-ventilated patients recorded at PEEP levels 0 and 10 cmH
2
O.
Sound energy distribution increased from 17 ± 11% to 23 ± 12% (P < 0.0001) in (a) 26 'responder' patients and decreased from 30 ± 17% to 27
± 17% (P < 0.001) in (b) eight 'non-responder' patients. PEEP = positive end-expiratory pressure.
Available online />Page 7 of 10
(page number not for citation purposes)
may have allowed controlling for VT and inspiratory flow but
this was out of the scope of this protocol. Another protocol-
related limitation included the effect of volume history which
may interfere with VT distribution. Moreover, differentiation
between diaphragmatic redistribution induced by PEEP and
VT-induced recruitment may be difficult. The population was
heterogeneous and further studies should be performed on a
more homogeneous population allocated to specific lung dis-
ease categories with emphasis on ALI or ARDS. Moreover, the
heterogeneity of the clinical conditions exhibited by the
patients at the time of investigation may be a limitation of the
present study. Despite normalization, airflow velocity of the
ventilators may have affected the results and, considering its
impact on VT distribution and dynamic hyperinflation, it would
Figure 5
Representative frames (or maps) at peak-inspiratory flow obtained from five individual patients at PEEP levels 0, 5, 10 and 15 cmH
2
ORepresentative frames (or maps) at peak-inspiratory flow obtained from five individual patients at PEEP levels 0, 5, 10 and 15 cmH
2
O. (a) A 74-
year-old female with respiratory failure. (b) A 19-year-old male with right pneumothorax. (c) A 83-year-old male with sternal wound infection. (d) A
77-year-old male with myasthenia gravis. (e) A 57-year-old male with acute pancreatitis. PEEP = positive end-expiratory pressure.
Critical Care Vol 13 No 3 Lev et al.
Page 8 of 10
(page number not for citation purposes)
have been interesting to consider the peak flow values. Fur-
thermore, the protocol did not include a comparison of lung
sound distribution with more appropriate tools, such as com-
puterized tomography, functional residual capacity, or electri-
cal impedance tomography. This should be investigated in the
future. Although sometimes useful in research and clinical
practice [41,42], the reliability of Cdyn is debatable, especially
in non-paralyzed patients with non-uniform volume histories.
Despite the fact that during pressure support mode of
mechanical ventilation, Cdyn is particularly difficult to interpret,
this parameter was used in this study because it was readily
accessible in the scope of the protocol. In order to improve the
accuracy of the measurement, three values were averaged at
each time point. Finally, sound filtering to a band-pass of 150
to 250 Hz may have reduced the information as lung sound
characteristics are contained in other frequency bands, espe-
Table 2
Comparison between tidal volume, oxygen saturation, dynamic compliance, and airway resistance at two different levels of apico-
diaphragmatic ratio
RR < 20 breaths/minute (15 ± 3) RR > 20 breaths/minute (26 ± 5)
ADR < 2
(n = 23)
ADR > 2
(n = 14)
P value ADR < 2
(n = 17)
ADR > 2
(n = 23)
P value
Tidal volume
(ml)
577 ± 91 528 ± 101 NS 479 ± 109 483 ± 135 NS
Oxygen saturation
(%)
97 ± 3 97 ± 3 NS 97 ± 3 98 ± 2 NS
Compliance
(mL/mbar)
60 ± 25 42 ± 12 0.058 51 ± 25 48 ± 20 NS
Resistance
(mbar L/second)
15 ± 4 18 ± 7 NS 15 ± 3 16 ± 5 NS
Apico-diaphragmatic ratio (ADR) was defined as the ratio between the lung sound distribution in the apical lung areas (upper right (UR) + upper
left (UL)) and the diaphragmatic lung areas (lower right (LR) + lower left (LL)) (ADR = (UL + UR)/(LL + LR)). Distribution was considered more
heterogeneous if difference was larger than two, threshold derived from experience with healthy patients in supine position. P values are indicated
(Wilcoxon two sample test) as well as non-significant (NS) data. RR = respiratory rate.
Figure 6
Representative frames (or maps) at peak-inspiratory flow obtained from two patients ventilated with different ventilator settingsRepresentative frames (or maps) at peak-inspiratory flow obtained from two patients ventilated with different ventilator settings. (a) A 72-year-old
female with chronic obstructive pulmonary disease recorded at positive end-expiratory pressure (PEEP) level of 5 cmH
2
O and at two levels of tidal
volume (VT; left = 330 mL, right = 560 mL); (b) A 24-year-old male with bilateral chest contusion recorded at PEEP level of 7 cmH
2
O, VT of 600 mL
and at two levels of respiratory rate (RR) and inspiratory/expiratory ratio (i:e; left: i:e = 2:3 and RR = 12 breaths/minute, right: i:e = 5:2 and RR = 16
breaths/minute). TL = total left lung; TR = total right lung.
Available online />Page 9 of 10
(page number not for citation purposes)
cially above 250 Hz. Notwithstanding these limitations, the
development of adjunctive technologies that assist in assess-
ment of clinical benefits of PEEP and recruitment maneuver is
still highly desirable [43,44].
Conclusions
A shift in lung sound distribution from the apical to the dia-
phragmatic lung areas was observed during PEEP increase.
This shift was not correlated with significant change in VT but
was associated with an increase in Cdyn. High repeatability
was obtained in this population. Further studies are needed in
order to elucidate the mechanism of sound shift in relation to
PEEP increment and to fully appreciate the contribution of
PEEP increase to diaphragmatic sound redistribution.
Competing interests
Research materials for the VRI research program at Rabin
Medical Center (Petah Tikva, Israel) are funded partially by
Deep Breeze Ltd. SL has consultant agreement that includes
honoraria and stock options (no current monetary value) with
Deep Breeze Ltd and he was sponsored by GE Healthcare,
Deep Breeze's distributor worldwide, to give lectures in aca-
demic meetings. YAG is an employee of Deep Breeze Ltd. IK,
DD, JC, MG, MS, and PS declare that they have no competing
interests.
Authors' contributions
SL, YAG, IK, DD, MG, and MS participated in the design and
coordination of the study and carried out the VRI recordings.
SL and YAG worked on the data analysis. SL, YAG, JC, and
PS drafted the manuscript. All authors edited and approved
the final manuscript.
Acknowledgements
We would like to express our gratitude to Mrs Michal Kedar for coordi-
nating the data of this study. This research was funded in part by Deep
Breeze Ltd.
References
1. Leblanc P, Macklem PT, Ross WR: Breath sounds and distribu-
tion of pulmonary ventilation. Am Rev Respir Dis 1970,
102:10-16.
2. Ploy-Song-Sang Y, Martin RR, Ross WR, Loudon RG, Macklem
PT: Breath sounds and regional ventilation. Am Rev Respir Dis
1977, 116:187-199.
3. Ploy-Song-Sang Y, Macklem PT, Ross WR: Distribution of
regional ventilation measured by breath sounds. Am Rev
Respir Dis 1978, 117:657-664.
4. Kraman SS: The relationship between airflow and lung sound
amplitude in normal subjects. Chest 1984, 86:225-229.
5. Gavriely N, Cugell DW: Airflow effects on amplitude and spec-
tral content of normal breath sounds. J Appl Physiol 1996,
80:5-13.
6. Kiyokawa H, Pasterkamp H: Volume-dependent variations of
regional lung sound, amplitude, and phase. J Appl Physiol
2002, 93:1030-1038.
7. Bergstresser T, Ofengeim D, Vyshedskiy A, Shane J, Murphy R:
Sound transmission in the lung as a function of lung volume.
J Appl Physiol 2002, 93:667-674.
8. Maher TM, Gat M, Allen D, Devaraj A, Wells AU, Geddes DM:
Reproducibility of dynamically represented acoustic lung
images from healthy individuals. Thorax 2008, 63:542-548.
9. Yigla M, Gat M, Meyer JJ, Friedman PJ, Maher TM, Madison JM:
Vibration response imaging technology in healthy subjects.
AJR Am J Roentgenol 2008, 191:845-852.
10. Murphy RL, Vyshedskiy A, Power-Charnitsky VA, Bana DS,
Marinelli PM, Wong-Tse A, Paciej R: Automated lung sound
analysis in patients with pneumonia. Respir Care 2004,
49:1490-1497.
11. Mor R, Kushnir I, Meyer JJ, Ekstein J, Ben-Dov I: Breath sound dis-
tribution images of patients with pneumonia and pleural effu-
sion. Respir Care 2007, 52:1753-1760.
12. Kramer MR, Raviv Y, Hardoff R, Shteinmatz A, Amital A, Shitrit D:
Regional breath sound distribution analysis in single-lung
transplant recipients. J Heart Lung Transplant 2007,
26:1149-1154.
13. Räsenen J, Gavriely N: Detection of porcine oleic acid-induced
acute lung injury using pulmonary acoustics.
J Appl Physiol
2002, 93:51-57.
14. Räsenen J, Gavriely N: Response of acoustic transmission to
positive airway pressure therapy in experimental lung injury.
Intensive Care Med 2005, 31:1434-1441.
15. Vena A, Perchiazzi , Giuliani R, Fiore T, Hedenstierna G: Acoustic
effects of positive end-expiratory pressure on normal lung
sounds in mechanically ventilated pigs. Clin Physiol Funct
Imaging 2006, 26:45-53.
16. Peták F, Habre W, Babik B, Tolnai J, Hantos Z: Crackle-sound
recording to monitor airway closure and recruitment in venti-
lated pigs. Eur Respir J 2006, 27:808-816.
17. Vena A, Perchiazzi G, Rylander C, Giuliani R, Fiore T, Magnusson
A, Hedenstierna : Breath sound analysis detects injury and
recruitment in the lung during mechanical ventilation. Inten-
sive Care Med 2008, 34(Suppl 1):549.
18. Hubmayr RD: The times are a-changin' should we hang up the
stethoscope? Anesthesiology 2004, 100:1-2.
19. Lichtenstein D, Goldstein I, Mourgeon E, Cluzel P, Grenier P,
Rouby J-J: Comparative diagnostic performances of ausculta-
tion, chest radiography, and lung ultrasonography in acute
respiratory distress syndrome. Anesthesiology 2004, 100:9-15.
20. Cinel I, Jean S, Dellinger RP: Dynamic lung imaging techniques
in mechanically ventilated patients. In Yearbook of Intensive
Care and Emergency Medicine Edited by: Vincent JL. Heidelberg:
Springer-Verlag; 2007:373-380.
21. Lev S, Singer P, Glickman YA: Vibration response imaging: a
novel technology for lung monitoring in critically ill patients. In
Yearbook of Respiratory Care Clinics and Applied Technologies
Edited by: Esquinas A. Murcia: World Federation of Respiratory
Care and Applied Technologies; 2008:530-539.
22. Waitman LR, Clarkson KP, Barwise JA, King PH: Representation
and classification of breath sounds recorded in an intensive
care setting using neural networks. J Clin Monit Comput 2000,
16:95-105.
23. Prodhan P, Dela Rosa RS, Shubina M, Haver KE, Matthews BD,
Buck S, Kacmarek RM, Noviski NN: Wheeze detection in the
pediatric intensive care unit: comparison among physician,
nurses, respiratory therapists, and a computerized respiratory
sound monitor. Respir Care
2008, 53:1304-1309.
24. Tejman-Yarden S, Lederman D, Eilig I, Zlotnik A, Weksler N, Cohen
A, Gurman GM: Acoustic monitoring of double-lumen venti-
lated lungs for the detection of selective unilateral lung venti-
lation. Anesth Analg 2006, 103:1489-1493.
Key messages
• Sound distribution shifts from the apical to the dia-
phragmatic lung areas when increasing level of PEEP
from 0 to 10 cmH
2
O.
• Acoustic shift is not correlated with significant change
in VT but is associated with increased Cdyn.
• Sound distribution measurements are highly repeatable
in mechanically ventilated patients.
Critical Care Vol 13 No 3 Lev et al.
Page 10 of 10
(page number not for citation purposes)
25. Tejman-Yarden S, Zlotnik A, Weizman L, Tabrikian J, Cohen A,
Weksler N, Gurman GM: Acoustic monitoring of lung sounds
for the detection of one-lung intubation. Anesth Analg 2007,
105:397-404.
26. Jean S, Cinel I, Gratz I, Tay C, Lotano V, Deal E, Parillo JE, Dellinger
RP: Image-based monitoring of one-lung ventilation. Eur J
Anaesthesiol 2008, 20:1-7.
27. Cinel I, Jean S, Tay C, Gratz I, Deal E, Parillo JE, Dellinger RP: Case
report: vibration response imaging findings following inadvert-
ent esophageal intubation. Can J Anaesth 2008, 55:172-176.
28. Dellinger RP, Jean S, Cinel I, Tay C, Rajanala S, Glickman YA,
Parillo JE: Regional distribution of acoustic-based lung vibra-
tion as a function of mechanical ventilation mode. Critical Care
2007, 11:R26.
29. Trivedi H, Cinel I, Jean S, Tay C, Durflinger P, Parillo JE, Dellinger
RP: The role of vibration response imaging in the titration of
PEEP in a mechanically ventilated patient with acute respira-
tory distress syndrome. Crit Care Med 2007, 34(Suppl
12):608.
30. Cinel I, Dellinger RP, Jean S, Glickman YA, Parillo JE: Assessment
of the effectiveness of lung recruitment and PEEP setting by
vibration response imaging. Crit Care 2006, 10(Suppl 1):15.
31. Lev S, Kagan I, Grinev M, Cohen J, Singer P: Positive end-expir-
atory pressure-induced changes of the vibration response
image. Crit Care 2008, 12(Suppl 2):299.
32. Lev S, Cohen J, Kagan I, Grinev M, Singer P: Lung sound distri-
bution shifts to the lower lung regions with increased PEEP.
Intensive Care Med 2008, 34(Suppl 1):545.
33. Talmor D, Sarge T, Malhotra A, O'Donnell CR, Ritz R, Lisbon A,
Novack V, Loring SH: Mechanical ventilation guided by esopha-
geal pressure in acute lung injury. N Engl J Med 2008,
359:2095-104.
34. Pelosi P, Caironi P, Bottino N, Gattinoni L: Positive end expira-
tory pressure in anesthesia. Minerva Anestesiol 2000,
66:297-306.
35. Nieszkowska A, Lu Q, Vieira S, Elman M, Fetita C, Rouby JJ: Inci-
dence and regional distribution of lung overinflation during
mechanical ventilation with positive end-expiratory pressure.
Crit Care Med 2004, 32:
1496-1503.
36. Dellinger PR, Parrillo JE, Kushnir A, Rossi M, Kushnir I: Dynamic
visualization of lung sounds with a vibration response device:
a case series. Respiration 2008, 75:60-72.
37. Bentur L, Livnat G, Husein D, Pollack S, Rotschild M: Dynamic
visualization of breath sounds distribution in suspected for-
eign body aspiration. J Bronchology 2007, 14:156-161.
38. Jean S, Cinel I, Tay C, Parrillo JE, Dellinger RP: Assessment of
asymmetric lung disease in intensive care unit patients using
vibration response imaging. Anesth Analg 2008,
107:1243-1247.
39. Mahagnah M, Gavriely N: Repeatability of measurements of
normal lung sounds. Am J Respir Crit Care Med 1994,
149:477-481.
40. Sánchez I, Vizcaya C: Tracheal and lung sounds repeatability in
normal adults. Respir Med 2003, 97:1257-1260.
41. Suarez-Sipmann F, Böhm SH, Tusman G, Pesch T, Thamm O,
Reissmann H, Reske A, Magnusson A, Hedenstierna G: Use of
dynamic compliance for open lung positive end-expiratory
pressure titration in an experimental study. Crit Care Med
2007, 35:214-221.
42. Suarez-Sipmann F: Titrating open lung PEEP in acute lung
injury. A clinical method based on changes in dynamic compli-
ance. In Digital Comprehensive Summaries of Uppsala Disserta-
tions from the Faculty of Medicine 313 Acta Universitatis
Upsaliensis, Uppsala; 2008.
43. Mercat A, Richard JC, Vielle B, Jaber S, Osman D, Diehl JL, Lefrant
JY, Prat G, Richecoeur J, Nieszkowska A, Gervais C, Baudot J,
Bouadma L, Brochard L, Expiratory Pressure (Express) Study
Group: Positive end-expiratory pressure setting in adults with
acute lung injury and acute respiratory distress syndrome: a
randomized controlled trial. JAMA 2008, 299:646-655.
44. Meade MO, Cook DJ, Guyatt GH, Slutsky AS, Arabi YM, Cooper
DJ, Davies AR, Hand LE, Zhou Q, Thabane L, Austin P, Lapinsky S,
Baxter A, Russell J, Skrobik Y, Ronco JJ, Stewart TE, Lung Open
Ventilation Study Investigators: Ventilation strategy using low
tidal volumes, recruitment maneuvers, and high positive end-
expiratory pressure for acute lung injury and acute respiratory
distress syndrome: a randomized controlled trial. JAMA 2008,
299:637-645.