Báo cáo y học: "Serum resistin levels in critically ill patients are associated with inflammation, organ dysfunction and metabolism and may predict survival of non-septic patients" potx
Bạn đang xem bản rút gọn của tài liệu. Xem và tải ngay bản đầy đủ của tài liệu tại đây (460.07 KB, 9 trang )
Open Access
Available online />Page 1 of 9
(page number not for citation purposes)
Vol 13 No 3
Research
Serum resistin levels in critically ill patients are associated with
inflammation, organ dysfunction and metabolism and may predict
survival of non-septic patients
Alexander Koch
1
*, Olav A Gressner
2
*, Edouard Sanson
1
, Frank Tacke
1
* and Christian Trautwein
1
*
1
Department of Medicine III, RWTH-University Hospital Aachen, Pauwelsstrasse 30, 52074 Aachen, Germany
2
Institute of Clinical Chemistry and Pathobiochemistry, RWTH-University Hospital Aachen, Pauwelsstrasse 30, 52074 Aachen, Germany
* Contributed equally
Corresponding author: Alexander Koch,
Received: 2 Apr 2009 Revisions requested: 14 May 2009 Revisions received: 27 May 2009 Accepted: 19 Jun 2009 Published: 19 Jun 2009
Critical Care 2009, 13:R95 (doi:10.1186/cc7925)
This article is online at: />© 2009 Koch et al.; licensee BioMed Central Ltd.
This is an open access article distributed under the terms of the Creative Commons Attribution License ( />),
which permits unrestricted use, distribution, and reproduction in any medium, provided the original work is properly cited.
Abstract
Introduction Blood glucose levels and insulin resistance in
critically ill patients on admission to intensive care units (ICUs)
have been identified as factors influencing mortality. The
pathogenesis of insulin resistance (IR) in critically ill patients is
complex and not fully understood. Resistin is a hormone mainly
derived from macrophages in humans and from adipose tissue
in rodents, which regulates glucose metabolism and insulin
sensitivity. In non-critically ill patients, resistin was found to be
related to impaired glucose tolerance, insulin resistance,
metabolic syndrome, obesity and type 2 diabetes. Therefore,
resistin might represent a link between inflammation, acute
phase response and insulin resistance in critically ill patients.
We aimed to examine the correlation of serum resistin
concentrations to parameters of inflammation, organ function,
metabolism, disease severity and survival in critically ill patients.
Methods On admission to the Medical ICU, 170 patients (122
with sepsis, 48 without sepsis) were studied prospectively and
compared with 60 healthy non-diabetic controls. Clinical data,
various laboratory parameters, metabolic and endocrine
functions as well as investigational inflammatory cytokine
profiles were assessed. Patients were followed for
approximately three years.
Results Resistin serum concentrations were significantly
elevated in all critical care patients compared with healthy
controls, and significantly higher in sepsis than in non-sepsis
patients. Serum resistin concentrations were not associated
with pre-existing type 2 diabetes or obesity. For all critically ill
patients, a correlation to the homeostasis model assessment
index of insulin resistance (HOMA-IR) was shown. Serum
resistin concentrations were closely correlated to inflammatory
parameters such as C-reactive protein, leukocytes,
procalcitonin, and cytokines such as IL6 and TNF-α, as well as
associated with renal failure and liver synthesis capacity. High
resistin levels (> 10 ng/ml) were associated with an
unfavourable outcome in non-sepsis patients on ICU and the
overall survival.
Conclusions Serum resistin concentrations are elevated in
acute inflammation due to sepsis or systemic inflammatory
response syndrome (SIRS). The close correlation with other
acute phase proteins suggests a predominant, clinically relevant
resistin release from macrophages in ICU patients. Moreover,
resistin could potentially serve as a prognostic biomarker in non-
sepsis critically ill patients.
Introduction
Hyperglycemia, impaired glucose tolerance and insulin resist-
ance are common findings in critically ill patients with sepsis
or septic shock [1,2]. Maintenance of normoglycemia (blood
glucose levels ≤ 110 mg/dL) by intensive insulin therapy
improves survival and reduces morbidity in critically ill patients
after cardiac surgery [3]; nevertheless its impact on the out-
come of patients in medical intensive care units (ICU) is an
ongoing matter of debate, especially with regard to the safety
of tight blood glucose control and the effectiveness in this
cohort [4,5]. In patients with obesity, metabolic syndrome and
type 2 diabetes, characterized by target-tissue resistance to
APACHE: Acute Physiology and Chronic Health Evaluation; BMI: body mass index; CRP: C-reactive protein; ELISA: enzyme-linked immunosorbent
assay; HOMA-IR: homeostasis model assessment index of insulin resistance; ICU: intensive care unit; IL: interleukin; TNF-α: tumor necrosis factor α.
Critical Care Vol 13 No 3 Koch et al.
Page 2 of 9
(page number not for citation purposes)
insulin, adipocyte-derived factors (adipokines) have been iden-
tified which signal to the brain, adipose tissue, liver, muscle,
and the immune system, and thus influence insulin resistance
[6]. Obesity itself is regarded as a proinflammatory state with
oxidative stress showing increased levels of TNF-α, IL-6, and
C-reactive protein (CRP) [7]. The mechanisms of insulin resist-
ance in the clinical setting of severe sepsis are numerous and
not exactly understood [8].
Identifying novel biomarkers for linking these states of acute
and subacute inflammation with metabolism is crucial for fur-
ther risk stratification of critically ill and septic patients in the
ICU and developing new therapeutic strategies. Resistin
(named for resistance to insulin) has been proposed as a novel
marker of inflammatory response in sepsis. This is because
elevated resistin plasma levels were found in patients with
severe sepsis and septic shock and were associated with
severity of disease as measured by Acute Physiology and
Chronic Health Evaluation II (APACHE II) score; however, a
correlation to patient outcome and survival could not be dem-
onstrated [9].
In 2001, resistin was originally reported as an adipose tissue-
specific hormone. In animal models resistin is clearly linked to
obesity, metabolic syndrome and type 2 diabetes, in which
hyperglycemia and hyperinsulinemia increase resistin expres-
sion [10]. Murine resistin is primarily produced in adipocytes,
whereas resistin in humans is mainly derived from macro-
phages rather than adipocytes [11,12]. Furthermore, the pro-
tein sequences of murine and human resistin are only
approximately 60% identical. This was thought to contribute to
the fact that data from animal models could be only partially
translated to humans [13-15], leaving the role of resistin in
humans less certain and suggesting varying physiologic rele-
vances in both human and rodent systems.
A recent study, using a novel 'humanized resistin mouse'
model that lacks adipocyte-produced mouse resistin but
expresses human resistin derived from macrophages, could
show that macrophage-derived human resistin contributes to
insulin resistance by means of its inflammatory properties [16].
In the present study, we investigated serum resistin concentra-
tions in a large cohort of critically ill patients in a medical ICU
to understand the regulation of resistin with respect to inflam-
mation, infection, hyperglycemia, and insulin resistance in crit-
ically ill patients and its potential use as a biomarker in ICU
patients.
Materials and methods
Study design and patient characteristics
We studied 170 patients (111 male, 59 female with a median
age of 63 years; range 18 to 86 years) who were admitted to
the General Internal Medicine ICU at the RWTH-University
Hospital Aachen, Germany (Table 1). The study protocol was
approved by the local ethics committee and written informed
consent was obtained from the patient, his or her spouse, or
the appointed legal guardian. Patients that were expected to
have a short-term (< 72 hours) intensive care treatment due to
post-interventional observation or acute intoxication were not
included in this study. Medium length of stay at the ICU was
8.5 days (range 1 to 137 days) and medium length of stay in
hospital was 27 days (range 2 to 151 days).
Patient data, clinical information and blood samples were col-
lected prospectively. The clinical course of patients was
observed in a follow-up period by directly contacting the
patients, the patients' relatives or their primary care physician
over a period of about 900 days. Critical care patients were
divided into two categories: sepsis patients and non-sepsis
patients. Patients in the sepsis group met the criteria pro-
posed by the American College of Chest Physicians and the
Society of Critical Care Medicine Consensus Conference
Committee for severe sepsis and septic shock [17].
The control group consisted of 60 healthy non-diabetic blood
donors (33 male, 27 female, with a median age of 51 years;
range 31 to 69 years) with normal values for blood counts,
CRP, and liver enzymes.
Characteristics of sepsis and non-sepsis patients
Among the 170 critically ill patients enrolled in this study, 122
patients conformed to the criteria of bacterial sepsis (Table 1).
In the majority of sepsis patients the identified origin of infec-
tion was pneumonia (Table 2). Non-sepsis patients did not dif-
fer in age or sex from sepsis patients and were admitted to the
ICU due to cardiopulmonary disorders (myocardial infarction,
pulmonary embolism, and cardiac pulmonary edema), decom-
pensated liver cirrhosis, or other critical conditions. Sepsis
patients more often required mechanical ventilation in the
longer term compared with the non-sepsis patient group
(Table 1). As expected significantly higher levels of laboratory
indicators of inflammation (i.e. CRP, procalcitonin, white blood
cell count) were found in sepsis patients (Table 1, and data not
shown). Nevertheless, both groups did not differ in APACHE
II score, vasopressor demand, or laboratory parameters indi-
cating liver or renal dysfunction (data not shown). Among all
critical care patients, 32% died in the ICU, and an additional
52% of the total initial cohort died during the overall follow-up
of 900 days. In sepsis and non-sepsis patients no significant
differences in rates of death and survival were observed.
Comparative variables
The patients in the sepsis and non-sepsis groups were com-
pared by age, sex, body mass index (BMI), pre-existing diabe-
tes mellitus, and severity of disease using the APACHE II
score [18] at admittance.
ICU treatment such as volume therapy, vasopressor infusions,
demand of ventilation and ventilation hours, antibiotic and
Available online />Page 3 of 9
(page number not for citation purposes)
antimycotic therapy, renal replacement therapy, and nutrition
were recorded, alongside a large number of laboratory param-
eters that were routinely assessed during ICU treatment.
Resistin serum concentrations were analysed using a quanti-
tative sandwich immunoassay (ELISA; BioVendor, LLC, Can-
dler, NC, USA). IL-6, IL-10, TNF-alpha (all Siemens
Healthcare, Erlangen, Germany), and procalcitonin (Kryptor,
B.R.A.H.M.S. Diagnostica, Henningsdorf, Germany) were
measured by commercial chemiluninescence assays, follow-
ing manufacturers' instructions.
Statistical analysis
Due to the skewed distribution of most of the parameters, data
are given as median, minimum, maximum, and 95% confi-
dence interval. Differences between two groups are assessed
by Mann-Whitney U test and multiple comparisons between
more than two groups have been conducted by Kruskal-Wallis
analysis of variance and Mann-Whitney U test for post hoc
analysis. Box plot graphics illustrate comparisons between
subgroups. They display a statistical summary of the median,
quartiles, range, and extreme values. The whiskers extend from
the minimum to the maximum value excluding outside and far-
out values, which are displayed as separate points. An outside
value (indicated by an open circle) is defined as a value that is
smaller than the lower quartile minus 1.5-times interquartile
range, or larger than the upper quartile plus 1.5-times the inter-
quartile range. A far-out value is defined as a value that is
smaller than the lower quartile minus three times interquartile
range, or larger than the upper quartile plus three times the
interquartile range [19]. All values, including outliers, have
been included for statistical analyses. Correlations between
variables have been analyzed using the Spearman correlation
tests, where values of P < 0.05 were considered statistically
significant. The prognostic value of the variables was tested by
univariate and multivariate analysis in the Cox regression
model. Kaplan-Meier curves were plotted to display the impact
Table 1
Characteristics of the study population
Parameter All ICU patients Sepsis Non-sepsis
Number 170 122 48
Sex (number male/number female) 111/59 81/41 30/18
Sex (% male/female) 65/35 66/34 62/38
Age median (years; range) 63 (18 to 86) 64 (20 to 86) 59.9 (18 to 79)
BMI median (range) 25.8 (14 to 59.5) 25.99 (14 to 59.5) 25.1 (17.5 to 53.3)
Median days ICU (range) 8.5 (1 to 137) 10 (1 to 137) 6 (1 to 45)
Median days hospital (range) 27 (2 to 151) 30 (2 to 151) 14 (2 to 85)
Death ICU n (%) 54 (31.8) 42 (34.4) 12 (25)
Survival ICU n (%) 116 (68.2) 80 (65.6) 36 (75)
Death follow-up n (%) 88 (51.8) 64 (52.5) 24 (50)
Survival follow-up n (%) 82 (48.2) 58 (47.5) 24 (50)
Ventilation, n (yes/no) 113/57 82/40 31/17
Median ventilation time hours (range) 66
(0 to 2966)
127.5
(0 to 2966)
31
(0 to 755)
Median CRP (mg/dl; range) 90.5
(5 to 230)
129.5
(5 to 230)
14.5
(5 to 164)
Median creatinine (mg/dl; range) 1.7
(0.1 to 14.1)
1.9
(0.1 to 14.1)
1.3
(0.3 to 13.1)
Median cystatin C (mg/l; range) 1.83
(0.41 to 7.30)
1.98
(0.41 to 6.33)
1.34
(0.41 to 7.30)
Median lactate (nmol/l; range) 1.7
(0.4 to 21.9)
1.7
(0.4 to 21.9)
2.1
(0.7 to 18.1)
Median APACHE II score (range) 14
(0 to 31)
14
(0 to 31)
15
(0 to 31)
Median SAPS-2 score (range) 44
(0 to 80)
45
(0 to 79)
41
(13 to 80)
APACHE = Acute Physiology and Chronic Health Evaluation; BMI = body mass index; CRP = C = reactive protein; ICU = intensive care unit;
SAPS = simplified acute physiology score.
Critical Care Vol 13 No 3 Koch et al.
Page 4 of 9
(page number not for citation purposes)
on survival. All statistical analyses were performed with SPSS
version 12.0 (SPSS, Chicago, IL, USA).
Results
Resistin serum concentrations are elevated in all critical
care patients and significantly higher in sepsis than in
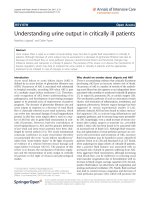
non-sepsis patients
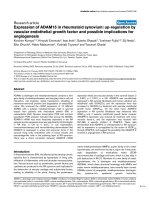
As demonstrated in Table 3 and Figure 1a critical care
patients had significantly higher resistin serum levels than
healthy volunteers in the control group (median 18 ng/ml in
patients vs. 4.7 ng/ml in controls; P < 0.001). Resistin did not
correlate with age or sex in either controls or patients (data not
shown).
The subgroup analysis of septic and non-septic patients
showed significantly higher resistin serum levels in the group
of septic patients (median 24.2 ng/ml in patients with sepsis
vs. 10.5 ng/ml in ICU patients without sepsis, P < 0.001; Fig-
ure 1b).
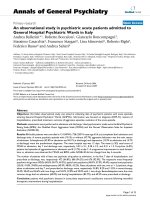
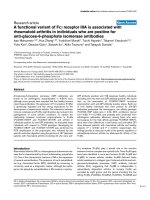
Resistin serum concentrations are not correlated with
pre-existing diabetes mellitus or BMI
Resistin has been initially identified as an adipocytokine
related to insulin resistance, diabetes, and obesity [20]. To
evaluate the effect of pre-existing diabetes mellitus and BMI
we examined subgroups of diabetes patients and patients with
BMI greater than 30 in the sepsis and non-sepsis cohorts.
No significant association between pre-existing diabetes or
obesity and serum resistin could be demonstrated (Figure 2).
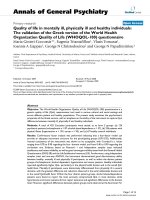
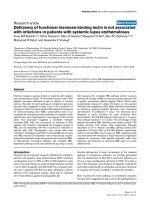
Resistin correlates with biomarkers of inflammation,
organ function and metabolism
In the cohort of all critical care patients, resistin was found to
correlate with a wide number of different biomarkers. The cor-
relating parameters can be classified into markers of inflamma-
tion, markers of organ function, and markers of metabolism
(Table 4). Serum resistin correlated positively to IL-6 (r =
0.477, P < 0.001), IL-10 (r = 0.273, P = 0.002), TNF-α (r =
0.509, P < 0.001), CRP (r = 0.510, P < 0.001), and procalci-
tonin (r = 0.638, P < 0.001). Similar results have been found
in the subgroups of septic and non-septic patients, except for
the correlation with IL-10, which showed no statistical signifi-
cance in the group of non-sepsis patients (Table 4).
Renal failure was associated with elevated serum resistin, as
resistin correlated with creatinine (r = 0.462, P < 0.001) and
cystatin C (r = 0.442, P < 0.001). Furthermore, hepatic bio-
synthetic capacity was related to resistin, as parameters indi-
cating diminished hepatic function such as
pseudocholinesterase (r = -0.269, P = 0.002, Figure 3d) and
bilirubin (r = 0.221, P = 0.013) correlated with resistin. The
correlation with renal function was evident in sepsis and non-
sepsis patient subgroups as well, whereas the impact of liver
function could only be found in patients with sepsis.
In critically ill patients, hyperinsulinemia and hyperglycemia are
common findings and predictive for an unfavorable outcome
[3,21]. The mechanisms of insulin resistance in critically ill
patients are not well understood; resistin might possibly act as
a link between acute inflammation and altered metabolic
homeostasis. For the total patient cohort, serum resistin was
correlated to insulin resistance as calculated by the HOMA-IR
(homeostasis model assessment for insulin resistance) index
and inversely correlated with glucose and insulin at admittance
prior to intensive care interventions (Table 4). However, these
correlations were not observed in the subgroups of sepsis and
non-sepsis patients (Table 4). Moreover, markers of lipid
metabolism, for example, cholesterol (r = -0.296, P = 0.003),
Table 2
Disease etiology of the study population
Sepsis Non-sepsis
n = 122 n = 48
Etiology of sepsis critical illness
Site of infection n (%)
Pulmonary 72 (59%)
Abdominal 22 (18%)
Other 28 (23%)
Etiology of non-sepsis critical illness
n (%)
Decompensated liver cirrhosis 17 (35%)
Cardiopulmonary diseases 18 (38%)
Other 13 (27%)
Table 3
Comparison between healthy volunteers and patients from the intensive care unit
Controls All ICU patients Sepsis Non-sepsis
n = 60 n = 170 n = 122 n = 48
Resistin (ng/ml) median (range) 4.7
(2.2 to 12.7)
18
(3.22 to 50)
24.2
(3.22 to 50)
10.5
(3.33 to 41.1)
Resistin (ng/ml) 90%-interval 2.6 to 10.2 4.8 to 46.4 4.8 to 49.9 3.6 to 39.0
ICU = intensive care unit.
Available online />Page 5 of 9
(page number not for citation purposes)
high-density lipoprotein (r = -0.254, P = 0.019), low-density
lipoprotein (r = -0.378, P < 0.001) and lipoprotein (A) (r = -
0.223, P = 0.040) were found to correlate inversely with
serum resistin in all critical care patients as well as in the sub-
group of sepsis patients.
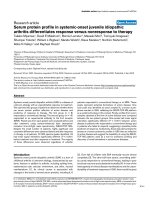
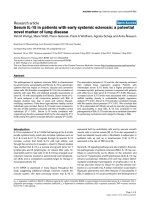
Resistin may be a prognostic factor for survival in non-
sepsis patients
Cox regression analyses and Kaplan-Meier curves were used
to assess the impact of resistin on ICU and overall survival dur-
ing an almost three-year follow-up among all critical care
patients and the subgroups of sepsis and non-sepsis patients.
Regarding all ICU patients, no association between survival
and resistin serum levels could be revealed (data not shown).
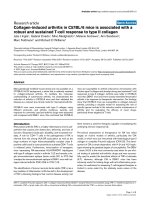
Figure 1
Serum resistin concentrations in critically ill patientsSerum resistin concentrations in critically ill patients. (a) Serum resistin levels are significantly (P < 0.001, U-test) elevated in all patients in the inten-
sive care unit (n = 170) as compared with healthy controls (n = 60). (b) Serum resistin levels are significantly (P < 0.001, U-test) higher in sepsis
patients (n = 122) as compared with non-sepsis (n = 48) patients. Box plots are displayed, where the bold black line indicates the median per
group, the box represents 50% of the values, and horizontal lines show minimum and maximum values of the calculated non-outlier values; open cir-
cles indicate outlier values.
Figure 2
Association of serum resistin with diabetes and obesity in critically ill patientsAssociation of serum resistin with diabetes and obesity in critically ill patients. (a) Serum resistin levels do not differ between patients with or without
pre-existing diabetes mellitus. (b) Serum resistin levels are not associated with obesity as defined by a body mass index of more than 30 kg/m
2
. Box
plots are displayed, where the bold black line indicates the median per group, the box represents 50% of the values, and horizontal lines show mini-
mum and maximum values of the calculated non-outlier values; open circles indicate outlier values. ns = not significant.
Critical Care Vol 13 No 3 Koch et al.
Page 6 of 9
(page number not for citation purposes)
Table 4
Correlations with serum resistin levels
All patients Sepsis Non-sepsis
Parameters r P r P r P
Markers of inflammation
IL-6 0.477 < 0.001 0.289 0.004 0.671 < 0.001
IL-10 0.273 0.002 0.231 0.027 ns
TNF-α 0.509 < 0.001 0.419 < 0.001 0.687 < 0.001
CRP 0.510 < 0.001 0.395 < 0.001 0.389 0.012
Procalcitonin 0.638 < 0.001 0.594 < 0.001 0.458 0.003
Markers of organ function
Creatinine 0.462 < 0.001 0.420 < 0.001 0.602 < 0.001
Cystatin C 0.442 < 0.001 0.404 < 0.001 ns
Lactate ns 0.286 0.006 ns
PCHE -0.269 0.002 -0.280 0.006 ns
Bilirubin 0.221 0.013 0.224 0.035 ns
Markers of metabolism
Protein -0.199 0.02 ns ns
fT3 -0.319 < 0.001 -0.252 0.016 ns
fT4 -0.276 0.001 -0.229 0.028 ns
Cholesterol -0.245 0.004 -0.296 0.003 ns
HDL -0.277 0.002 -0.254 0.019 ns
LDL -0.359 < 0.001 -0.378 < 0.001 ns
Lp(a) ns -0.223 0.040 ns
Glucose -0.320 < 0.001 ns ns
Insulin -0.209 0.02 ns ns
HOMA IR 0.314 < 0.001 ns ns
PO
4
0.321 < 0.001 0.308 0.003 0.417 0.008
Cortisol 0.312 0.001 0.275 0.010 ns
Parathormone 0.212 0.019 0.228 0.033 ns
Clinical scoring
APACHE II ns ns 0.481 0.005
r = correlation coefficient; r and P values by Spearman rank correlation.
APACHE = Acute Physiology and Chronic Health Evaluation;CRP = C-reactive protein; fT3 = free triiodo-thyronine; fT4 = free thyroxine; HDL =
high-density lipoprotein; HOMA IR = homeostasis model assessment index of insulin resistance; IL = interleukin; LDL = low-density lipoprotein;
Lp(a) = lipoprotein (a); ns = not significant; PCHE = pseudocholinesterase; PO
4
= phosphate; TNF-α = tumor necrosis factor α.
Available online />Page 7 of 9
(page number not for citation purposes)
No correlation between resistin levels and survival could be
demonstrated for sepsis patients either (data not shown).
Remarkably, in patients without sepsis, resistin was correlated
with the APACHE II score on admission (r = 0.481, P = 0.005,
Figure 4a). In these non-sepsis patients, high resistin levels
were an adverse prognostic indicator for the ICU (Figure 4b)
as well as overall survival (Figure 4c, P = 0.046, Cox regres-
sion model).
Discussion
This study emphasizes the role of resistin as an acute-phase
protein in critical care circumstances. Compared with healthy
volunteers all critical care patients showed elevated resistin
levels. Levels were higher in sepsis than in non-sepsis patients
with a clear association to markers of the inflammatory
response including white blood cell count, CRP, procalcitonin,
and with the proinflammatory cytokines IL-6, IL-10, and TNF-α.
In recent studies, a correlation between serum resistin and
CRP was demonstrated while investigating patients with dia-
betes [22], coronary artery disease [23,24], or healthy volun-
teers [25]. Our study now shows that resistin is elevated in
Figure 3
Correlation of serum resistin to biomarkers of inflammation in critically ill patientsCorrelation of serum resistin to biomarkers of inflammation in critically ill patients. Serum resistin is strongly correlated with (a) C-reactive protein
CRP (r = 0.510, P < 0.001), (b) IL-6 (r = 0.477, P < 0.001), and (c) TNF-α (r = 0.509, P < 0.001). Spearman rank correlation test.
Figure 4
Association of serum resistin with severity of disease and survival in critically ill patientsAssociation of serum resistin with severity of disease and survival in critically ill patients. (a) Serum resistin is correlated with Acute Physiology and
Chronic Health Evaluation (APACHE) II score (r = 0.481, P = 0.005, Spearman rank correlation test) as a marker of severity of disease only in non-
sepsis patients (n = 48, shown), but not in sepsis patients (n = 122, not shown). (b & c) Serum resistin is a prognostic marker in non-sepsis
patients. (b) Kaplan-Meier survival curves of non-sepsis patients are displayed, showing that patients with high serum resistin levels (> 10 ng/ml,
black) have an increased mortality ain the intensive care unit as compared with patients with low serum resistin (≤ 10 ng/ml, grey). (c) Kaplan-Meier
survival curves of non-sepsis patients are displayed, showing that patients with high serum resistin levels (> 10 ng/ml, black) have an unfavorable
prognosis with respect to overall survival as compared with patients with low serum resistin (≤ 10 ng/ml, grey). Marks on the survival curves repre-
sent the times of censored observation.
Critical Care Vol 13 No 3 Koch et al.
Page 8 of 9
(page number not for citation purposes)
states of critical illness, even without evident infection. The
clear association between resistin and inflammatory markers
also in the non-sepsis patients indicate that resistin is a com-
ponent of the systemic inflammatory response. In severe sep-
sis or septic shock resistin concentrations are twice as high as
in non-sepsis critically ill patients.
In diabetic or obese subjects, resistin has been shown to be
closely correlated to hyperinsulinemia, hyperglycemia, and
insulin resistance in several studies [14,26,27]. In contrast,
other studies could not verify these findings in insulin-resistant
patients or those with type 2 diabetes [28,29]; resistin con-
centrations in these patients did not correlate to HOMA-IR,
BMI, or total cholesterol [15,30]. Regarding inconclusive data
from these studies, the endocrinologic role of resistin in human
glucose metabolism and insulin resistin, unlike the findings in
murine models, is still unclear. In our cohort as well as in a prior
study of septic patients [9], resistin did not correlate to obesity
measured by BMI in both subgroups of sepsis and non-sepsis
patients which suggests that in circumstances of critical ill-
ness the release of resistin by macrophages plays a superior
role compared with secretion from adipocytes. In line, plasma
resistin concentration on admission to the ICU did not corre-
late to pre-existing diabetes mellitus in the sepsis or non-sep-
sis patients.
For the subgroups of sepsis and non-sepsis patients, we
could not find an association of resistin levels on admittance
with hyperinsulinemia and glucose levels. The insulin and glu-
cose values were promptly collected on admission, so they
should be unaffected by therapy, for example, insulin, glucose
and catecholamine infusions. Likewise, in a recent study resis-
tin levels in critical care patients did not match with glucose,
although the authors discussed the affect of therapeutical
interventions [9]. However, serum resistin was positively cor-
related with the HOMA-IR as a marker of insulin resistance.
Resistin in critically ill patients therefore seems to contribute to
acute inflammatory responses and also to insulin resistance in
different ways and to differing degrees.
No association could be shown between resistin levels at
admittance and ICU survival or the overall survival of all
patients, as well as severity of disease, as measured by
APACHE II score for the subgroup of sepsis patients. Remark-
ably, non-survivors in the subgroup of non-sepsis patients had
significantly higher resistin levels than survivors. Assuming that
high resistin levels in critical care patients are dependent on
macrophageal release in acute inflammation, high resistin lev-
els may indicate an excessive inflammatory reaction, possibly
explaining why serum resistin is an independent factor of sur-
vival in this cohort. However, we would like to stress that death
was not a prospectively defined end-point, and that the results
can only be hypothesis generating and require validation in fur-
ther studies. Our observation that high resistin is a predictor
for an unfavorable prognosis only in non-sepsis, but not in sep-
sis, patients further suggests that the massive acute phase
response, as mirrored by elevated resistin, is of considerable
harm in the absence of infection. Further studies are warranted
to evaluate the potential impact for interventional approaches
targeting macrophageal resistin and other cytokine releases in
non-septic critically ill patients as well as its clinical value as a
novel prognostic biomarker.
Beyond markers of sepsis and inflammation we could demon-
strate a strong correlation of serum resistin concentration to
various other laboratory parameters. Supporting previous find-
ings, circulating resistin levels are strongly associated with the
glomerular filtration rate [31]. For the subgroup of sepsis
patients we could demonstrate that resistin is significantly
increased in patients with impaired liver function, as evaluated
by serum pseudocholinesterase activity and bilirubin concen-
tration, compared with healthy controls. In full agreement, an
inverse relation of resistin levels and hepatic biosynthetic
capacity in liver cirrhosis has been described [32]. Both
observations, correlations with renal and liver dysfunction, are
in agreement with the interpretation of serum resistin as a sen-
sitive indicator of the systemic inflammatory response in sep-
sis.
Conclusions
Our study demonstrates the potential role of resistin as an
acute-phase protein in critically ill patients and its correlation
to renal and liver function, and metabolism. Future studies are
required to establish if resistin might serve as a novel prognos-
tic biomarker predicting ICU and overall survival in critically ill
patients.
Competing interests
The authors declare that they have no competing interests.
Key messages
• Resistin, a hormone mainly derived from macrophages
in humans and from adipose tissue in rodents, has been
implicated in glucose metabolism and insulin sensitivity.
• Resistin serum concentrations are elevated in all critical
care patients compared with healthy controls and fur-
ther elevated in patients with sepsis.
• The clear association between serum resistin and
inflammatory markers indicate that resistin is a compo-
nent of the systemic inflammatory response.
• Resistin correlates with renal and liver function as well
as with metabolic and endocrine markers.
• Resistin may be a prognostic factor for survival in non-
sepsis patients, but not sepsis patients, and could
therefore possibly serve as a novel biomarker in critically
ill patients.
Available online />Page 9 of 9
(page number not for citation purposes)
Authors' contributions
AK, FT, and CT designed the study, analyzed data, and wrote
the manuscript. OAG performed the resistin and cytokine
measurements. ES collected data and assisted in patient
recruitment.
Acknowledgements
This work was supported by the German Research Foundation (DFG
Ta434/2-1 & SFB/TRR57 to F.T., SFB 542 C14 to C.T.) and the Inter-
disciplinary Centre for Clinical Research "BIOMAT." within the faculty of
Medicine at the RWTH Aachen University (to F.T.).
References
1. Van Cromphaut SJ, Vanhorebeek I, Berghe G Van den: Glucose
metabolism and insulin resistance in sepsis. Curr Pharm Des
2008, 14:1887-1899.
2. Whitcomb BW, Pradhan EK, Pittas AG, Roghmann MC, Perencev-
ich EN: Impact of admission hyperglycemia on hospital mortal-
ity in various intensive care unit populations. Crit Care Med
2005, 33:2772-2777.
3. Berghe G van den, Wouters P, Weekers F, Verwaest C, Bruyn-
inckx F, Schetz M, Vlasselaers D, Ferdinande P, Lauwers P, Bouil-
lon R: Intensive insulin therapy in the critically ill patients. N
Engl J Med 2001, 345:1359-1367.
4. Berghe G Van den, Wilmer A, Hermans G, Meersseman W, Wout-
ers PJ, Milants I, Van Wijngaerden E, Bobbaers H, Bouillon R:
Intensive insulin therapy in the medical ICU. N Engl J Med
2006, 354:449-461.
5. Brunkhorst FM, Engel C, Bloos F, Meier-Hellmann A, Ragaller M,
Weiler N, Moerer O, Gruendling M, Oppert M, Grond S, Olthoff D,
Jaschinski U, John S, Rossaint R, Welte T, Schaefer M, Kern P,
Kuhnt E, Kiehntopf M, Hartog C, Natanson C, Loeffler M, Reinhart
K, German Competence Network Sepsis (SepNet): Intensive
insulin therapy and pentastarch resuscitation in severe sepsis.
N Engl J Med 2008, 358:125-139.
6. Badman MK, Flier JS: The adipocyte as an active participant in
energy balance and metabolism. Gastroenterology 2007,
132:2103-2115.
7. Dandona P, Aljada A, Bandyopadhyay A: Inflammation: the link
between insulin resistance, obesity and diabetes. Trends
Immunol 2004, 25:4-7.
8. Qatanani M, Lazar MA: Mechanisms of obesity-associated insu-
lin resistance: many choices on the menu. Genes Dev 2007,
21:1443-1455.
9. Sunden-Cullberg J, Nystrom T, Lee ML, Mullins GE, Tokics L,
Andersson J, Norrby-Teglund A, Treutiger CJ: Pronounced eleva-
tion of resistin correlates with severity of disease in severe
sepsis and septic shock. Crit Care Med 2007, 35:1536-1542.
10. Steppan CM, Bailey ST, Bhat S, Brown EJ, Banerjee RR, Wright
CM, Patel HR, Ahima RS, Lazar MA: The hormone resistin links
obesity to diabetes. Nature 2001, 409:307-312.
11. Patel L, Buckels AC, Kinghorn IJ, Murdock PR, Holbrook JD,
Plumpton C, Macphee CH, Smith SA: Resistin is expressed in
human macrophages and directly regulated by PPAR gamma
activators.
Biochem Biophys Res Commun 2003, 300:472-476.
12. Savage DB, Sewter CP, Klenk ES, Segal DG, Vidal-Puig A, Con-
sidine RV, O'Rahilly S: Resistin/Fizz3 expression in relation to
obesity and peroxisome proliferator-activated receptor-
gamma action in humans. Diabetes 2001, 50:2199-2202.
13. Degawa-Yamauchi M, Bovenkerk JE, Juliar BE, Watson W, Kerr K,
Jones R, Zhu Q, Considine RV: Serum resistin (FIZZ3) protein is
increased in obese humans. J Clin Endocrinol Metab 2003,
88:5452-5455.
14. McTernan PG, Fisher FM, Valsamakis G, Chetty R, Harte A, McTer-
nan CL, Clark PM, Smith SA, Barnett AH, Kumar S: Resistin and
type 2 diabetes: regulation of resistin expression by insulin
and rosiglitazone and the effects of recombinant resistin on
lipid and glucose metabolism in human differentiated adi-
pocytes. J Clin Endocrinol Metab 2003, 88:6098-6106.
15. Youn BS, Yu KY, Park HJ, Lee NS, Min SS, Youn MY, Cho YM,
Park YJ, Kim SY, Lee HK, Park KS: Plasma resistin concentra-
tions measured by enzyme-linked immunosorbent assay
using a newly developed monoclonal antibody are elevated in
individuals with type 2 diabetes mellitus. J Clin Endocrinol
Metab 2004, 89:150-156.
16. Qatanani M, Szwergold NR, Greaves DR, Ahima RS, Lazar MA:
Macrophage-derived human resistin exacerbates adipose tis-
sue inflammation and insulin resistance in mice. J Clin Invest
2009 in press.
17. Bone RC, Balk RA, Cerra FB, Dellinger RP, Fein AM, Knaus WA,
Schein RM, Sibbald WJ: Definitions for sepsis and organ failure
and guidelines for the use of innovative therapies in sepsis.
The ACCP/SCCM Consensus Conference Committee. Ameri-
can College of Chest Physicians/Society of Critical Care Med-
icine. Chest 1992, 101:1644-1655.
18. Knaus WA, Draper EA, Wagner DP, Zimmerman JE: APACHE II: a
severity of disease classification system. Crit Care Med 1985,
13:818-829.
19. Yagmur E, Weiskirchen R, Gressner AM, Trautwein C, Tacke F:
Insulin resistance in liver cirrhosis is not associated with circu-
lating retinol-binding protein 4. Diabetes Care 2007,
30:1168-1172.
20. McTernan CL, McTernan PG, Harte AL, Levick PL, Barnett AH,
Kumar S: Resistin, central obesity, and type 2 diabetes. Lancet
2002, 359:46-47.
21. Umpierrez GE, Isaacs SD, Bazargan N, You X, Thaler LM, Kitabchi
AE: Hyperglycemia: an independent marker of in-hospital mor-
tality in patients with undiagnosed diabetes. J Clin Endocrinol
Metab 2002, 87:978-982.
22. Shetty GK, Economides PA, Horton ES, Mantzoros CS, Veves A:
Circulating adiponectin and resistin levels in relation to meta-
bolic factors, inflammatory markers, and vascular reactivity in
diabetic patients and subjects at risk for diabetes. Diabetes
Care 2004, 27:2450-2457.
23. Reilly MP, Lehrke M, Wolfe ML, Rohatgi A, Lazar MA, Rader DJ:
Resistin is an inflammatory marker of atherosclerosis in
humans. Circulation 2005, 111:932-939.
24. Al-Daghri N, Chetty R, McTernan PG, Al-Rubean K, Al-Attas O,
Jones AF, Kumar S: Serum resistin is associated with C-reac-
tive protein & LDL cholesterol in type 2 diabetes and coronary
artery disease in a Saudi population. Cardiovasc Diabetol
2005, 4:10.
25. Bo S, Gambino R, Pagani A, Guidi S, Gentile L, Cassader M,
Pagano GF: Relationships between human serum resistin,
inflammatory markers and insulin resistance. Int J Obes
(Lond) 2005, 29:1315-1320.
26. Silha JV, Krsek M, Skrha JV, Sucharda P, Nyomba BL, Murphy LJ:
Plasma resistin, adiponectin and leptin levels in lean and
obese subjects: correlations with insulin resistance. Eur J
Endocrinol 2003, 149:331-335.
27. Fujinami A, Obayashi H, Ohta K, Ichimura T, Nishimura M, Matsui
H, Kawahara Y, Yamazaki M, Ogata M, Hasegawa G, Nakamura N,
Yoshikawa T, Nakano K, Ohta M: Enzyme-linked immunosorb-
ent assay for circulating human resistin: resistin concentra-
tions in normal subjects and patients with type 2 diabetes.
Clin Chim Acta 2004, 339:57-63.
28. Pfutzner A, Langenfeld M, Kunt T, Lobig M, Forst T: Evaluation of
human resistin assays with serum from patients with type 2
diabetes and different degrees of insulin resistance. Clin Lab
2003, 49:571-576.
29. Stejskal D, Adamovska S, Bartek J, Jurakova R, Proskova J: Resis-
tin – concentrations in persons with type 2 diabetes mellitus
and in individuals with acute inflammatory disease. Biomed
Pap Med Fac Univ Palacky Olomouc Czech Repub 2003,
147:63-69.
30. Yang J, Li M, Wu CY, Wang H, Xu QS, Deng JY: Reduced resistin
levels in patients with type 2 diabetes mellitus. Zhonghua Yi
Xue Za Zhi 2003, 83:1471-1474.
31. Axelsson J, Bergsten A, Qureshi AR, Heimburger O, Barany P,
Lonnqvist F, Lindholm B, Nordfors L, Alvestrand A, Stenvinkel P:
Elevated resistin levels in chronic kidney disease are associ-
ated with decreased glomerular filtration rate and inflamma-
tion, but not with insulin resistance. Kidney Int 2006,
69:596-604.
32. Yagmur E, Trautwein C, Gressner AM, Tacke F: Resistin serum
levels are associated with insulin resistance, disease severity,
clinical complications, and prognosis in patients with chronic
liver diseases. Am J Gastroenterol 2006, 101:1244-1252.