Báo cáo y học: " Simulating non-small cell lung cancer with a multiscale agent-based model" doc
Bạn đang xem bản rút gọn của tài liệu. Xem và tải ngay bản đầy đủ của tài liệu tại đây (607.64 KB, 14 trang )
BioMed Central
Page 1 of 14
(page number not for citation purposes)
Theoretical Biology and Medical
Modelling
Open Access
Research
Simulating non-small cell lung cancer with a multiscale agent-based
model
Zhihui Wang, Le Zhang, Jonathan Sagotsky and Thomas S Deisboeck*
Address: Complex Biosystems Modeling Laboratory, Harvard-MIT (HST) Athinoula A. Martinos Center for Biomedical Imaging, Massachusetts
General Hospital, Charlestown, MA 02129, USA
Email: Zhihui Wang - ; Le Zhang - ;
Jonathan Sagotsky - ; Thomas S Deisboeck* -
* Corresponding author
Abstract
Background: The epidermal growth factor receptor (EGFR) is frequently overexpressed in many
cancers, including non-small cell lung cancer (NSCLC). In silico modeling is considered to be an
increasingly promising tool to add useful insights into the dynamics of the EGFR signal transduction
pathway. However, most of the previous modeling work focused on the molecular or the cellular
level only, neglecting the crucial feedback between these scales as well as the interaction with the
heterogeneous biochemical microenvironment.
Results: We developed a multiscale model for investigating expansion dynamics of NSCLC within
a two-dimensional in silico microenvironment. At the molecular level, a specific EGFR-ERK
intracellular signal transduction pathway was implemented. Dynamical alterations of these
molecules were used to trigger phenotypic changes at the cellular level. Examining the relationship
between extrinsic ligand concentrations, intrinsic molecular profiles and microscopic patterns, the
results confirmed that increasing the amount of available growth factor leads to a spatially more
aggressive cancer system. Moreover, for the cell closest to nutrient abundance, a phase-transition
emerges where a minimal increase in extrinsic ligand abolishes the proliferative phenotype
altogether.
Conclusion: Our in silico results indicate that in NSCLC, in the presence of a strong extrinsic
chemotactic stimulus (and depending on the cell's location) downstream EGFR-ERK signaling may
be processed more efficiently, thereby yielding a migration-dominant cell phenotype and overall, an
accelerated spatio-temporal expansion rate.
Background
Non-small cell lung cancer (NSCLC) remains at the top of
the list of cancer-related deaths in the United States [1].
The epidermal growth factor receptor (EGFR) is frequently
overexpressed in NSCLC [2,3]. Binding of epidermal
growth factor (EGF) or transforming growth factor alpha
(TGF
α
) to the extracellular domain of EGFR produces a
number of downstream effects that affect phenotypic cell
behavior including proliferation, invasion, metastasis,
and inhibition of apoptosis [4]. In particular, increasing
the expression of these growth factors leads to EGFR
hyperactivity [5,6], thus increases tumor cell motility and
invasiveness, and finally enhances lung metastasis [7,8].
Since approximately 90% of all cancer deaths originate
Published: 21 December 2007
Theoretical Biology and Medical Modelling 2007, 4:50 doi:10.1186/1742-4682-4-50
Received: 12 June 2007
Accepted: 21 December 2007
This article is available from: />© 2007 Wang et al; licensee BioMed Central Ltd.
This is an Open Access article distributed under the terms of the Creative Commons Attribution License ( />),
which permits unrestricted use, distribution, and reproduction in any medium, provided the original work is properly cited.
Theoretical Biology and Medical Modelling 2007, 4:50 />Page 2 of 14
(page number not for citation purposes)
from the spread of primary tumor cells into the surround-
ing tissue [9], quantitative measurements of the relation-
ship between the level of the growth factors and the
resulting tumor expansion is crucial – all the more so,
since EGFR has emerged as an attractive therapeutic target
for patients with advanced NSCLC [10].
A number of EGFR-related intracellular signal transduc-
tion pathways have been studied [11-16], including
NSCLC [17], and corresponding computational models at
the molecular-level have been developed. These quantita-
tive works mainly focused on signal-response relation-
ships between the binding of EGF to EGFR and the
activation of downstream proteins in the signaling cas-
cade. With these in silico approaches, experimentally test-
able hypotheses can be made on signaling events
controlling divergent cellular responses such as cell prolif-
eration, differentiation, or apoptosis [18,19]. However,
most signaling works did not yet consider the cellular
level (see [20,21] for a review), and, conversely, only a few
recent EGF/EGFR-mediated cellular-level models have
started to incorporate a simple molecular level in studying
e.g., cell migration in breast cancer [22], cell proliferation
[23], and autocrine receptor-ligand dynamics [24,25]. We
argue that a more detailed understanding of a complex
cancer system requires integrating both molecular- and cel-
lular-level works to properly examine multicellular
dynamics. To our knowledge, to date, no multiscale
model of NSCLC has been developed or published.
Our group has been developing multiscale models to
investigate highly malignant brain tumors as complex
dynamic and self-organizing biosystems. Since this NSCLC
model builds on these works, we will briefly review some
milestones. First, an agent-based model for studying the
spatio-temporal expansion of virtual glioma cells in a
two-dimensional (2D) environment was built and the
relationship between rapid growth and extensive tissue
infiltration was investigated [26,27]. This 'micro-macro'
framework was then extended 'top-down' by incorporat-
ing an EGFR molecular interaction network [28] so that
molecular dynamics at the protein level could be related
to multi-cellular tumor growth patterns [29]. Most
recently, an explicit cell cycle description was imple-
mented to study in more detail brain tumor growth
dynamics in a three-dimensional (3D) context [30]. These
previous works have provided a computational paradigm
in which biological processes have been successfully sim-
ulated from the molecular scale up to the cellular level
and beyond. This progress led us to test the platform's
applicability to and flexibility for other cancer types as
well.
In this paper, we have therefore extended these previous
modeling works to the case of NSCLC. Necessary modifi-
cations include at the molecular level the implementation
of a NSCLC-specific EGFR-ERK signal transduction path-
way. A novel, data-driven switch that is operated by two
key molecules, i.e. phospholipase C
γ
(PLC
γ
) and extracel-
lular signal-regulated kinase (ERK), processes the pheno-
typic decision at the cellular level. The aim of this in silico
work is to provide insights into the externally triggered
molecular-level dynamics that govern phenotypic changes
and thus impact multicellular patterns in NSCLC. In the
following sections, we will first show the detailed design
of the model before we present and then discuss the sim-
ulation results.
Model
Molecular Signaling Pathway
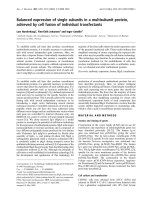
The kinetic model of the implemented NSCLC-specific
molecular signaling pathway, which consists of 20 mole-
cules, is shown in Fig. 1. These proteins, including both
receptor (EGFR) and non-receptor kinases (e.g., PLC
γ
and
protein kinase C (PKC) [31,32], Raf, mitogen-activated
protein kinase kinase (MEK), and ERK [33-35]), have
been experimentally or clinically proven to play an impor-
tant role in NSCLC tumorigenesis. Although in reality
these molecules fulfil their functions by interacting with a
multitude of other molecular species from many distinct
pathways [36,37], we choose to start with these proteins
not only because of their significance in the case of
NSCLC but also since most of their kinetic parameters can
be found in the literature. Also, it is reasonable to reduce
the number of involved molecules as a starting point for
modeling [38]. Amongst these proteins, both PLC
γ
and
ERK are of particular interest for determining the cell's
phenotypic changes as we will detail below.
Kinetic equations are written in terms of concentrations
and the reaction rates are functions of concentrations. The
association and dissociation steps are characterized by
first-order and second-order rate constants, respectively.
We note that, although in reality chemical reactions of
second or higher order are two-step processes, they are
usually treated as a one-step process in mathematical
modeling [39]. Our model is based on a total of 20 ordi-
nary differential equations (ODEs) and uses exactly the
same modeling techniques as other pathway analysis
studies (see [11,12] for detailed definitions). For simplic-
ity, the ODEs for different molecules were calculated by
Eq. (1):
where X
i
represents one of these 20 molecular pathway
components. In Eq. (1), the change in concentration of
molecule X
i
is the result of the reaction rates producing X
i
dX
dt
vv
()
i
production Consumption
=−
∑∑
Theoretical Biology and Medical Modelling 2007, 4:50 />Page 3 of 14
(page number not for citation purposes)
Kinetic model of the NSCLC-specific EGFR signaling pathwayFigure 1
Kinetic model of the NSCLC-specific EGFR signaling pathway. The arrows represent the reactions specified in Tables
1 and 2.
(*)(*)5
(*)(*)5
(*)(*)5 (*)(*)53
3/&
(*)(*)53/&
(*)(*)53/& 3(*)(*)53
3/& 33/& 3,
$'3
$73
$73 $'3
3L
3L
&HOO&\FOH
3.&
5DI
0(. 0(.3
(5. (5.3
(*)5
Y Y Y Y
Y
Y
Y
YY
Y
Y
Y
Y
YY
Y Y
Y
Y
0(.33
(5.33
Y
Y
5DI
3.&
(*)
Table 1: Kinetic equations and initial concentrations. See Table 2 for references.
Reactant Molecular variable Initial concentration [nM] ODE
X
1
EGF to be varied d(X
1
)/dt = -v
1
X
2
EGFR 80 d(X
2
)/dt = -v
1
X
3
EGF-EGFR 0 d(X
3
)/dt = v
1
- 2v
2
X
4
(EGF-EGFR)2 0 d(X
4
)/dt = v
2
+ v
4
- v
3
X
5
EGF-EGFR-P 0 d(X
5
)/dt = v
3
+ v
7
- v
4
- v
5
X
6
PLC
γ
10 d(X
6
)/dt = v
8
- v
5
X
7
EGF-EGFR-PLC
γ
0d(X
7
)/dt = v
5
- v
6
X
8
EGF-EGFR-PLC
γ
-P 0 d(X
8
)/dt = v
6
- v
7
X
9
PLC
γ
-P 0 d(X
9
)/dt = v
7
- v
8
- v
9
- v
10
X
10
PLC
γ
-P-I 0 d(X
10
)/dt = v
9
X
11
PKC 10 d(X
11
)/dt = -v
10
X
12
PKC* 0 d(X
12
)/dt = v
10
- v
11
X
13
Raf 100 d(X
13
)/dt = -v
11
X
14
Raf* 0 d(X
14
)/dt = v
11
- v
12
- v
14
X
15
MEK 120 d(X
15
)/dt = v
13
- v
12
X
16
MEK-P 0 d(X
16
)/dt = v
12
+ v
15
- v
13
- v
14
X
17
MEK-PP 0 d(X
17
)/dt = v
14
- v
15
- v
16
- v
18
X
18
ERK 100 d(X
18
)/dt = v
17
- v
16
X
19
ERK-P 0 d(X
19
)/dt = v
16
+ v
19
- v
17
- v
18
X
20
ERK-PP 0 d(X
20
)/dt = v
18
- v
19
- PKC* and Raf * indicate the activated form of PKC and Raf, respectively.
Theoretical Biology and Medical Modelling 2007, 4:50 />Page 4 of 14
(page number not for citation purposes)
minus the reaction rates consuming it. Each biochemical
reaction is then characterized by v
i
(see Fig. 1) with for-
ward and reverse rate constants. Tables 1 and 2 summarize
the kinetic parameters and the ODEs used for the model.
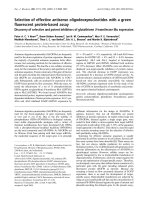
Micro-Environment
The 2D virtual micro-environment is made up of a dis-
crete lattice consisting of a grid with 200 × 200 points (Fig.
2). We use p(i, j) to express each point in the lattice, where
i and j indicate the integer location in Euclidean terms.
One single, distant nutrient source (simulating a cross-
sectional blood vessel) is located at p(150, 150). To start
with, a number of M × N cells (in other words, an M-by-N
matrix) are initialized in the center of the lattice (and this
number can be set to meet different simulation purposes).
Each grid point can be occupied by one cell only or
remain empty at a time.
Three external chemical cues are employed in the model:
EGF, glucose and oxygen tension. As we have done in pre-
vious studies [29,30], the nutrient source carries the high-
est value of these three diffusive cues, which implicates
that it is the most attractive location for the chemotacti-
cally acting tumor cells. Then, by means of normal distri-
bution, each grid point of the lattice is assigned a
concentration profile of these three cues. The levels of
these distributions are weighted by the distance, d
ij
, of a
given grid point from the nutrient source. The distribu-
tions of these three cues are described by the following
equations:
Moreover, the three chemotactic cues continue to diffuse
over the lattice throughout the entire process of a simula-
tion with a fixed rate, using the following equation:
where M represents one of the three external cues, and t
represents a time step. The coefficients in Eqs. (2–5) are
listed in Table 3 (see also [30] for more details). It is evi-
dent then that the closer a given location is to the nutrient
source, the higher the levels of the three cues will be at this
grid point. Glucose will be continuously taken up by cells
to support their metabolism. Only the nutrient source,
p(150, 150), is replenished at each time step while all
other grid points are not. In addition, cells take up both
their own EGF and that secreted by adjoining cells in our
model, because cancer cells act in both autocrine and
paracrine manner in consuming EGF [40,41].
Each cell encompasses a self-maintained molecular inter-
action network (shown in Fig. 1) and the simulation sys-
tem records the molecular composite profile at every time
step to determine the cell's phenotype for the next step. In
EGF T d
ij
mijt
=⋅ −exp( / )2
22
σ
Glucose G G G d
ij
ama ijg
=+ − ⋅ −( ) exp( / )2
22
σ
Oxygen O O O d
ij
ama ijo
=+ − ⋅ −( ) exp( / )2
22
σ
∂
∂
=⋅∇ =
M
ij
t
DM
M
ij
2
123, , , , .t
Table 2: Kinetic parameters. Concentrations and the Michaelis-Menten constants (K
4
, K
8
, and K
11
-K
19
) are given in [nM]. First- and
second-order rate constants are given in [s
-1
] and [nM
-1
·s
-1
], respectively. V
4
, V
8
, and V
11
-V
19
are expressed in [nM·s
-1
].
Reaction number Equation Kinetic parameter Reference
v
1
k
1
·X
1
·X
2
- k
-1
·X
3
k
1
= 0.003 k
-1
= 0.06 [11]
v
2
k
2
·X
3
·X
3
- k
-2
·X
4
k
2
= 0.01 k
-2
= 0.1 [11]
v
3
k
3
·X
4
- k
-3
·X
5
k
3
= 1 k
-3
= 0.01 [11]
v
4
V
4
·X
5
/(K
4
+ X
5
)V
4
= 450 K
4
= 50 [11]
v
5
k
5
·X
5
·X
6
- k
-5
·X
7
k
5
= 0.06 k
-5
= 0.2 [11]
v
6
k
6
·X
7
- k
-6
·X
8
k
6
= 1 k
-6
= 0.05 [11]
v
7
k
7
·X
8
- k
-7
·X
5
·X
9
k
7
= 0.3 k
-7
= 0.006 [11]
v
8
V
8
·X
9
/(K
8
+ X
9
)V
8
= 1 K
8
= 100 [11]
v
9
k
9
·X
9
- k
-9
·X
10
k
9
= 1 k
-9
= 0.03 [11]
v
10
k
10
·X
9
·X
11
- k
-10
·X
12
k
10
= 0.214 k
-10
= 5.25 Estimate
v
11
V
11
·X
12
·X
13
/(K
11
+ X
13
)V
11
= 4 K
11
= 64 [39]
v
12
V
12
·X
14
·X
15
/[K
12
·(1 + X
16
/K
14
) + X
15
]V
12
= 3.5 K
12
= 317 [14]
v
13
V
13
·X
16
/[K
13
·(1 + X
17
/K
15
) + X
16
]V
13
= 0.058 K
13
= 2200 [12]
v
14
V
14
·X
14
·X
16
/[K
14
·(1 + X
15
/K
12
) + X
16
]V
14
= 2.9 K
14
= 317 [12]
v
15
V
15
·X
17
/[K
15
·(1 + X
16
/K
13
) + X
17
]V
15
= 0.058 K
15
= 60 [12]
v
16
V
16
·X
17
·X
18
/[K
16
·(1 + X
19
/K
18
) + X
18
]V
16
= 9.5 K
16
= 1.46 × 10
5
[12]
v
17
V
17
·X
19
/[K
17
·(1 + X
20
/K
19
) + X
19
]V
17
= 0.3 K
17
= 160 [12]
v
18
V
18
·X
17
·X
19
/[K
18
·(1 + X
18
/K
16
) + X
19
]V
18
= 16 K
18
= 1.46 × 10
5
[12]
v
19
V
19
·X
20
/[K
19
·(1 + X
19
/K
17
) + X
20
]V
19
= 0.27 K
19
= 60 [12]
Theoretical Biology and Medical Modelling 2007, 4:50 />Page 5 of 14
(page number not for citation purposes)
between time steps, the chemical environment is being
updated, including EGF and glucose concentration as well
as oxygen tension (according to Eq. (5)). When the first
cell reaches the nutrient source the simulation run is ter-
minated.
Cellular Phenotype Decision
Four tumor cell phenotypes are considered in the model:
proliferation, migration, quiescence and death. Cell death
is triggered when the on site glucose concentration drops
below 8 mM [42]. A cell turns quiescent when the on site
glucose concentration is between 8 mM and 16 mM,
when it does not meet conditions for migration or prolif-
eration (see below), or when it cannot find an empty loca-
tion to migrate to or proliferate into.
The most important two phenotypic traits for spatio-tem-
poral expansion, i.e. migration and proliferation, are
decided by evaluating the dynamics of the following criti-
cal intracellular molecules. (1) PLC
γ
is known to be
involved in directing cell movement in response to EGF
[43-45]; PLC
γ
dynamics are accelerated during migration
Two-dimensional virtual micro-environmentFigure 2
Two-dimensional virtual micro-environment. Depicted are the 200 × 200 lattice (left) with the position of the nutrient
source, and the seed cells with assignment of the corner cell IDs (0, 6, 42, and 48).
6RXUFH
,QLWLDO&HOOV
0
1
)RUH[DPSOHLI0 DQG1
&HOO1R
0 &HOO1R
1 &HOO1R
01 &HOO1R
Table 3: Coefficients of distribution and diffusion of EGF, glucose and oxygen tension. Values are taken from the literature [72,73].
Coefficient Value Units Description
T
m
2.56 Nm Maximum concentration of EGF
G
a
17.0 mM Normal concentration of glucose
G
m
57.0 mM Maximum concentration of glucose
O
a
0.0017 DC Normal concentration of oxygen
O
m
0.0025 DC Maximum concentration of oxygen
D
EGF
6.7 × 10
-11
m
2
·s
-1
Diffusion coefficient of EGF
D
Glucose
5.18 × 10
-11
m
2
·s
-1
Diffusion coefficient of glucose
D
Oxygen
8.0 × 10
-9
m
2
·s
-1
Diffusion coefficient of oxygen
Theoretical Biology and Medical Modelling 2007, 4:50 />Page 6 of 14
(page number not for citation purposes)
in cancer cells [46]. Therefore, in our model, the rate of
change of PLC
γ
(ROC
PLC
) decides if a cell proceeds to
migration or not. That is, if ROC
PLC
exceeds a certain set
threshold, T
PLC
, the cell has the potential to migrate. (2)
Similarly, the rate of change of ERK (ROC
ERK
) decides if a
cell proceeds with proliferation. ERK has been found
experimentally to have a strong influence on cell prolifer-
ation [33,47,48], and transient activation of ERK with
EGF leads to cell replication [49,50]. If a cell decides to
migrate or proliferate, it will search for an appropriate
location to move to or for its offspring to reside in. Candi-
date locations are those grid points surrounding the cell.
Implementing a cell surface receptor-mediated chemotac-
tic evaluation, the most appropriate location is detected
by using a 'search-precision' mechanism [27] according
to:
T
ij
=
ψ
·L
ij
+ (1 -
ψ
)·
ε
ij
where T
ij
represents the perceived attractiveness of loca-
tion p(i, j), L
ij
represents the result of an evaluation func-
tion for location p(i, j) (see [27] for the definition of L
ij
),
and
ε
~ N(
μ
,
σ
2
) is an error term following a normal distri-
bution with mean
μ
and variance
σ
2
.
ψ
∈ [0,1] denotes the
search-precision parameter that for a given run is held
constant for all cells. Briefly, for a given cell at a certain
location, when
ψ
= 0 the cell performs a pure random
walk, whereas when
ψ
= 1 the cell always selects the loca-
tion with the highest glucose concentration. Based on pre-
vious results [27], we set
ψ
= 0.7 because this value tends
to lead to the highest average velocity of the tumor's spa-
tial expansion.
It is worth noting that even if ROC
PLC
or ROC
ERK
exceed
their corresponding thresholds, it does not necessarily
have to lead to cell migration or proliferation. Rather, if
nowhere else to go, the cell remains quiescent and contin-
ues to search for an empty location at the next time step.
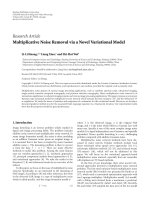
Any cell in the process of changing its phenotype will fall
into one of these four categories: (i) ROC
PLC
< T
PLC
and
ROC
ERK
< T
ERK
; (ii) ROC
PLC
> T
PLC
and ROC
ERK
< T
ERK
; (iii)
ROC
PLC
< T
PLC
and ROC
ERK
> T
ERK
; and (iv) ROC
PLC
> T
PLC
and ROC
ERK
> T
ERK
. Figure 3 lists these conditions and
their phenotypic consequences, respectively. Following
the first three cell decisions is straightforward; first, if a cell
experiences condition (i) no phenotypic change results as
both ROC
PLC
and ROC
ERK
remain below their correspond-
ing thresholds; however, if a cell faces condition (ii) the
cell migrates because of ROC
PLC
exceeding its threshold
while in the presence of (iii) the cell proliferates due to
ROC
ERK
exceeding its threshold. However, for (iv), and in
the absence of any specific experimental data, i.e. for the
case that both ROC
PLC
and ROC
ERK
exceed their corre-
sponding thresholds, we explored two hypotheses: 'rule A'
yielding migration advantage (i.e., the cell decides to
migrate) whereas 'rule B' resulting in a proliferation
advantage (i.e., the cell decides to proliferate). For sim-
plicity, decision rules for the first three conditions are
referred to 'general rules', while rules A and B are referred
to 'special rules' hereafter. In the following section, we will
describe the corresponding simulation results.
Results
Our algorithm was implemented in C/C++. A total of 49
seed cells were initially set up in the center of the lattice,
and these cells were arranged in a 7 × 7 square shape (i.e.,
M = 7 and N = 7, see Fig. 2 for the configuration of the seed
cells). We defined cell IDs from 0 to 48 (left to right, bottom
to top). To investigate cell expansion dynamics, we moni-
Cell phenotypic decision algorithmFigure 3
Cell phenotypic decision algorithm. See text for more details.
52&
3/&
7
3/&
52&
(5.
7
(5.
52&
3/&
!7
3/&
52&
(5.
7
(5.
52&
3/&
7
3/&
52&
(5.
!7
(5.
52&
3/&
!7
3/&
52&
(5.
!7
(5.
1RFKDQJH
0LJUDWLRQ
3UROLIHUDWLRQ
0LJUDWLRQ
3UROLIHUDWLRQ
5XOH$0LJUDWLRQ$GYDQWDJH
5XOH%3UROLIHUDWLRQ$GYDQWDJH
&HOO
&RQGLWLRQV
Theoretical Biology and Medical Modelling 2007, 4:50 />Page 7 of 14
(page number not for citation purposes)
tored all cells and recorded their molecular profiles at
every time step. We are particularly interested in the fol-
lowing four boundary cells: Cell No 0 (bottom-left corner,
farthest from the source), Cell No 6 (top-left corner), Cell
No 42 (bottom-right corner), and Cell No 48 (top-right cor-
ner, closest to the source). Through the distinct micro-
environmental conditions they face, these corner cells
exemplify the impact of location on single cell behavior,
while they however still grasp the nature of the entire sys-
tem. As described before, both rules A and B were tested
for each different simulation condition.
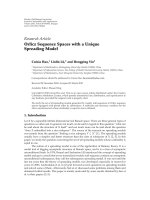
Multi-Cellular Dynamics
Figure 4 shows two simulation results for rules A and B,
respectively. The simulations were conducted with a
standard EGF concentration of 2.56 nM. Note that this
concentration is derived from the literature [51,52] and
has been rescaled to fit our model as a benchmark starting
point for further simulations. In the upper panel of Fig.
4(a) for rule A, tumor cells first display on site prolifera-
tion prior to exhibiting extensive migratory behavior
towards the nutrient source. However, for rule B (lower
panel), cells remain stationary proliferative throughout,
thereby increasing the tumor radius yet without substan-
tial mobility-driven spatial expansion. The run time for
the latter case (rule B) was considerably longer than for
rule A. Based on the criterion chosen for terminating the
run, i.e. the first cell reaching the nutrient source, this
result is somewhat expected since rule A favors migration
whereas rule B promotes proliferation. This is further sup-
ported by analysis of the evolution of the various pheno-
types and the change of [total] cell numbers (Fig. 4(b)).
While both rules generate all three cell phenotypes (pro-
liferation (dark blue), migration (red), and quiescence
(green)), rule A (left panel) indeed appears to result in a
cancer cell population that exhibits a larger migratory frac-
tion than the one emerging through rule B (right panel)
which, however, yields a larger portion of proliferative
cells (light blue). It is thus not surprising that for rule B, the
[total] cell population of the tumor system exceeds the
one achieved through rule A by a factor of 10.
Influence of Decision Rules on Phenotypic Changes
To better understand the significance of each rule for the
tumor system, we have investigated its influence on gen-
erating the intended phenotype. Figure 5 shows the
weight of rule A on migration (a), and that of rule B on
proliferation (b). (The results are taken from the two sim-
ulation runs reported in Fig. 4). In Fig. 5(a), migrations
derive from two sources: (1) general rule, i.e. [ROC
PLC
>
T
PLC
and ROC
ERK
< T
ERK
] and (2) rule A; proliferations
stem from one source only, i.e. if [ROC
PLC
< T
PLC
and
ROC
ERK
> T
ERK
]. Rule A plays a more dominant role in trig-
gering migrations than the general rule does, yet does not
contribute to increasing proliferations. Likewise, rule B
has influence on proliferation only (Fig. 5(b)) and it con-
tributes more to inducing proliferations than the corre-
sponding general rule does.
However, as documented in the linear least square fit-
tings, the rate at which rule A causes an increase in migra-
tion exceeds by far the one by which rule B induces an
increase in proliferation. This indicates that the influence
of rule A on increasing migrations is more substantial than
that of rule B on increasing proliferations. Being particu-
larly interested in gaining insights into spatially aggressive
tumors, we continue in the following with investigating
the implications of rule A on microscopic and molecular
level dynamics of the cancer system.
Phase-Transition at Molecular Level
To further investigate (for rule A) the relationship
between EGF concentration and phenotypic changes we
varied the extrinsic EGF concentration from the standard
value of 2.65 × 1.0 nM to 2.65 × 50.0 nM by an incremen-
tal increase of 0.1 nM in each simulation. As a result of the
model's underlying chemotactic search paradigm, expect-
edly a simulation under the condition of a higher extrinsic
EGF concentration finished faster than that with a lower
one. However, cells turn out not to exhibit completely
homogeneous behavior.
Specifically, we focus on Cell No 48, the cell closest to the
nutrient source, and report its corresponding molecular
changes in Fig. 6. One can see that as the standard EGF
concentration increases, the number of proliferations
(blue) decreases gradually up to a phase transition between
2.65 × 31.1 and 2.65 × 31.2 nM. That is, if the standard
EGF concentration is less than 2.65 × 31.1 nM, prolifera-
tion still occurs in this particular cell, but if the ligand con-
centration starts to exceed 2.65 × 31.2 nM, its proliferative
trait entirely disappears. In the presence of nutrient abun-
dance, a very minor increase in extrinsic EGF can appar-
ently abolish the expression of a phenotype. Even more
intriguing, although the subcellular concentration change
appears to be rather similar with regards to its patterns, on
a closer look, the peak maxima of the rate changes for
PLC
γ
and the turning point of the rate changes for ERK
occur at an earlier time point for increasing EGF concen-
trations. This finding suggests that in the presence of
excess ligand, the here implemented intracellular network
switches to a more efficient signal processing mode. We
note that for cell IDs 0, 6, and 42, no such phase transition
emerged (data not shown) hence further supporting that
this behavior is concentration dependent, and that geog-
raphy, i.e. a cell's position relative to nutrient abundance,
matters. Confirming the robustness of our finding for Cell
No 48 we note that this cell continued to experience a
phase transition when the coordinates of the center of the
initial 49 cells was set randomly within a square region
Theoretical Biology and Medical Modelling 2007, 4:50 />Page 8 of 14
(page number not for citation purposes)
where p(100,100) is the lower left corner and p(110,110)
is the upper right corner (5 runs, data not shown).
Discussion & Future Works
While using mathematical models to investigate the
behavior of signaling networks is hardly new, understand-
ing a complex biosystem, such as a tumor, by focusing on
the analysis of its molecular or cellular level separately or
exclusively is insufficient, particularly if it excludes the
interaction with the surrounding tissue. Recent analyses of
signaling pathways in mammalian systems have revealed
that highly connected sub-cellular networks generate sig-
nals in a context dependent manner [53]. That is, biolog-
ical processes take place in heterogeneous and highly
structured environments [54] and such extrinsic condi-
tions alone can induce the transformation of cells inde-
Multicellular tumor expansion dynamics (a)Figure 4
Multicellular tumor expansion dynamics. (a) Shows the multicellular patterns that emerge through rule A (upper panel)
and rule B (lower panel), respectively. (b) Describes the numeric evolution (y-axis) of each cell phenotype as well as of the
[total] cell population (light blue) over time (x-axis) for rule A (left panel) and rule B (right panel), respectively. Note: proliferative
tumor cells are labeled in dark blue, migratory cells in red, quiescent cells in green and dead cells in grey.
5XOH$
5XOH%
7LPHVWHS
D
E
7LPHVWHS
7LPHVW HS
QXPEHUV
SUROLIHUDWLRQ
PLJU DWLRQ
TXLHVFHQFH
GHDWK
WRWDOFHOOQXPEHUV
7LPHVW HS
QXPEHUV
SUROLIHUDWLRQ
PLJU DWLRQ
TXLHVFHQFH
GHDWK
WRWDOFHOOQXPEHUV
Theoretical Biology and Medical Modelling 2007, 4:50 />Page 9 of 14
(page number not for citation purposes)
pendent of genetic mutations as has been shown for the
case of melanoma [55]. Taken together, modeling of can-
cer systems requires the analysis and use of signaling path-
ways in a simulated cancer environment (context) across
different spatial-temporal scales.
Our group has been focusing on the development of such
multiscale models for studying highly malignant brain
tumors [27,29,30,56]. Here, on the basis of these previous
works, we presented a 2D multiscale agent-based model
to simulate NSCLC. Specifically, we monitored how,
dependent on microenvironmental stimuli, molecular
profiles dynamically change, and how they affect a single
NSCLC cell's phenotype and, eventually, the resulting
multicellular patterns.
Proceeding top-down in our analysis, we first evaluated the
multicellular readout of molecular 'decision' rules A and
B (versus general rules; Fig. 3). The patterns of a more sta-
tionary, concentrically growing cancer system (following
rule B) are quite different from the rapid, chemotactically-
guided, spatial expansion that can be seen in the tumor
regulated by rule A (Fig. 4(a)). Not surprisingly, the latter
also operates with many more migratory albeit overall less
Weight of decision rules on changing cell phenotypesFigure 5
Weight of decision rules on changing cell phenotypes. Influence on changing cell migration (left panel) and proliferation
(right panel) when following the corresponding rule (see Fig. 3). The dashed red line indicates rule A-mediated migrations in (a),
while the dashed blue line denotes rule B-mediated proliferations in (b). Fitting curves in solid black are calculated using a stand-
ard linear least squares method. Slopes of the fitting curves are 1.40 cells/step in (a) and 0.03 cells/step in (b), respectively.
Note: The drop of the dashed red line in the left panel of (a) is caused by the termination of the simulation when a cell reached
the source (in this case, no further computation on remaining cells will be performed).
7LPH VWHS
1XPEHUV
7LPH VWHS
1XPEHUV
7LPH VWHS
1XPEHUV
7LPH VWHS
1XPEHUV
D
/LQHDUGDWDILWWLQJFXUYH
5XOH$
*HQHUDOUXOH
/LQHDUGDWDILWWLQJFXUYH
5XOH%
*HQHUDOUXOH
E
Theoretical Biology and Medical Modelling 2007, 4:50 />Page 10 of 14
(page number not for citation purposes)
[total] cells (Fig. 4(b)). Furthermore, examining in more
detail the influence of the two distinct rules on their
respective phenotypic yield, we found that the impact of
rule A on increasing cell migration is more substantial
than rule B's influence on furthering proliferation (Fig. 5).
This finding suggests that the migratory rule A can operate
the cancer system through incrementally smaller changes
(while the simulation system is more robust for rule B).
Such sensitivity to migratory cues corresponds well with
experimental data on the response of human breast cancer
cells, which showed that a spatially successful expansive
system reacts rather quickly to even miniscule changes in
chemotactic directionality [57,58].
Continuing therefore with rule A, our effort was then
geared to gain insights into tumor expansion dynamics
not only with regards to extrinsic stimuli but also to cell
geography, i.e. a cell's location relative to the replenished
nutrient source. Most interestingly, we found a phase tran-
sition in the cancer cell closest to the nutrient source (i.e.
Cell No 48, while none of the other three corner cells
showed similar behavior). Specifically, for a tumor cell at
this location, i.e., facing nutrient abundance, proliferation
is completely abolished once the extrinsic EGF concentra-
tion exceeds a certain level. While this at first may seems
rather unexpected, this finding however only confirms the
experimentally sound notion that EGF stimulates the spa-
tial expansion of a cancer system [5-8]. Moreover, with
increasing EGF concentrations, the maxima of ROC
PLC
(Fig. 6) gradually occur earlier which seems to indicate
that, under these conditions, the downstream signal is
processed faster. Interestingly, such a 'no proliferation,
just migration' behavior in the presence of chemo-attract-
ant has indeed already been reported in several in vitro
studies using a variety of cancer cell lines [59,60] as well
as in non-cancerous human cells [61]. (While admittedly,
for the reasons stated, rule B did not receive similar atten-
tion in our analysis), we nonetheless argue that, on the
basis of our results and the experimental reports they
seem to correspond with, rule A and thus a migratory deci-
sion prompted by a [ROC
PLC
> T
PLC
and ROC
ERK
> T
ERK
]
condition is a reasonable outcome for the signaling proc-
ess taking place in NSCLC also in vitro and in vivo.
Changes at the molecular level for Cell No 48 with an increasing extrinsic EGF concentration (rule A)Figure 6
Changes at the molecular level for Cell No 48 with an increasing extrinsic EGF concentration (rule A). Four
simulation runs are depicted where (from left to right) the EGF concentration increases from 2.65 × 1.0 to 2.65 × 31.1, 2.65 ×
31.2, and finally, to 2.65 × 50.0 nM. (From top to bottom) plotted are the absolute change of PLC
γ
, rate of change of PLC
γ
, and
rate of change of ERK. Note that the number of proliferations is decreasing gradually and finally disappears at a phase transition
between the EGF concentrations of 2.65 × 31.1 and 2.65 × 31.2 nM. (For phenotype labeling see Fig. 4).
7LPHVWHS 7LPHVWHS 7LPHVWHS 7LPHVWHS
[
52&RI(5.Q0V
52&RI3/&Ȗ Q0V
&KDQJHRI3/&Ȗ Q0
Theoretical Biology and Medical Modelling 2007, 4:50 />Page 11 of 14
(page number not for citation purposes)
However, moving the model closer to reality will require
a multitude of adjustments, one of which is its ability to
account for up- or down-regulation in key molecules as a
result of tumorigenesis. As a first step, and since experi-
mental data on over-expression of EGFR in a variety of
cancer types, including NSCLC, are ample [62-65] we
have begun to simulate the impact of an increasing
number of receptors on the cancer system (Fig. 7; simula-
tions conducted with an EGFR concentration of 800 nM
(per system)). Comparing this preliminary data with
those reported in Fig. 6 (simulations conducted with an
EGFR concentration of 80 nM (per system)), we find that
an EGFR-overexpressing NSCLC tumor seems to operate
with even more migration and does so earlier on. The result
is a spatially even more aggressive cancer system, which
seems to correspond well with the aforementioned exper-
imental studies. And, intriguingly, while the phase transi-
tion itself is preserved, it however occurs already at a
smaller EGF concentration, hence indicating that the
increase in receptor density leads to an amplification of the
downstream signal, which again corresponds well with
experimental results in examining signaling activities gen-
Changes at the molecular level for Cell No 48 with an increasing extrinsic EGF concentration (rule A), at an EGFR concentra-tion of 800 nMFigure 7
Changes at the molecular level for Cell No 48 with an increasing extrinsic EGF concentration (rule A), at an
EGFR concentration of 800 nM. Three simulation runs are depicted where (from left to right) the EGF concentration
increases from 2.65 × 1.0 to 2.65 × 5.9 and 2.65 × 6.0 nM. (From top to bottom) plotted are the absolute change of PLC
γ
, rate
of change of PLC
γ
, and rate of change of ERK. Note that a phase transition emerges again between the EGF concentrations of
2.65 × 5.9 and 2.65 × 6.0 nM, hence at a lower concentration compared to the one depicted in Fig. 6 (EGFR concentration of 80
nM). In the two simulations around the phase transition, the maximum rates of change for both PLC
γ
and ERK (i.e., ROC
PLC
and ROC
ERK
at 2.65 × 5.9 and at 2.65 × 6.0 nM) are lower compared with those in Fig. 6 (i.e., ROC
PLC
and ROC
ERK
at 2.65 ×
31.1 and at 2.65 × 31.2 nM). (For phenotype labeling see Fig. 4).
7LPHVWHS 7LPHVWHS 7LPHVWHS
52&RI(5.Q0V
52&RI3/&Ȗ Q0V
&KDQJHRI3/&Ȗ Q0
Theoretical Biology and Medical Modelling 2007, 4:50 />Page 12 of 14
(page number not for citation purposes)
erated by different EGFR family members [66]. Taken
together, while preliminary, this finding demonstrates
applicability and confirms flexibility of this multiscale
platform, hence warrants its further expansion.
There are a number of research tracks that can and should
be pursued in future works. First, it will be intriguing to
see if, in the presence of a non-replenished nutrient source,
the proliferative phenotype eventually can be recovered
once extrinsic ligand concentrations fall beyond the
phase-transition threshold. More generally, while most of
the pathway's parameters, including rate constants and
initial component concentrations were obtained from the
experimental literature, this data naturally originated
from a variety of often stationary experimental settings
and different cell types. It therefore represents a less desir-
able and reliable input than time series data that come
from one experimental setting only. Also, some parame-
ters had to be estimated, much like in other well-estab-
lished pathway models [11,12]. Taken together, future
works will have to include not only proper experimental
verification of the estimated parameters and evaluation of
the simulation results but also, on the in silico side, tech-
niques such as sensitivity analysis to help determine the
effects of parameter uncertainties on model outcome [67]
and to identify control points for experiment design [68].
While a pathway model cannot be a biological representa-
tion in every detail [38] we plan on adding, in incremental
steps, other pathways of relevance for NSCLC such as e.g.
PI3K/PTEN/AKT [69]. Moreover, simulating a more heter-
ogeneous biochemical environment and implementing
both cell-cell and cell-matrix interactions [70] are planned
steps at the cellular level that should help representing the
cancer system of interest in more detail.
Regardless, we believe that the current model already pro-
vides useful insights into NSCLC from a systematic view
in terms of quantitatively understanding the relationship
between extrinsic chemotactic stimuli, the underlying
properties of signaling networks, and the cellular biologi-
cal responses they trigger. Our results yield several experi-
mentally testable hypotheses and thus further support the
use of multiscale models in interdisciplinary cancer
research. To our knowledge, this presents the first multi-
scale computational model of Non-Small Cell Lung Can-
cer and is thus potentially a significant first step towards
realizing a fully validated in silico model for this devastat-
ing disease.
Abbreviations
EGF: Epidermal growth factor;
EGFR: EGF receptor;
ERK: Extracellular signal-regulated kinase;
MAPK: Mitogen-activated protein kinase;
MEK: MAPK kinase;
NSCLC: Non-small cell lung cancer;
PLC
γ
: Phospholipase C
γ
;
PKC: Protein kinase C;
TGF
α
: Transforming growth factor
α
.
Competing interests
The author(s) declare that they have no competing inter-
ests.
Authors' contributions
ZW developed the NSCLC model (algorithm and code),
analyzed its simulation results and drafted the manu-
script. LZ assisted in developing the algorithm, while JS
supported data analysis and preparation of manuscript.
TSD developed the model's underlying concept, led its
design, development and analysis, and finalized the man-
uscript. All authors read and approved the final manu-
script.
Acknowledgements
This work has been supported in part by NIH grant CA 113004 (The
Center for the Development of a Virtual Tumor, CViT [71]) and by the
Harvard-MIT (HST) Athinoula A. Martinos Center for Biomedical Imaging
and the Department of Radiology at Massachusetts General Hospital. We
would like to acknowledge helpful discussions with Drs. Raju Kucherlapati,
Victoria Joshi and David Sarracino from the Harvard-Partners Center for
Genetics and Genomics (HPCGG).
References
1. Sharma SV, Bell DW, Settleman J, Haber DA: Epidermal growth
factor receptor mutations in lung cancer. Nat Rev Cancer 2007,
7:169-181.
2. Hackel PO, Zwick E, Prenzel N, Ullrich A: Epidermal growth fac-
tor receptors: critical mediators of multiple receptor path-
ways. Curr Opin Cell Biol 1999, 11:184-189.
3. Hirsch FR, Varella-Garcia M, Bunn PA Jr, Di Maria MV, Veve R,
Bremmes RM, Baron AE, Zeng C, Franklin WA: Epidermal growth
factor receptor in non-small-cell lung carcinomas: correla-
tion between gene copy number and protein expression and
impact on prognosis. J Clin Oncol 2003, 21:3798-3807.
4. Ciardiello F, De Vita F, Orditura M, Tortora G: The role of EGFR
inhibitors in nonsmall cell lung cancer. Curr Opin Oncol 2004,
16:130-135.
5. Putnam EA, Yen N, Gallick GE, Steck PA, Fang K, Akpakip B, Gazdar
AF, Roth JA: Autocrine growth stimulation by transforming
growth factor-alpha in human non-small cell lung cancer.
Surg Oncol 1992, 1:49-60.
6. Rusch V, Baselga J, Cordon-Cardo C, Orazem J, Zaman M, Hoda S,
McIntosh J, Kurie J, Dmitrovsky E: Differential expression of the
epidermal growth factor receptor and its ligands in primary
non-small cell lung cancers and adjacent benign lung. Cancer
Res 1993, 53:2379-2385.
7. Price JT, Wilson HM, Haites NE: Epidermal growth factor (EGF)
increases the in vitro invasion, motility and adhesion interac-
tions of the primary renal carcinoma cell line, A704. Eur J Can-
cer 1996, 32A:1977-1982.
Theoretical Biology and Medical Modelling 2007, 4:50 />Page 13 of 14
(page number not for citation purposes)
8. Xue C, Wyckoff J, Liang F, Sidani M, Violini S, Tsai KL, Zhang ZY, Sahai
E, Condeelis J, Segall JE: Epidermal growth factor receptor over-
expression results in increased tumor cell motility in vivo
coordinately with enhanced intravasation and metastasis.
Cancer Res 2006, 66:192-197.
9. Christofori G: New signals from the invasive front. Nature 2006,
441:444-450.
10. Silvestri GA, Rivera MP: Targeted therapy for the treatment of
advanced non-small cell lung cancer: a review of the epider-
mal growth factor receptor antagonists. Chest 2005,
128:3975-3984.
11. Kholodenko BN, Demin OV, Moehren G, Hoek JB: Quantification
of short term signaling by the epidermal growth factor
receptor. J Biol Chem 1999, 274:30169-30181.
12. Schoeberl B, Eichler-Jonsson C, Gilles ED, Muller G: Computa-
tional modeling of the dynamics of the MAP kinase cascade
activated by surface and internalized EGF receptors. Nat Bio-
technol 2002, 20:370-375.
13. Brightman FA, Fell DA: Differential feedback regulation of the
MAPK cascade underlies the quantitative differences in EGF
and NGF signalling in PC12 cells. FEBS Lett 2000, 482:169-174.
14. Hatakeyama M, Kimura S, Naka T, Kawasaki T, Yumoto N, Ichikawa
M, Kim JH, Saito K, Saeki M, Shirouzu M, Yokoyama S, Konagaya A: A
computational model on the modulation of mitogen-acti-
vated protein kinase (MAPK) and Akt pathways in heregulin-
induced ErbB signalling. Biochem J 2003, 373:451-463.
15. Resat H, Ewald JA, Dixon DA, Wiley HS: An integrated model of
epidermal growth factor receptor trafficking and signal
transduction. Biophys J 2003, 85:730-743.
16. Sasagawa S, Ozaki Y, Fujita K, Kuroda S: Prediction and validation
of the distinct dynamics of transient and sustained ERK acti-
vation. Nat Cell Biol 2005, 7:365-373.
17. Hendriks BS, Griffiths GJ, Benson R, Kenyon D, Lazzara M, Swinton J,
Beck S, Hickinson M, Beusmans JM, Lauffenburger D, de Graaf D:
Decreased internalisation of erbB1 mutants in lung cancer is
linked with a mechanism conferring sensitivity to gefitinib.
Syst Biol (Stevenage) 2006, 153:457-466.
18. Khalil IG, Hill C: Systems biology for cancer. Curr Opin Oncol
2005, 17:44-48.
19. Spencer SL, Gerety RA, Pienta KJ, Forrest S: Modeling somatic
evolution in tumorigenesis. PLoS Comput Biol 2006, 2:e108.
20. Ma'ayan A, Blitzer RD, Iyengar R: Toward predictive models of
mammalian cells. Annu Rev Biophys Biomol Struct 2005, 34:319-349.
21. Chaplain MA, McDougall SR, Anderson AR: Mathematical mode-
ling of tumor-induced angiogenesis. Annu Rev Biomed Eng 2006,
8:233-257.
22. Wang W, Goswami S, Sahai E, Wyckoff JB, Segall JE, Condeelis JS:
Tumor cells caught in the act of invading: their strategy for
enhanced cell motility. Trends Cell Biol 2005, 15:138-145.
23. Walker D, Wood S, Southgate J, Holcombe M, Smallwood R: An
integrated agent-mathematical model of the effect of inter-
cellular signalling via the epidermal growth factor receptor
on cell proliferation. J Theor Biol 2006, 242:774-789.
24. Monine MI, Berezhkovskii AM, Joslin EJ, Wiley HS, Lauffenburger DA,
Shvartsman SY: Ligand accumulation in autocrine cell cultures.
Biophys J 2005, 88:2384-2390.
25. Maly IV, Wiley HS, Lauffenburger DA: Self-organization of polar-
ized cell signaling via autocrine circuits: computational
model analysis. Biophys J 2004, 86:10-22.
26. Mansury Y, Kimura M, Lobo J, Deisboeck TS: Emerging patterns in
tumor systems: simulating the dynamics of multicellular
clusters with an agent-based spatial agglomeration model. J
Theor Biol 2002, 219:343-370.
27. Mansury Y, Deisboeck TS: The impact of "search precision" in
an agent-based tumor model. J Theor Biol 2003, 224:325-337.
28. Athale C, Mansury Y, Deisboeck TS: Simulating the impact of a
molecular 'decision-process' on cellular phenotype and mul-
ticellular patterns in brain tumors. J Theor Biol 2005,
233:469-481.
29. Athale CA, Deisboeck TS: The effects of EGF-receptor density
on multiscale tumor growth patterns. J Theor Biol 2006,
238:771-779.
30. Zhang L, Athale CA, Deisboeck TS: Development of a three-
dimensional multiscale agent-based tumor model: simulat-
ing gene-protein interaction profiles, cell phenotypes and
multicellular patterns in brain cancer. J Theor Biol 2007,
244:96-107.
31. Mai H, May WS, Gao F, Jin Z, Deng X: A functional role for nico-
tine in Bcl2 phosphorylation and suppression of apoptosis. J
Biol Chem 2003, 278:1886-1891.
32. Lahn M, Su C, Li S, Chedid M, Hanna KR, Graff JR, Sandusky GE, Ma
D, Niyikiza C, Sundell KL, John WJ, Giordano TJ, Beer DG, Paterson
BM, Su EW, Bumol TF: Expression levels of protein kinase C-
alpha in non-small-cell lung cancer. Clin Lung Cancer 2004,
6:184-189.
33. Brognard J, Dennis PA: Variable apoptotic response of NSCLC
cells to inhibition of the MEK/ERK pathway by small mole-
cules or dominant negative mutants. Cell Death Differ 2002,
9:893-904.
34. Raben D, Helfrich B, Bunn PA Jr: Targeted therapies for non-
small-cell lung cancer: biology, rationale, and preclinical
results from a radiation oncology perspective. Int J Radiat Oncol
Biol Phys 2004, 59:27-38.
35. Hemstrom TH, Sandstrom M, Zhivotovsky B: Inhibitors of the PI3-
kinase/Akt pathway induce mitotic catastrophe in non-small
cell lung cancer cells. Int J Cancer 2006, 119:1028-1038.
36. Adjei AA, Hidalgo M: Intracellular signal transduction pathway
proteins as targets for cancer therapy. J Clin Oncol 2005,
23:5386-5403.
37. Zochbauer-Muller S, Gazdar AF, Minna JD: Molecular pathogene-
sis of lung cancer. Annu Rev Physiol 2002, 64:681-708.
38. Aldridge BB, Burke JM, Lauffenburger DA, Sorger PK: Physico-
chemical modelling of cell signalling pathways. Nat Cell Biol
2006, 8:1195-1203.
39. Bhalla US, Iyengar R: Emergent properties of networks of bio-
logical signaling pathways.
Science 1999, 283:381-387.
40. Rusch V, Klimstra D, Venkatraman E, Pisters PW, Langenfeld J,
Dmitrovsky E: Overexpression of the epidermal growth factor
receptor and its ligand transforming growth factor alpha is
frequent in resectable non-small cell lung cancer but does
not predict tumor progression. Clin Cancer Res 1997, 3:515-522.
41. Shvartsman SY, Wiley HS, Deen WM, Lauffenburger DA: Spatial
range of autocrine signaling: modeling and computational
analysis. Biophys J 2001, 81:1854-1867.
42. Freyer JP, Sutherland RM: Regulation of growth saturation and
development of necrosis in EMT6/Ro multicellular spheroids
by the glucose and oxygen supply. Cancer Res 1986,
46:3504-3512.
43. Mouneimne G, Soon L, DesMarais V, Sidani M, Song X, Yip SC, Ghosh
M, Eddy R, Backer JM, Condeelis J: Phospholipase C and cofilin
are required for carcinoma cell directionality in response to
EGF stimulation. J Cell Biol 2004, 166:697-708.
44. Piccolo E, Innominato PF, Mariggio MA, Maffucci T, Iacobelli S, Falasca
M: The mechanism involved in the regulation of phospholi-
pase Cgamma1 activity in cell migration. Oncogene 2002,
21:6520-6529.
45. Friedl P, Wolf K: Tumour-cell invasion and migration: diversity
and escape mechanisms. Nat Rev Cancer 2003, 3:362-374.
46. Dittmar T, Husemann A, Schewe Y, Nofer JR, Niggemann B, Zanker
KS, Brandt BH: Induction of cancer cell migration by epider-
mal growth factor is initiated by specific phosphorylation of
tyrosine 1248 of c-erbB-2 receptor via EGFR. Faseb J 2002,
16:1823-1825.
47. Li M, Lee TW, Yim AP, Mok TS, Chen GG: Apoptosis induced by
troglitazone is both peroxisome proliferator-activated
receptor-gamma- and ERK-dependent in human non-small
lung cancer cells. J Cell Physiol 2006, 209:428-438.
48. Vicent S, Garayoa M, Lopez-Picazo JM, Lozano MD, Toledo G, Thun-
nissen FB, Manzano RG, Montuenga LM: Mitogen-activated pro-
tein kinase phosphatase-1 is overexpressed in non-small cell
lung cancer and is an independent predictor of outcome in
patients. Clin Cancer Res 2004, 10:3639-3649.
49. Marshall CJ: Specificity of receptor tyrosine kinase signaling:
transient versus sustained extracellular signal-regulated
kinase activation. Cell 1995, 80:179-185.
50. Santos SD, Verveer PJ, Bastiaens PI: Growth factor-induced
MAPK network topology shapes Erk response determining
PC-12 cell fate. Nat Cell Biol 2007, 9:324-330.
51. Fang K: An enhanced and sensitive autocrine stimulation by
transforming growth factor-alpha is acquired in the brain
Publish with BioMed Central and every
scientist can read your work free of charge
"BioMed Central will be the most significant development for
disseminating the results of biomedical research in our lifetime."
Sir Paul Nurse, Cancer Research UK
Your research papers will be:
available free of charge to the entire biomedical community
peer reviewed and published immediately upon acceptance
cited in PubMed and archived on PubMed Central
yours — you keep the copyright
Submit your manuscript here:
/>BioMedcentral
Theoretical Biology and Medical Modelling 2007, 4:50 />Page 14 of 14
(page number not for citation purposes)
metastatic variant of a human non-small-cell lung cancer cell
line. Br J Cancer 1996, 74:1776-1782.
52. Kurachi H, Morishige K, Amemiya K, Adachi H, Hirota K, Miyake A,
Tanizawa O: Importance of transforming growth factor alpha/
epidermal growth factor receptor autocrine growth mecha-
nism in an ovarian cancer cell line in vivo. Cancer Res 1991,
51:5956-5959.
53. Jordan JD, Landau EM, Iyengar R: Signaling networks: the origins
of cellular multitasking. Cell 2000, 103:193-200.
54. Di Ventura B, Lemerle C, Michalodimitrakis K, Serrano L: From in
vivo to in silico biology and back. Nature 2006, 443:527-533.
55. Postovit LM, Seftor EA, Seftor RE, Hendrix MJ: Influence of the
microenvironment on melanoma cell fate determination
and phenotype. Cancer Res 2006, 66:7833-7836.
56. Deisboeck TS, Berens ME, Kansal AR, Torquato S, Stemmer-Rach-
amimov AO, Chiocca EA: Pattern of self-organization in
tumour systems: complex growth dynamics in a novel brain
tumour spheroid model. Cell Prolif 2001, 34:115-134.
57. Segall JE, Tyerech S, Boselli L, Masseling S, Helft J, Chan A, Jones J,
Condeelis J: EGF stimulates lamellipod extension in meta-
static mammary adenocarcinoma cells by an actin-depend-
ent mechanism. Clin Exp Metastasis 1996, 14:61-72.
58. Wang SJ, Saadi W, Lin F, Minh-Canh Nguyen C, Li Jeon N: Differen-
tial effects of EGF gradient profiles on MDA-MB-231 breast
cancer cell chemotaxis. Exp Cell Res 2004, 300:180-189.
59. Kim S, Li Q, Dang CV, Lee LA: Induction of ribosomal genes and
hepatocyte hypertrophy by adenovirus-mediated expression
of c-Myc in vivo. Proc Natl Acad Sci USA 2000, 97:11198-11202.
60. Wroblewski LE, Noble PJ, Pagliocca A, Pritchard DM, Hart CA,
Campbell F, Dodson AR, Dockray GJ, Varro A: Stimulation of
MMP-7 (matrilysin) by Helicobacter pylori in human gastric
epithelial cells: role in epithelial cell migration. J Cell Sci
2003,
116:3017-3026.
61. Wang L, Zeng H, Wang P, Soker S, Mukhopadhyay D: Neuropilin-1-
mediated vascular permeability factor/vascular endothelial
growth factor-dependent endothelial cell migration. J Biol
Chem 2003, 278:48848-48860.
62. Creighton CJ, Hilger AM, Murthy S, Rae JM, Chinnaiyan AM, El-Ashry
D: Activation of mitogen-activated protein kinase in estro-
gen receptor alpha-positive breast cancer cells in vitro
induces an in vivo molecular phenotype of estrogen receptor
alpha-negative human breast tumors. Cancer Res 2006,
66:3903-3911.
63. El Sheikh SS, Domin J, Abel P, Stamp G, Lalani el N: Phosphoryla-
tion of both EGFR and ErbB2 is a reliable predictor of pros-
tate cancer cell proliferation in response to EGF. Neoplasia
2004, 6:846-853.
64. Onn A, Choe DH, Herbst RS, Correa AM, Munden RF, Truong MT,
Vaporciyan AA, Isobe T, Gilcrease MZ, Marom EM: Tumor cavita-
tion in stage I non-small cell lung cancer: epidermal growth
factor receptor expression and prediction of poor outcome.
Radiology 2005, 237:342-347.
65. Raspollini MR, Castiglione F, Garbini F, Villanucci A, Amunni G, Baroni
G, Boddi V, Taddei GL: Correlation of epidermal growth factor
receptor expression with tumor microdensity vessels and
with vascular endothelial growth factor expression in ovar-
ian carcinoma. Int J Surg Pathol 2005, 13:135-142.
66. Hendriks BS, Orr G, Wells A, Wiley HS, Lauffenburger DA: Parsing
ERK activation reveals quantitatively equivalent contribu-
tions from epidermal growth factor receptor and HER2 in
human mammary epithelial cells. J Biol Chem 2005,
280:6157-6169.
67. El-Samad H, Kurata H, Doyle JC, Gross CA, Khammash M: Surviving
heat shock: control strategies for robustness and perform-
ance. Proc Natl Acad Sci USA 2005, 102:2736-2741.
68. Bentele M, Lavrik I, Ulrich M, Stosser S, Heermann DW, Kalthoff H,
Krammer PH, Eils R: Mathematical modeling reveals threshold
mechanism in CD95-induced apoptosis. J Cell Biol 2004,
166:839-851.
69. Vivanco I, Sawyers CL: The phosphatidylinositol 3-Kinase AKT
pathway in human cancer. Nat Rev Cancer 2002, 2:489-501.
70. Griffith LG, Swartz MA: Capturing complex 3D tissue physiol-
ogy in vitro. Nat Rev Mol Cell Biol 2006, 7:211-224.
71. The Center for the Development of a Virtual Tumor, CViT
[
]
72. Moskal TL, Huang S, Ellis LM, Fritsche HA Jr, Chakrabarty S: Serum
levels of transforming growth factor alpha in gastrointestinal
cancer patients. Cancer Epidemiol Biomarkers Prev 1995, 4:127-131.
73. Thorne RG, Hrabetova S, Nicholson C: Diffusion of epidermal
growth factor in rat brain extracellular space measured by
integrative optical imaging. J Neurophysiol 2004, 92:3471-3481.