Mechanical properties of polymers and composites-Nielsen Episode 2 pot
Bạn đang xem bản rút gọn của tài liệu. Xem và tải ngay bản đầy đủ của tài liệu tại đây (651.97 KB, 10 trang )
Mechanical Tests and Polymer Transitions 3
II. MECHANICAL TESTS
There are a bewildering number of mechanical tests and testing instru-
m
ents. Most of these tests are very specialized and have not been officially
recognized as standardized tests. Some of these tests, however, have been
standardized and are described in the publications of the American Society
for Testing and Materials (1). Many of the important tests for plastics are
given as ASTM standards in a series of volumes. The important volumes
(parts) covering polymeric materials are listed in Table 1. Although many
tests have been standardized, it must be recognized that a standardized
test may be no better than one that is not considered a standard. One
objective of a standardized test is to bring about simplicity and uniformity
to testing, and such tests are not necessarily the best tor generating the
most basic information or the special type of information required by a
research problem. The tests may not even correlate with practical use tests
in some cases.
Besides the ASTM standard tests, a number of general reference books
have been published on testing and on the mechanical properties of poly-
mers and viscoelastic materials (2-7). Unfortunately, a great variety of
units are used in reporting values of mechanical tests. Stresses, moduli of
elasticity, and other properties are given in such units as MK.S (SI), cgs,
and English units. A table of conversion factors is given in Appendix II.
A. Creep Tests
Creep tests give extremely important practical information and at the same
time give useful data on those interested in the theory of the mechanical
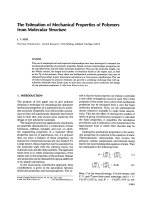
properties of materials. As illustrated in Figure 1, in creep tests one mea-
Table 1 ASTM Standards
Part No.
Materials
covered
15
Paper, packaging
16
Structural sandwich constructions, wood, adhesives
20
Paint: Materials specifications and tests
21
Paint: Tests for formulated materials and applied coatings
24
Textiles: Yarns and fabrics
25
Textiles: Fibers
26
Plastics: Specifications
27
Plastics: Methods of testing
28
Rubbers
29
Electrical insulating materials
4 Chapter 1
CREEP
STRESS
RELAXATION
STRESS-
STRAIN
DYNAMIC
MECHANICAL
Figure 1 Schematic diagrams of various types of tensile tests F, force; e strain or
elongation.
sures over a period of time the deformation brought about by a constant
load or force, or for a true measure of the response, a constant stress.
Creep tests measure the change in length of a specimen by a constant
tensile force or stress, but creep tests in shear, torsion, or compression are
also made. If the material is very stiff and brittle, creep tests often are
made in flexure but in such cases the stress is not constant throughout the
thickness of the .specimen even though the applied load is constant. Figure
2 illustrates the various types of creep tests In a creep test the deformation
increase with lime. If the strain is divided by the applied stress, one obtains a
quantity known as the compliance. The compliance is a time-dependent
reciprocal modulus, and it will be denoted by the symbol J for shear com-
pliance and D for tensile compliance (8).
Mechanical Tests and Polymer Transitions 5
TENSION
CO,PRESSI
ON
Figure 2 Types of creep tests,
If the load is removed from a creep .specimen after some lime, there is a
tendency for the specimen to return to its original length or shape. A
recovery curve is. thus obtained if the deformation is plotted as a function
of time after removal of the load,
B. Stress-Relaxation Tests
fa stress-relaxation tests, the specimen is quickly deformed a given amount,
and the stress required to hold the deformation constant is measured as a
function of time. Such a test is shown schematically in Figure 1. If the
stress is divided by the constant strain, a modulus that decreases with time
is obtained. Stress-relaxation experiments are very important for a theo-
retical understanding of viscoelastic materials. With experimentalists, how-
ever, such tests have not been as popular as creep tests. There are probably
at least two reasons for this: (1) Stress-relaxation experiments, especially
on rigid materials, are more difficult to make than creep tests; and (2)
creep costs are generally more useful to engineers and designers.
S
HEAR TORSION
6 Chapter 1
C. Stress-Strain Tests
Jn stress-strain tests the buildup of force (or stress) is measured as the
specimen is being deformed at a constant rate. This is illustrated in Figure
I. Occasionally, stress-strain tests are modified to measure the deformation
of a specimen as the force is applied at a constant rate, and such tests are
b
ecoming commonplace with the advent of commercially available load-
controlled test machines. Stress-strain tests have traditionally been the most
popular and universally used of alt mechanical tests and are described by
ASTM standard Vests such as D638, D882, and D412. These tests can be
more difficult to interpret than many other tests because the stress can
become nonhomogeneous (i.e., it varies from region to region in the speci-
men as in cold-drawing or necking and in crazing). In addition, several
different processes can come into play (e.g., spherulite and/or lamella
breakup in crystalline polymers in addition to amorphous chain segment
reorientation). Also, since a polymer's properties arc time dependent, the
shape of t h e observed curve will depend on the strain rate and temperature.
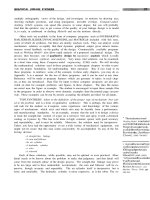
Figure 3 illustrates the great variation in stress-strain behavior of polymers
as measured at a constant rate of strain. The scales on these graphs
STRAIN (%)
STRAIN {%)
A B
c
STRAIN (%)
Figure 3 General types of stress-strain curves.
Mechanical Tests and Polymer Transitions ¥
are not exact but arc intended to give an order-of-magnitude indication of
the values encountered. The first graph (A) is for hard, brittle materials-
The second graph (B) is typical of hard, ductile polymers. The top curve
in the ductile polymer graph is for a material that shows uniform extension.
The lower curve in this graph has a yield point and is typical of a material
that cold-draws with necking down of the cross section in a limited area
of the specimen. Curves of the third graph (C) arc typical of elastomeric
materials.
Figure 4 helps illustrate the terminology used for stress-strain testing.
The slope of the initial straight-line portion of the curve is the elastic
modulus of the material, In a tensile test this modulus is Young's modulus,
The maximum in the curve denotes the stress at yield a
v
and the elongation
at yield €
v
. The end of the curve denotes the failure of the material, which
is characterized by the tensile strength a and the ultimate strain or elon
gation to break . These values are determined from a stress-strain curve
while the actual experimental values are generally reported as load-
deformation curves. Thus (he experimental curves require a
transformation of scales to obtain the desired stress-strain curves. This is
accomplished by the following definitions. For tensile tests:
If the cross-sectional area is that of the original undeformed specimen, this
is the engineering stress. If the area is continuously monitored or known
Figure 4 Stress-strain notation.
8 Chapter 1
d
uring the test, this is the true stress For large strains (i.e. Figure3.B and C)
there is a significant difference.
The strain EC can be defined in several ways, as given in Table 2, but for
engineering (and most theoretical) purposes, the strain for rigid materials
is defined as
T
he original length 6f the specimen Is L0 and its stretched length is L. At
very small deformations, all the strain definitions of Table 2 are equivalent,
For shear tests (see Figure 2)
for shear of a rod the strains are not uniform,, but for small angular
displacements .under a torque AT, the maximum stress and Strain occur
Table 2 Definitions of Tensile Strain
Definition . Name
Cauchy (engineering)
kinetic theory of rubberlike
elasticity
Kirchhoff
Murnaghan
seth (n is Variable)
Mechanical Tests and Polymer Transitions 9
a
t the surface and
are given by
shear stress (maximum)
shear strain (maximum)
if Hooke's law holds, the elastic moduli are defined by the
equations
(tensile tests)
.(6)
(shear tests)
(7)
where E is the Young's modulus and G is the shear modulus.
Tensile stress-strain tests give another elastic constant, called Poisson's
ratio, v. Poisson's ratio is defined for very small elongations as the decrease
in width of the specimen per unit initial width divided by the increase in.
length per unit initial length on the application of a tensile load::
In this equation e is the longitudinal strain and e
r
is the strain in the width
(transverse) direction or the direction perpendicular to the applied force
:
It can be shown that when Poisson's ratio is 0.50, the volume of the speci-
men remains constant while being stretched. This condition of constant
volume holds for liquids and ideal rubbers. In general, there is an increase
in volume, which is given by
where AV is the increase in the initial volume V
t>
brought about by straining
the specimen. Note that v is therefore not strictly a constant. For strains
beyond infinitesimal, a more appropriate definition is (9)
Moreover, for deformations other than simple tension the apparent Pojs-
son's ratio -t
r
/€ is a function of the type of deformation.
Poison's ratio is used by engineer's in place of the more fundamental quality desired, the bulk
modulus. The latter is in fact determined by r for linearly elastic systems—h«ncc the widespread use
of v engineering equation for large deformations, however, where the Strain is not proportional to
the stress, a single value of the hulk modulus may still suffice even when the value of y is
not- constant,
10 Chapter 1
D, Dynamic Mechanical Tests
A fourth type of test is known as a dynamic mechanical test. Dynamic
mechanical tests measure the response of a material to a sinusoidal or other
periodic stress. Since the stress and strain are generally not in phase, two
quantities can be determined: a modulus and a phase angle or a damping
term. There arc many types of dynamic mechanical test instruments. One
type is illustrated schematically in Figure I. The general type of dynamic
mechanical instruments are free vibration, resonance forced vibration, non-
resonance forced vibration, and wave or pulse propagation instruments
(3.4). Although any one instrument has a limited frequency range, the
different types of apparatus arc capable of covering the range from a small .
fraction of a cycle per second up to millions of cycles per second. Most
instruments measure either shear or tensile properties, but instruments
have been built to measure bulk properties.
Dynamic mechanical tests, in general, give more information about a
material than other tests, although theoretically the other types of me-
chanical tests can give the same information. Dynamic tests over a wide
temperature and frequency range are especially sensitive to the chemical
and physical structure, of plastics. Such tests are in many cases the most
sensitive tests known for studying glass transitions and secondary transitions
in polymers as well as the morphology of crystalline polymers.
Dynamic mechanical results are generally given in terms of complex
moduli or compliances (3,4), The notation will be illustrated in terms Of
shear modulus G, but exactly analogous notation holds for Young's mod-
ulus F. The complex moduli are defined by
where G* is the complex shear modulus, G' the real part of the modulus,
G" the imaginary part of the modulus, and i = \/- I. G' is called the
storage modulus and G the loss modulus. The latter is a damping or
energy dissipation term. The angle that reflects the time lag between the
applied stress and strain is landa, and it is defined by a ratio called the
loss tangent or dissipation factor:
Tan landa, a damping term, is a measure of the ratio of energy dissipated
as heat to the maximum energy stored in the material during one cycle of
oscillation. For small to medium amounts of damping. G' is the same as
the shear modulus measured by other methods at comparable time scales.
The loss modulus G" is directly proportional to the heat H dissipated per
where gama(0) is the maximum value of the shear strain during a cycle.
Other dynamic mechanical terms expressed by complex notation include the
com plex compliance /* and the complex viscosity eta.
and w
is the frequency of the oscillations in radians per second. Note that
the real part of the complex viscosity is an energy-dissipation term, just as
is.the imaginary part of the complex modulus.
Damping is often expressed in terms of quantities conveniently obtained
with the type of instrument used. Since there are so many kinds of instru-
ments, there are many damping terms in common use, such as the loga-
rithmic decrement A, the half-width of a resonance peak, the half-power
width of a resonance peak, the Q factor, specific damping capacity i|<, the
resilience R, and decibels of damping dB.
The logarithmic decrement A is a convenient damping term for free-
vibration instruments such as the torsion pendulum illustrated in Figure 5
for measuring shear modulus and damping. Here the weight of the upper
sample
champ
and the inertia bar are supported by a compliant torsion wire
suspension or a magnetic suspension (10) to prevent creep of the specimen
if it had to support them. As shown in the bottom of this figure, the
successive amplitudes A, decrease because of the gradual dissipation of the
clastic energy into heat. The logarithmic decrement is defined by
Mechanical Tests and Polymer Transitions
11
cycle as given by
Some of the interrelationships between the complex quantities are
1
2 Chapter 1
Figure 5 Schematic diagram of a torsion pendulum and a typical damped oscil-
lation curve. |Modified from L. E. Nielsen,