Intro Predictive Maintenance 2E Episode 2 potx
Bạn đang xem bản rút gọn của tài liệu. Xem và tải ngay bản đầy đủ của tài liệu tại đây (209.85 KB, 35 trang )
Accordingly, it is important to have good past records if we are to do any better than
guess at a value. If breakdowns are purely random occurrences, then past records are
not going to give us the ability to predict precise savings for inclusion in a sound
financial case. They may, however, give a feel for the likely cost when a breakdown
happens. At best, we could say, for example, the likely cost of a stoppage is $8,000
per hour, and likely breakdown duration is going to be two shifts at a minimum. The
question senior management then has to face is: “Are you willing to spend $10,000
on this condition monitoring device or not?”
2.2.1 Poor-Quality Product as Plant Performance Deteriorates
As a machine’s bearings wear out, its lubricants decay, or its flow rates fluctuate, the
product being manufactured may suffer damage. This can lead to an increase in the
level of rejects or to growing customer dissatisfaction regarding product quality.
Financial quantification here is similar to that outlined previously but can be even less
precise because the total effect of poor quality may be unknown. In a severe case, the
loss of ISO-9000 certification may take place, which can have financial implications
well beyond any caused by increased rejection rates.
2.2.2 Increased Cost of Fuel and Other Consumables as
the Plant Condition Deteriorates
A useful example of this point is the increased fuel consumption as boilers approach
their time for servicing. The cost associated with servicing can be quantified pre-
cisely from past statistics or a service supplier’s data. The damaging effects of a
vibrating bearing or gearbox are, however, less easy to quantify directly and even
more so as one realizes that they can have further consequential effects that compound
the total cost. For example, the vibration in a faulty gearbox could in turn lead to
rapid wear on clutch plates, brake linings, transmission bushes, or conveyor belt
fabric. Thus, the component replacement costs rise, but maintenance records will not
necessarily relate this situation to the original gearbox defect. Figure 2–2 shows
how the cost of deterioration in plant condition rises as the equipment decays, with
the occasional sudden or gradual increases as the consequential effects add to
overall costs.
2.2.3 Cost of Current Maintenance Strategy
The cost of a maintenance engineering department as a whole should be fairly clearly
documented, including wages, spares, overheads, and so on; however, it is usually dif-
ficult to break this cost down into individual plant items and virtually impossible to
allocate an accurate proportion of this total cost to a single component’s maintenance.
In addition, overall costs will rise steadily in respect to routine plant maintenance as
the equipment deteriorates with age and needs more careful attention to keep it running
smoothly. Figure 2–3 outlines the cost of a current planned preventive maintenance
strategy and shows it to be a steady outflow of cash for labor and spares, increasing
as the plant ages.
Financial Implications and Cost Justification 27
If CM is to replace planned preventive maintenance, considerable savings may be real-
ized in the spares and labor requirement for the plant, which may be found to be over-
maintained. This is more common than one might expect because maintenance has
always believed that regular prevention is much less costly than a serious breakdown
in service. Unit replacement at weekends or during a stop period is not reflected in
lost production figures, and the cost of stripping and refurbishing the plant is often
lost in the maintenance department’s wage budget for the year. In other words, the
cost of planned preventive maintenance on plant and equipment can be a constant
drain on resources that goes undetected. Accordingly, it should really be made avail-
able for comparison with the cost of monitoring the unit’s condition on a regular basis
and applying corrective measures only when needed.
28 An Introduction to Predictive Maintenance
Condition deteriorating
Time/usage (hours)
(-ve)
Cash
outflow
( )
0
0
Plant in good condition
Extra cost due to
knock-on effect
Increasing consumption
of fuel, spares, etc.
Steady cost of
fuel, spares, etc.
S
Figure 2–2 Typical cost of deterioration in plant condition.
Time/usage (hours)
(-ve)
Cash
outflow
( )
0
0
Cost of routine ppm
Increasing cost as
major components
begin to fail
Increasing wear on
moving parts
Plant ‘as new’
S
Figure 2–3 Typical cost of a preventive maintenance strategy.
2.3 JUSTIFYING PREDICTIVE MAINTENANCE
In general, the cost of any current maintenance position is largely vague and unpre-
dictable. This is true even if enough data are available to estimate past expenditure
and allocate this precisely to a particular plant item. Thus, if we are to make any sense
of financial justification, we must somehow overcome this impasse. The reduced cost
of maintenance is usually the first factor that a financial manager looks at when we
present our case, even though the real but intangible savings come from reduced down-
time. Ideally, past worksheets should give the aggregated maintenance hours spent on
the plant. These can then be pro-rated against total labor costs. Similarly, the spares
consumption recorded on the worksheets can be multiplied by unit costs. The cost of
the maintenance strategy for the plant will then be the labor cost plus the spares cost
plus an overhead element.
Unfortunately, the nearest we are likely to get to a value for maintenance overheads
will be to take the total maintenance department’s overhead value and multiply it by
the plant’s maintenance labor cost, divided by the total maintenance labor cost. Even
if we manage to arrive at a satisfactory figure, its justification will be queried if we
cannot show it as a tangible savings, either resulting from reduced staffing levels in
the maintenance department or through reduced spares consumption, which would
also be acceptable as a real savings. The estimates will need to be aggregated and
grouped according to how they can be allocated (e.g., whether they are downtime-
based, total cost per hour the plant is stopped, frequency-based, recovery cost per
breakdown, or general cost of regaining customer orders and confidence after failure
to deliver). By using these estimates, plus the performance data that have been col-
lected, it should then be possible to estimate the cost of machine failure and poor per-
formance during the past few years or months. In addition, it should also be possible
to allocate a probable savings if machine performance is improved by a realistic
amount.
It may even be possible to create a traditional cash flow diagram showing expenses
against savings and the final breakeven point, although its apparent precision is much
less than the quality of the data would suggest. If we aggregate the graphs for the cost
of the current maintenance situation, and plot that alongside the expected costs after
installing CM, as shown in Figure 2–4, then the area between the two represents the
potential savings. Figure 2–5, conversely, shows how the cost of installing CM equip-
ment is high at first, until the capital has been paid off, and then the operating cost
becomes fairly low but steady during the life of the CM equipment.
Put against the savings, there will be both the capital and running costs of introduc-
ing a CM project to be considered, which are outlined as follows.
2.3.1 Installation Cost
Some of the capital cost will be clearly defined by the equipment price and any spe-
cialist installation cost. There may also be preliminary alterations required, such as
Financial Implications and Cost Justification 29
creating access, installing foundations, covering or protection, power supply, service
access, and so on. Some or all may be subject to development grants or other finan-
cial inducement, as may the cost of consultancy before, during, or after the installa-
tion. This could well include the cost of producing a financial project justification. The
cost of lost production during installation may be avoided if the equipment is installed
during normal product changes or shutdown periods; however, in a continuous process
this may be another overhead to be added to the initial capital investment. Finally, it
may be necessary to send staff to a training course, which has not been included in
the equipment price. The cost of staff time and the course itself may be offset by train-
ing grants in some areas, which should be investigated. It is also possible that the
30 An Introduction to Predictive Maintenance
Time/usage (hours)
(-ve)
Aggregated running costs
Cash
outflow
( )
0
0
Likely running cost if CM
eliminates stoppages
Potential
saving
S
Figure 2–4 Typical potential savings produced by use of condition
monitoring.
Time (hours)
(-ve)
Installation of
CM system
Cash
outflow
( )
0
0
Pay off cost
of installation
Routine operation of CM system
S
Figure 2–5 Typical cost of condition monitoring installation and operation.
vendor will offer rental terms on the CM equipment, in which case the cost becomes
part of the operating rather than the capital budget.
2.3.2 Operating Cost
Once the unit has been installed and commissioned, the major cost is likely to be its
staffing requirement. If the existing engineering staff has sufficient skill and training,
and the improved plant performance reduces their workload sufficiently, then operat-
ing the equipment and monitoring its results may be absorbed without additional cost.
In our experience, this time-saving factor has often been ignored in justifying the case
for improved maintenance techniques. In retrospect, however, it has proved to be one
of the main benefits of installing a computer-based monitoring system.
For example, a cable maker found that his company had increased its plant capacity
by 50 percent during the year after the introduction of computer-based maintenance.
Yet the level of maintenance staff needed to look after the plant had remained
unchanged. This amounted to a 60 percent improvement in overall productivity.
Another example of this effect was a drinks manufacturer who used a computerized
scheduler to change from time-based to usage-based maintenance. This was done
because demands on production fluctuated rapidly with changes in the weather. As a
result, the workload on the maintenance trades fell so far that they were able to main-
tain an additional production line without any staffing increase at all.
If these savings can be made by better scheduling, how much more improvement in
labor availability would there be if maintenance could be related to a measurable plant
condition, and the servicing planned to coincide with a period of low activity in the
production or maintenance schedule? So, the ongoing cost of labor needed to run the
CM project must be assessed carefully and balanced against the potential labor savings
as performance improves. Other continuing costs must also be considered, such as the
fuel or consumables needed by the unit; however, these costs are normally small, and
recent trends have shown that consumable costs tend to decrease as more companies
turn to this type of equipment.
Combining the aforementioned initial costs and savings should result in an early
outflow of cash investment in equipment and training, but this soon crosses the
breakeven point within an acceptable period. It should then level off into a steady
profit, which represents a satisfying return on the initial investment, as reduced main-
tenance costs, plus improved equipment performance, are realized as overall financial
gains. Figure 2–6 indicates how the cash flow from investment in CM moves through
the breakeven point into a region of steady positive financial gain.
2.3.3 Conclusions
In conclusion, it is possible to say that the financial justification for installation of any
item of CM equipment should based on a firm business plan, where investment cost
is offset by quantified financial benefits; however, the vagueness of the factors avail-
Financial Implications and Cost Justification 31
able for quantification, the lack of firm tangible benefits, and the financial environ-
ment in which maintenance engineers operate all conspire to make the construction
of such a plan difficult.
Until the engineer is given the facilities to collect and analyze performance data accu-
rately and consistently; until the engineering and manufacturing departments are inte-
grated under a precise standard value-costing system; and until the maintenance
engineering function is given the status of a profit center, then financial justification
will never become the precise science it should be. Instead, the more normal process
is one in which an engineer makes a decision to install a CM system and then backs
it up with precise-looking figures based on imprecise data. Fortunately, once the
improved system has been approved, its performance is only rarely monitored against
that estimated in the original business plan. This is largely because the financial values
or benefits achieved are even more difficult to extract and quantify in a post-
installation audit than those in the original business plan.
2.4 ECONOMICS OF PREVENTIVE MAINTENANCE
Maintenance is, and should be, managed like a business; however, few maintenance
managers have the basic skill and experience needed to understand the economics of
an effective business enterprise. This section provides a basic understanding of main-
tenance economics.
32 An Introduction to Predictive Maintenance
Time/usage (hours)
(-ve)
(+ve)
Cash
outflow
( )
0
0
Cash
saving
Potential savings from CM
Cost of installing CM
Break even point
Net cash flow
S
Figure 2–6 Typical overall cash flow from an investment in predictive
maintenance.
2.4.1 Benefits versus Costs
Preventive maintenance is an investment. Like anything in which we invest money
and resources, we expect to receive benefits from preventive maintenance that are
greater than our investment. The following financial overview is intended to provide
enough knowledge to know what method is best and what the financial experts will
need to know to provide assistance.
Making preventive investment trade-offs requires consideration of the time-value of
money. Whether the organization is profit-driven, not-for-profit, private, public, or
government, all resources cost money. The three dimensions of payback analysis are
(1) the money involved in the flow, (2) the period over which the flow occurs, and (3)
the appropriate cost of money expected over that period.
Preventive maintenance analysis is usually either “Yes/No” or choosing one of several
alternatives. With any financial inflation, which is the time we live in, the time-value
of money means that a dollar in your pocket today is worth more than that same dollar
a year from now. Another consideration is that forecasting potential outcomes is much
more accurate in the short term than it is in the long term, which may be several years
away. Decision-making methods include the following:
• Payback
• Percent rate of return (PRR)
• Average return on investment (ROI)
• Internal rate of return (IRR)
• Net present value (NPV)
• Cost–benefit ratio (CBR)
The corporate controller often sets the financial rules to be used in justifying capital
projects. Companies have rules like, “Return on investment must be at least 20 percent
before we will even consider a project” or “Any proposal must pay back within 18
months.” Preventive maintenance evaluations should normally use the same set of
rules for consistency and to help achieve management support. It is also important to
realize that the political or treasury drivers behind those rules may not be entirely
logical for your level of working decision.
Payback
Payback simply determines the number of years that are required to recover the orig-
inal investment. Thus, if you pay $50,000 for a test instrument that saves downtime
and increases production worth $25,000 a year, then the payback is:
This concept is easy to understand. Unfortunately, it disregards the fact that the
$25,000 gained the second year may be worth less than the $25,000 gained this year
$,
$,
years
50 000
25 000
2=
Financial Implications and Cost Justification 33
because of inflation. It also assumes a uniform stream of payback, and it ignores any
returns after the two years. Why two years instead of any other number? There may
be no good reason except “The controller says so.” It should also be noted that if
simple payback is negative, then you probably do not want to make the investment.
Percent Rate of Return (PRR)
Percent rate of return is a close relation of payback that is the reciprocal of the payback
period. In our case above:
This is often called the naive rate of return because, like payback, it ignores the cost
of money over time, compounding effect, and logic for setting a finite time period for
payback.
Return on Investment (ROI)
Return on investment is a step better because it considers depreciation and salvage
expenses and all benefit periods. If we acquire a test instrument for $80,000 that we
project to have a five-year life, at which time it will be worth $5,000, then the cost
calculation, excluding depreciation, is:
If we can benefit a total of $135,000 over that same five years, then the average incre-
ment is:
The average annual ROI is:
Ask your accounting firm how they handle depreciation because that expense can
make a major difference in the calculation.
Internal Rate of Return (IRR)
Internal rate of return is more accurate than the preceding methods because it includes
all periods of the subject life, considers the costs of money, and accounts for differ-
$,
$3,
75 000
1 5 000
55 55==.%
$3, $ ,
$0,
years
$ 2, per year1 5 000 75 000
6 000
5
1 000-= =
$0 $
years
$ per year
8 000 50 000
5
15 000
,,
,
-
()
=
$,
$0,
rate of return
25 000
5 000
05 50==.%
34 An Introduction to Predictive Maintenance
ing streams of cost and/or return over life. Unfortunately, the calculation requires a
computer spreadsheet macro or a financial calculator. Ask your controller to run the
numbers.
Net Present Value (NPV)
Net present value has the advantages of IRR and is easier to apply. We decide what
the benefit stream should be by a future period in financial terms. Then we decide
what the cost of capital is likely to be over the same time and discount the benefit
stream by the cost of capital. The term net is used because the original investment
cost is subtracted from the resulting present value for the benefit. If the NPV is pos-
itive, you should do the project. If the NPV is negative, then the costs outweigh the
benefits.
Cost–Benefit Ratio (CBR)
The cost–benefit ratio takes the present value (initial project cost + NPV) divided by
the initial project cost. For example, if the project will cost $250,000 and the NPV is
$350,000, then:
It may appear that the CBR is merely a mirror of the NPV. The valuable addition is
that CBR considers the size of the financial investment required. For example, two
competing projects could have the same NPV, but if one required $1 million and the
other required only $250,000, that absolute amount might influence the choice.
Compare the previous example with the $1 million example:
There should be little question that you would take the $250,000 project instead of
the $1 million choice. Tables 2–1 through 2–5 provide the factors necessary for eval-
uating how much an investment today must earn over the next three years in order to
achieve a target ROI. This calculation requires that we make a management judgment
on what the inflation/interest rate will be for the payback time and what the pattern
of those paybacks will be.
For example, if we spend $5,000 today to modify a machine in order to reduce break-
downs, the payback will come from improved production revenues, reduced mainte-
nance labor, having the right parts, tools, and information to do the complete job, and
certainly less confusion.
The intention of this brief discussion of financial evaluation is to identify factors that
should be considered and to recognize when to ask for help from accounting, control,
$1, 0 , $ ,
$1, 0 ,
0 0 000 350 000
0 0 000
135
+
= .
$, $,
$,
250 000 350 000
250 000
24
+
= .
Financial Implications and Cost Justification 35
36 An Introduction to Predictive Maintenance
Table 2–1 Future Value
Interest
Periods 1% 2% 4% 10% 15% 20%
1 1.010 1.020 1.040 1.100 1.150 1.200
2 1.020 1.040 1.082 1.210 1.322 1.440
3 1.030 1.061 1.125 1.331 1.521 1.728
4 1.041 1.082 1.170 1.464 1.749 2.074
5 1.051 1.104 1.217 1.610 2.011 2.488
6 1.062 1.126 1.265 1.772 2.313 2.986
7 1.072 1.149 1.316 1.316 2.660 3.583
8 1.083 1.172 1.369 1.369 3.059 4.300
9 1.094 1.195 1.423 1.423 3.518 5.160
10 1.105 1.219 1.480 1.480 4.046 6.192
11 1.116 1.243 1.539 1.539 4.652 7.430
12 1.127 1.268 1.601 1.601 5.350 8.916
18 1.196 1.428 2.026 2.026 12.359 26.623
24 1.270 1.608 2.563 2.563
36 1.431 2.040 4.104 4.104
48 1.612 2.587 6.571 6.571
60 1.817 3.281 10.520 10.520
Future Value
n
=+
()
Princi
p
al 1 Interest
Table 2–2 Present Value
Interest
Periods 1% 2% 4% 10% 15% 20%
1 .990 .980 .962 .909 .870 .833
2 .980 .961 .925 .826 .756 .694
3 .971 .942 .889 .751 .658 .579
4 .961 .924 .855 .683 .572 .482
5 .951 .906 .822 .621 .497 .402
6 .942 .888 .790 .564 .432 .335
7 .933 .871 .760 .513 .376 .279
8 .923 .853 .731 .467 .327 .233
9 .914 .837 .703 .424 .284 .194
10 .905 .820 .676 .386 .247 .162
11 .896 .804 .650 .350 .215 .135
12 .887 .788 .625 .319 .187 .112
18 .836 .700 .494 .180 .081 .038
24 .788 .622 .390 .102 .035 .013
36 .699 .490 .244 .032
48 .620 .387 .152
60 .550 .305 .096
PV S
i
n
=
+
()
1
1
Table 2–3 Future Value of Annuity in Arrears, Value of a Uniform Series of Payments
Interest
Periods 1% 2% 4% 10% 15% 20%
1 1.000 1.000 1.000 1.000 1.000 1.000
2 2.010 2.020 2.040 2.100 2.150 2.200
3 2.030 3.060 3.122 3.310 3.472 3.640
4 4.060 4.122 4.246 4.641 4.993 5.368
5 5.101 5.204 5.416 6.105 6.742 7.442
6 6.152 6.308 6.633 7.716 8.754 9.930
7 7.214 7.434 7.898 9.487 11.067 12.916
8 8.286 8.583 9.214 11.436 13.727 16.499
9 9.369 9.755 10.583 13.579 16.786 20.799
10 10.462 10.950 12.006 15.937 20.304 25.959
11 11.567 12.169 13.486 18.531 24.349 32.150
12 12.683 13.412 15.026 21.384 29.002 39.580
18 19.615 21.412 25.645 45.599 75.836 128.117
24 26.973 30.422 39.083 88.497 184.168 392.484
36 43.077 51.994 77.598 299.127 * *
48 61.223 79.354 139.263 960.172 * *
60 81.670 114.052 237.991 * * *
* Over 1,000.
USCA P
i
i
n
=
+
()
-
Ê
Ë
Á
ˆ
¯
˜
11
Table 2–4 Present Value of Annuity in Arrears, Uniform Series Worth Factor
Interest
Period 1% 2% 4% 10% 15% 20%
1 .990 .980 .962 .909 .870 .833
2 1.970 1.942 1.886 1.736 1.626 1.528
3 2.941 2.884 2.775 2.487 2.283 2.106
4 3.902 3.808 3.630 3.170 2.855 2.589
5 4.853 4.713 4.452 3.791 3.352 2.991
6 5.795 5.601 5.242 4.355 3.784 3.326
7 6.728 6.472 6.002 4.868 4.160 3.605
8 7.652 7.325 6.733 5.335 4.487 3.837
9 8.566 8.162 7.435 5.759 4.772 4.031
10 9.471 8.983 8.111 6.145 5.019 4.193
11 10.368 9.787 8.760 6.495 5.239 4.327
12 11.255 10.575 9.385 6.814 5.421 4.439
18 16.398 14.992 12.659 8.201 6.128 4.812
24 21.243 18.914 15.247 8.985 6.434 4.937
36 30.118 25.489 18.908 9.677 6.623 4.993
48 37.974 30.673 21.195 9.897 4.999 4.999
60 44.955 34.761 22.623 9.967 6.665 5.000
PVA S
i
ii
n
n
n
=
+
()
-
+
()
11
1
and finance experts. Financial evaluation of preventive maintenance is divided gen-
erally into either single transactions or multiple transactions. If payment or cost reduc-
tions are multiple, they may be either uniform or varied. Uniform series are the easiest
to calculate. Nonuniform transactions are treated as single events that are then summed
together.
Tables 2–1 through 2–5 are done in periods and interest rates that are most applica-
ble to maintenance and service managers. The small interest rates will normally be
applicable to monthly events, such as 1 percent per month for 24 months. The larger
interest rates are useful for annual calculations. The factors are shown only to three
decimal places because the data available for calculation are rarely even that accurate.
The intent is to provide practical, applicable factors that avoid overkill. If factors that
are more detailed, or different periods or interest rates, are needed, they can be found
in most economics and finance texts or automatically calculated by the macros in com-
puterized spreadsheets. The future value factors (Tables 2–1 and 2–3) are larger than
1, as are present values for a stream of future payments (Table 2–4). On the other
hand, present value of a single future payment (Table 2–2) and capital recovery (Table
2–5 after the first year) result in factors of less than 1.000. The money involved to
give the answer multiplies the table factor. Many programmable calculators can also
work out these formulas. If, for example, interest rates are 15 percent per year and the
total amount is to be repaid at the end of three years, refer to Table 2–1 on future
38 An Introduction to Predictive Maintenance
Table 2–5 Capital Recovery, Uniform Series with Present Value $1
Interest
Periods 1% 2% 4% 10% 15% 20%
1 1.010 1.020 1.040 1.100 1.150 1.200
2 .508 .515 .530 .576 .615 .654
3 .340 .347 .360 .402 .438 .475
4 .256 .263 .275 .315 .350 .386
5 .206 .212 .225 .264 .298 .334
6 .173 .179 .191 .230 .264 .301
7 .149 .155 .167 .205 .240 .277
8 .131 .137 .149 .187 .223 .261
9 .117 .122 .135 .174 .210 .248
10 .106 .111 .123 .163 .199 .239
11 .096 .102 .114 .154 .191 .231
12 .089 .095 .107 .147 .184 .225
18 .061 .067 .079 .120 .163 .208
24 .047 .053 .066 .111 .155 .203
36 .0033 .038 .051 .094 .151 .200
48 .026 .032 .045 .092 .150 .200
60 .022 .028 .043 .091 .150 .200
CP P
ii
i
n
n
=
+
()
+
()
-
Ê
Ë
Á
ˆ
¯
˜
1
11
value. Find the factor 1.521 at the intersection of three years and 15 percent. If our
example cost is $35,000, it is multiplied by the factor to give:
$35,000 ¥ 1.521 = $53,235 due at the end of the term
Present values from Table 2–2 are useful to determine how much we can afford to
pay now to recover, say, $44,000 in expense reductions over the next two years. If the
interest rates are expected to be lower than 15 percent, then:
$44,000 ¥ 0.75% = $33,264
Note that a dollar today is worth more than a dollar received in the future. The annuity
tables are for uniform streams of either payments or recovery. Table 2–3 is used to
determine the value of a uniform series of payments. If we start to save now for a
future project that will start in three years, and save $800 per month through reduc-
tion of one person, and the cost of money is 1 percent per month, then $34,462 should
be in your bank account at the end of 36 months.
$800 ¥ 43.077 = $34,462
The factor 43.077 came from 36 periods at 1 percent. The first month’s $800 earns
interest for 36 months. The second month’s savings earns for 35 months, and so on.
The use of factors is much easier than using single-payment tables and adding the
amount for $800 earning interest for 36 periods ($1,114.80), plus $800 for 35 periods
($1,134.07), and continuing for 34, 33, and so on, through one. If I sign a purchase
order for new equipment to be rented at $500 per month over five years at 1 percent
per month, then:
$500 ¥ 44.955 = $22,478
Note that five years is 60 months in the period column of Table 2–4. Capital recov-
ery Table 2–5 gives the factors for uniform payments, such as mortgages or loans that
repay both principal and interest. To repay $75,000 at 15 percent annual interest over
five years, the annual payments would be:
$75,000 ¥ 0.298 = $22,350
Note that over the five years, total payments will equal $111,750 (5 ¥ $22,350), which
includes the principal $75,000 plus interest of $36,750. Also note that a large differ-
ence is made by whether payments are due in advance or in arrears.
A maintenance service manager should understand enough about these factors to do
rough calculations and then get help from financial experts for fine-tuning. Even more
important than the techniques used is the confidence in the assumptions. Control and
finance personnel should be educated in your activities so they will know what items
are sensitive and how accurate (or best judgment) the inputs are, and will be able to
support your operations.
Financial Implications and Cost Justification 39
Trading Preventive for Corrective and Downtime
Figure 2–7 illustrates the relationships between preventive maintenance, corrective
maintenance, and lost production revenues. The vertical scale is dollars. The hori-
zontal scale is the percentage of total maintenance devoted to preventive maintenance.
The percentage of preventive maintenance ranges from zero (no PMs) at the lower
left intersection to nearly 100 percent preventive at the far right. Note that the curve
does not go to 100 percent preventive maintenance because experience shows there
will always be some failures that require corrective maintenance. Naturally, the more
of any kind of maintenance that is done, the more it will cost to do those activities.
The trade-off, however, is that doing more preventive maintenance should reduce both
corrective maintenance and downtime costs. Note that the downtime cost in this illus-
tration is greater than either preventive or corrective maintenance. Nuclear power-
generating stations and many production lines have downtime costs exceeding
$10,000 per hour. At that rate, the downtime cost far exceeds any amount of mainte-
nance, labor, or even materials that we can apply to the job. The most important effort
is to get the equipment back up without much concern for overtime or expense budget.
Normally, as more preventive tasks are done, there will be fewer breakdowns and
therefore lower corrective maintenance and downtime costs. The challenge is to find
the optimum balance point.
40 An Introduction to Predictive Maintenance
Figure 2–7 The relationship between cost and amount of preventive
maintenance.
As shown in Figure 2–7, it is better to operate in a satisfactory region than to try for a
precise optimum point. Graphically, every point on the total-cost curve represents the
sum of the preventive costs plus corrective maintenance costs plus lost revenues costs.
If you presently do no preventive maintenance tasks at all, then each dollar of effort
for preventive tasks will probably gain savings of at least $10 in reduced corrective
maintenance costs and increased revenues. As the curve shows, increasing the invest-
ment in preventive maintenance will produce increasingly smaller returns as the
breakeven point is approached. The total-cost curve bottoms out, and total costs begin
to increase again beyond the breakeven point. You may wish to experiment by going
past the minimum-cost point some distance toward more preventive tasks. Even
though costs are gradually increasing, subjective measures, including reduced confu-
sion, safety, and better management control, that do not show easily in the cost cal-
culations are still being gained with the increased preventive maintenance. How do
you track these costs? Figure 2–8 shows a simple record-keeping spreadsheet that
helps keep data on a month-by-month basis.
Financial Implications and Cost Justification 41
Figure 2–8 Preventive maintenance, condition monitoring, and lost
revenue cost, $000.
It should be obvious that you must keep cost data for all maintenance efforts in order
to evaluate financially the cost and benefits of preventive versus corrective mainte-
nance and revenues. A computerized maintenance information system is best, but data
can be maintained by hand for smaller organizations. One should not expect imme-
diate results and should anticipate some initial variation. This delay could be caused
by the momentum and resistance to change that is inherent in every electromechani-
cal system, by delays in implementation through training and getting the word out to
all personnel, by some personnel who continue to do things the old way, by statisti-
cal variations within any equipment and facility, and by data accuracy.
If you operate electromechanical equipment and presently do not have a preventive
maintenance program, you are well advised to invest at least half of your maintenance
budget for the next three months in preventive maintenance tasks. You are probably
thinking: “How do I put money into preventive and still do the corrective mainte-
nance?” The answer is that you can’t spend the same money twice. At some point,
you have to stand back and decide to invest in preventive maintenance that will stop
the large number of failures and redirect attention toward doing the job right once.
This will probably cost more money initially as the investment is made. Like any other
investment, the return is expected to be much greater than the initial cost.
One other point: it is useless to develop a good inspection and preventive task sched-
ule if you don’t have the people to carry out that maintenance when required. Careful
attention should be paid to the Mean Time to Preventive Maintenance (MTPM). Many
people are familiar with Mean Time to Repair (MTTR), which is also the Mean Cor-
rective Time ( M
—
ct). It is interesting that the term MTPM is not found in any text-
books the author has seen, or even in the author’s own previous writings, although
the term M
—
pt is in use. It is easier simply to use Mean Corrective Time (M
—
ct) and
Mean Preventive Time (M
—
pt).
PM Time/Number of preventive maintenance events calculates M
—
pt. That equation
may be expressed in words as the sum of all preventive maintenance time divided by
the number of preventive activities done during that time. If, for example, five oil
changes and lube jobs on earthmovers took 1.5, 1, 1.5, 2, and 1.5 hours, the total is
7.5 hours, which divided by the five events equals an average of 1.5 hours each. A
few main points, however, should be emphasized here:
1. Mean Time Between Maintenance (MTBM) includes preventive and cor-
rective maintenance tasks.
2. Mean Maintenance Time is the weighted average of preventive and cor-
rective tasks and any other maintenance actions, including modifications
and performance improvements.
3. Inherent Availability (A
i
) considers only failure and M
—
ct. Achieved avail-
ability (A
a
) adds in PM, although in a perfect support environment. Oper-
ational Availability (A
0
) includes all actions in a realistic environment.
42 An Introduction to Predictive Maintenance
Too many maintenance functions continue to pride themselves on how fast they can
react to a catastrophic failure or production interruption rather than on their ability
to prevent these interruptions. Although few production engineers will admit their
continued adherence to this breakdown mentality, most plants continue to operate in
this mode.
3.1 MAINTENANCE MISSION
Contrary to popular opinion, the role of maintenance is not to “fix” breakdown in
record time; rather, it is to prevent all losses that are caused by equipment or system-
related problems. The mission of the maintenance department in a world-class orga-
nization is to achieve and sustain the following:
• Optimum availability
• Optimum operating conditions
• Maximum utilization of maintenance resources
• Optimum equipment life
• Minimum spares inventory
• Ability to react quickly
3.1.1 Optimum Availability
The production capacity of a plant is partly determined by the availability of produc-
tion systems and their auxiliary equipment. The primary function of the maintenance
organization is to ensure that all machinery, equipment, and systems within the plant
are always online and in good operating condition.
3
ROLE OF MAINTENANCE
ORGANIZATION
43
3.1.2 Optimum Operating Condition
Availability of critical process machinery is not enough to ensure acceptable plant per-
formance levels. The maintenance organization must maintain all direct and indirect
manufacturing machinery, equipment, and systems so that they will continuously be
in optimum operating condition. Minor problems, no matter how slight, can result in
poor product quality, reduced production speeds, or other factors that limit overall
plant performance.
3.1.3 Maximum Utilization of Maintenance Resources
The maintenance organization controls a substantial part of the total operating budget
in most plants. In addition to an appreciable percentage of the total-plant labor budget,
the maintenance manager often controls the spare parts inventory, authorizes the use
of outside contract labor, and requisitions millions of dollars in repair parts or replace-
ment equipment. Therefore, one goal of the maintenance organization should be effec-
tive use of these resources.
3.1.4 Optimum Equipment Life
One way to reduce maintenance cost is to extend the useful life of plant equipment.
The maintenance organization should implement programs that will increase the
useful life of all plant assets.
3.1.5 Minimum Spares Inventory
Reductions in spares inventory should be a major objective of the maintenance orga-
nization; however, the reduction cannot impair their ability to meet the first four goals.
With the predictive maintenance technologies that are available today, maintenance
can anticipate the need for specific equipment or parts far enough in advance to pur-
chase them on an as-needed basis.
3.1.6 Ability to React Quickly
All catastrophic failures cannot be avoided; therefore, the maintenance organization
must be able to react quickly to the unexpected failure.
3.2 E
VALUATION OF THE MAINTENANCE ORGANIZATION
One means to quantify the maintenance philosophy in your plant is to analyze the
maintenance tasks that have occurred over the past two to three years. Attention should
be given to the indices that define management philosophy.
One of the best indices of management attitude and the effectiveness of the mainte-
nance function is the number of production interruptions caused by maintenance-
related problems. If production delays represent more than 30 percent of total
44 An Introduction to Predictive Maintenance
production hours, reactive or breakdown response is the dominant management phi-
losophy. To be competitive in today’s market, delays caused by maintenance-related
problems should represent less than 1 percent of the total production hours.
Another indicator of management effectiveness is the amount of maintenance over-
time required to maintain the plant. In a breakdown maintenance environment, over-
time costs are a major, negative cost. If your maintenance department’s overtime
represents more than 10 percent of the total labor budget, you definitely qualify as a
breakdown operation. Some overtime is, and always will be, required. Special pro-
jects and the 1 percent of delays caused by machine failures will force some expen-
diture of overtime premiums, but these abnormal costs should be a small percentage
of the total labor costs.
Labor usage is another key to management effectiveness. Evaluate the percentage of
maintenance labor, compared to total available labor hours that are expended on the
actual repairs and maintenance prevention tasks. In reactive maintenance manage-
ment, the percentage will be less than 50 percent. A well-managed maintenance orga-
nization should maintain consistent labor usage above 90 percent. In other words, at
least 90 percent of the available maintenance labor hours should be effectively used
to improve the reliability of critical plant systems, not spent waiting for something to
break.
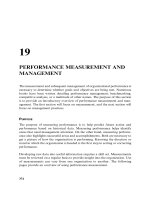
3.2.1 Three Types of Maintenance
There are three main types of maintenance and three major divisions of preventive
maintenance, as illustrated in Figure 3–1:
• Maintenance improvement
• Corrective maintenance
• Preventive maintenance
• Reactive
• Condition monitoring
• Scheduled
Maintenance Improvement
Picture these divisions as the five fingers on your hand. Maintenance improvement
efforts to reduce or eliminate the need for maintenance are like the thumb, the first
and most valuable digit. We are often so involved in maintaining that we forget to
plan and eliminate the need at its source. Reliability engineering efforts should empha-
size elimination of failures that require maintenance. This is an opportunity to pre-act
instead of react.
For example, many equipment failures occur at inboard bearings that are located in
dark, dirty, inaccessible locations. The oiler does not lubricate inaccessible bearings
as often as those that are easy to reach. This is a natural tendency, but the need for
Role of Maintenance Organization 45
lubrication could be reduced by using permanently lubricated, long-life bearings. If
that is not practical, at least an automatic oiler could be installed. A major selling point
of new automobiles is the elimination of ignition points that require replacement and
adjustment, introduction of self-adjusting brake shoes and clutches, and extension of
oil-change intervals.
Corrective Maintenance
The little finger in our analogy to a human hand represents corrective maintenance
(i.e., emergency, repair, remedial, unscheduled). At present, most maintenance is cor-
rective. Repairs will always be needed. Better maintenance improvement and pre-
ventive maintenance, however, can reduce the need for emergency corrections. A shaft
that is obviously broken into pieces is relatively easy to maintain because little human
decision is involved. Troubleshooting and diagnostic fault detection and isolation
are major time consumers in maintenance. When the problem is obvious, it can
usually be corrected easily. Intermittent failures and hidden defects are more time-
consuming, but with diagnostics, the causes can be isolated and then corrected.
From a preventive maintenance perspective, the problems and causes that result in
failures provide the targets for elimination by viable preventive maintenance. The
challenge is to detect incipient problems before they lead to total failures and to
correct the defects at the lowest possible cost. That leads us to the middle three
fingers—the branches of preventive maintenance.
Preventive Maintenance
As the name implies, preventive maintenance tasks are intended to prevent unsched-
uled downtime and premature equipment damage that would result in corrective or
46 An Introduction to Predictive Maintenance
MAINTENANCE
IMPROVEMENT
(MI)
PREVENTIVE
(PM)
CORRECTIVE
(CM)
Reliability-driven
Modification
Retrofit
Redesign
Change order
Equipment-driven
Self-scheduled
Machine-cued
Control limits
When deficient
As requred
Statistical analysis
Trends
Vibration monitoring
Tribology
Thermography
Ultrasonics
Other NDT
Periodic
Fixed intervals
Hard time limits
Specific time
Breakdowns
Emergency
Remedial
Repairs
Rebuilds
Predictive
Time-driven
Event-driven
Figure 3–1 Structure of maintenance.
repair activities. This maintenance management approach is predominantly a time-
driven schedule or recurring tasks, such as lubrication and adjustments that are
designed to maintain acceptable levels of reliability and availability.
Reactive. Reactive maintenance is done when equipment needs it. Inspection using
human senses or instrumentation is necessary, with thresholds established to indicate
when potential problems start. Human decisions are required to establish those
standards in advance so that inspection or automatic detection can determine when
the threshold limit has been exceeded. Obviously, a relatively slow deterioration
before failure is detectable by condition monitoring, whereas rapid, catastrophic
modes of failure may not be detected. Great advances in electronics and sensor tech-
nology are being made.
Also needed is a change in human thought process. Inspection and monitoring should
disassemble equipment only when a problem is detected. The following are general
rules for on-condition maintenance:
1. Inspect critical components.
2. Regard safety as paramount.
3. Repair defects.
4. If it works, don’t fix it.
Condition Monitoring. Statistics and probability theory are the basis for condition-
monitoring maintenance. Trend detection through data analysis often rewards the
analyst with insight into the causes of failure and preventive actions that will help
avoid future failures. For example, stadium lights burn out within a narrow period.
If 10 percent of the lights have burned out, it may be accurately assumed that the
rest will fail soon and should, most effectively, be replaced as a group rather than
individually.
Scheduled. Scheduled, fixed-interval preventive maintenance tasks should generally
be used only if failures that cannot be detected in advance can be reduced, or if
dictated by production requirements. The distinction should be drawn between
fixed-interval maintenance and fixed-interval inspection that may detect a threshold
condition and initiate condition-monitoring tasks. Examples of fixed-interval tasks
include 3,000-mile oil changes and 48,000-mile spark plug changes on a car, whether
it needs the changes or not. This may be wasteful because all equipment and their
operating environments are not alike. What is right for one situation may not be right
for another.
The five-finger approach to maintenance emphasizes elimination and reduction of
maintenance needs wherever possible, inspection and detection of pending failures
before they happen, repair of defects, monitoring of performance conditions and
failure causes, and accessing the equipment on a fixed-interval basis only if no better
means exist.
Role of Maintenance Organization 47
Advantages and Disadvantages
Overall, preventive maintenance has many advantages. It is beneficial, however, to
overview the advantages and disadvantages so that the positive may be increased
and the negative reduced. Note that in most cases the advantages and disadvantages
vary with the type of preventive maintenance tasks and techniques used. Use of on-
condition or condition-monitoring techniques is usually better than fixed intervals.
Advantages. There are distinct advantages to preventive maintenance management.
The predominant advantages include the following:
• Management control. Unlike repair maintenance, which must react to
failures, preventive maintenance can be planned. This means “pre-active”
instead of “reactive” management. Workloads may be scheduled so that
equipment is available for preventive activities at reasonable times.
• Overtime. Overtime can be reduced or eliminated. Surprises are reduced.
Work can be performed when convenient; however, proper distribution of
the time-driven preventive maintenance tasks is required to ensure that all
work is completed in a timely manner without excessive overtime.
• Parts inventories. Because the preventive maintenance approach permits
planning of which parts are going to be required and when, those material
requirements may be anticipated to be sure they are on hand for the event.
A smaller stock of parts is required in organizations that emphasize pre-
ventive tasks compared to the stocks necessary to cover breakdowns that
would occur when preventive maintenance is not emphasized.
• Standby equipment. With high demand for production and low equipment
availability, reserve, standby equipment is often required in case of break-
downs. Some backup may still be required with preventive maintenance, but
the need and investment will certainly be reduced.
• Safety and pollution. If no preventive inspections or built-in detection
devices are used, equipment can deteriorate to a point where it is unsafe or
may spew forth pollutants. Performance will generally follow a saw-tooth
pattern, as shown in Figure 3–2, which does well after maintenance and then
degrades until the failure is noticed and it is brought back up to a high level.
A good detection system catches degrading performance before it reaches
too low a level.
• Quality. For the same general reasons discussed previously, good preven-
tive maintenance helps ensure quality output. Tolerances are maintained
within control limits. Naturally, productivity is improved and the investment
in preventive maintenance pays off with increased revenues.
• Support to users. If properly publicized, preventive tasks help show equip-
ment operators, production managers, and other equipment users that the
maintenance function is striving to provide a high level of support. Note
here that an effective program must be published so that everyone involved
understands the value of performed tasks, the investment required, and their
own roles in the system.
48 An Introduction to Predictive Maintenance
• Cost–benefit relationship. Too often, organizations consider only costs
without recognizing the benefit and profits that are the real goal. Preventive
maintenance allows a three-way balance between corrective maintenance,
preventive maintenance, and production revenues.
Disadvantages. Despite all the good reasons for doing preventive maintenance,
several potential problems must be recognized and minimized:
• Potential damage. Every time a person touches a piece of equipment,
damage can occur through neglect, ignorance, abuse, or incorrect proce-
dures. Unfortunately, low-reliability people often service much high-
reliability equipment. The Challenger space shuttle failure, the Three Mile
Island nuclear power plant disaster, and many less-publicized accidents have
been affected by inept preventive maintenance. Most of us have experienced
car or home appliance problems that were caused by something that was
done or not done at a previous service call. This situation gives rise to the
slogan: “If it works, don’t fix it.”
• Infant mortality. New parts and consumables have a higher probability of
being defective or failing than exists with the materials that are already in
use. Replacement parts are too often not subjected to the same quality assur-
ance and reliability tests as parts that are put into new equipment.
• Parts use. Replacing parts at preplanned preventive maintenance intervals,
rather than waiting until a failure occurs, will obviously terminate that part’s
useful life before failure and therefore require more parts. This is part of the
trade-off among parts, labor, and downtime, of which the cost of parts will
usually be the smallest component. It must, however, be controlled.
• Initial costs. Given the time-value of money and inflation that causes a dollar
spent today to be worth more than a dollar spent or received tomorrow, it
should be recognized that the investment in preventive maintenance is made
earlier than when those costs would be incurred if equipment were run until
failure. Even though the cost will be incurred earlier—and may even be
larger than corrective maintenance costs would be—the benefits in terms of
equipment availability should be substantially greater from doing preven-
tive tasks.
• Access to equipment. One of the major challenges when production is at a
high rate is for maintenance to gain access to equipment in order to perform
Role of Maintenance Organization 49
Figure 3–2 Preventive maintenance to keep acceptable performance.
preventive maintenance tasks. This access will be required more often than
it is with breakdown-driven maintenance. A good program requires the
support of production, with immediate notification of any potential prob-
lems and willingness to coordinate equipment availability for inspections
and necessary tasks.
The reasons for and against doing preventive maintenance are summarized in the fol-
lowing list. The disadvantages are most pronounced with fixed-interval maintenance
tasks. Reactive and condition-monitoring tasks both emphasize the positive and reduce
the negatives.
Advantages
• Performed when convenient
• Increases equipment uptime
• Creates maximum production revenue
• Standardizes procedures, times, and costs
• Minimizes parts inventory
• Cuts overtime
• Balances workload
• Reduces need for standby equipment
• Improves safety and pollution control
• Facilitates packaging tasks and contracts
• Schedules resources on hand
• Stimulates pre-action instead of reaction
• Indicates support to user
• Assures consistent quality
• Promotes benefit/cost optimization
Disadvantages
• Exposes equipment to possible damage
• Failures in new parts
• Uses more parts
• Increases initial costs
• Requires more frequent access to equipment
3.3 D
ESIGNING A PREDICTIVE MAINTENANCE PROGRAM
An effective predictive maintenance program must include both condition-driven and
time-driven tasks. These tasks are determined by the specific equipment and systems
that constitute the plant. At a minimum, each plant should evalute:
• Failure data
• Improving equipment reliability
• Improvement process
50 An Introduction to Predictive Maintenance
• Failures that can be prevented
• Maintenance to prevent failures
• Personnel
• Service Teams
3.3.1 Failure Data
Valid failure data provide the intelligence for an effective preventive maintenance
program. After all, the objective is to prevent those failures from recurring. A
failure reporting system should identify the problem, cause, and corrective action
for every call. An action group, prophetically called the Failure Review and
Corrective Actions Task Force (FRACAS), can be effective for involving responsible
organizations in both detailed identification of problems and causes, and assignment
of both short- and long-term corrective action. The following are typical factory and
field problems and codes that shorten the computer data entry to four or fewer
characters:
NOOP Not Operable OTHR Other
BELR Below rate PM Preventive task
INTR Intermittent QUAL Quality
LEAK Leak SAFE Safety
MOD Modification WEAT Weather
NOIS Noise NPF No problem found
The following are typical cause codes:
1. Not applicable 60. Program
10. Controls 70. Materials
20. Power 71. Normal wear
21. External input power 72. Damaged
22. Main power supply 80. Operator
30. Motors 90. Environment
40. Drivers 99. No cause found
50. Transports PM. Preventive maintenance
The typical action codes are:
A/A Adjust/align REF Refurbish
CAL Calibrate REB Rebuild
CONS Consumables LUBE Lubricate
DIAG Diagnose MOD Modify
REMV Remove PM Preventive task
R/R Remove and replace RPR Repair
R/RE Remove and reinstall TRN Train
INST Install NC Not complete
INSP Inspect NK Not known
Role of Maintenance Organization 51