Báo cáo y học: " Landmark survival as an end-point for trials in critically ill patients – comparison of alternative durations of follow-up: an exploratory analysis" doc
Bạn đang xem bản rút gọn của tài liệu. Xem và tải ngay bản đầy đủ của tài liệu tại đây (337.36 KB, 8 trang )
Open Access
Available online />Page 1 of 8
(page number not for citation purposes)
Vol 13 No 4
Research
Landmark survival as an end-point for trials in critically ill patients
– comparison of alternative durations of follow-up: an exploratory
analysis
Gopal Taori
1
, Kwok M Ho
2,3
, Carol George
4
, Rinaldo Bellomo
1,5
, Steven AR Webb
2,3
,
Graeme K Hart
1
and Michael J Bailey
5
1
Department of Intensive care, Austin Hospital, Studley Road, Melbourne 3084, Australia
2
Department of Intensive Care, Royal Perth Hospital, Wellington Street, Perth 6001 Australia
3
Clinical Associate Professor, School of Population Health, University of Western Australia, Stirling Highway, Crawley 6009, Australia
4
ANZICS CORE Group, Australian and New Zealand Intensive Care Society, 10 Ievers St, Carlton 3053, Australia
5
ANZIC-RC, School Public Health & Preventive Medicine, Monash University Alfred Hospital, Commercial Road, Melbourne 3181, Australia
Corresponding author: Rinaldo Bellomo,
Received: 14 Nov 2008 Revisions requested: 26 Jan 2009 Revisions received: 16 Jun 2009 Accepted: 4 Aug 2009 Published: 4 Aug 2009
Critical Care 2009, 13:R128 (doi:10.1186/cc7988)
This article is online at: />© 2009 Taori et al.; licensee BioMed Central Ltd.
This is an open access article distributed under the terms of the Creative Commons Attribution License ( />),
which permits unrestricted use, distribution, and reproduction in any medium, provided the original work is properly cited.
Abstract
Introduction Interventional ICU trials have followed up patients
for variable duration. However, the optimal duration of follow-up
for the determination of mortality endpoint in such trials is
uncertain. We aimed to determine the most logical and practical
mortality end-point in clinical trials of critically ill patients.
Methods We performed a retrospective analysis of
prospectively collected data involving 369 patients with one of
the three specific diagnoses (i) Sepsis (ii) Community acquired
pneumonia (iii) Non operative trauma admitted to the Royal
Perth Hospital ICU, a large teaching hospital in Western
Australia (WA cohort). Their in-hospital and post discharge
survival outcome was assessed by linkage to the WA Death
Registry. A validation cohort involving 4609 patients admitted
during same time period with identical diagnoses from 55 ICUs
across Australia (CORE cohort) was used to compare the
patient characteristics and in-hospital survival to look at the
Australia-wide applicability of the long term survival data from
the WA cohort.
Results The long term outcome data of the WA cohort indicate
that mortality reached a plateau at 90 days after ICU admission
particularly for sepsis and pneumonia. Mortality after hospital
discharge before 90 days was not uncommon in these two
groups. Severity of acute illness as measured by the total
number of organ failures or acute physiology score was the main
predictor of 90-day mortality. The adjusted in-hospital survival
for the WA cohort was not significantly different from that of the
CORE cohort in all three diagnostic groups; sepsis (P = 0.19),
community acquired pneumonia (P = 0.86), non-operative
trauma (P = 0.47).
Conclusions A minimum of 90 days follow-up is necessary to
fully capture the mortality effect of sepsis and community
acquired pneumonia. A shorter period of follow-up time may be
sufficient for non-operative trauma.
Introduction
Mortality is the most clinically relevant and commonly used pri-
mary outcome measure for phase III trials in intensive care.
However, the optimal duration of follow-up for the determina-
tion of mortality in such trials is uncertain [1,2]. Interventional
ICU trials have followed up patients for different durations [3-
7]. Furthermore, some trials have censored follow up at time of
hospital discharge ignoring any subsequent out-of-hospital
deaths [8,9]. Such variability creates confusion, leads to con-
troversy and makes meta-analyses of trials with different times
of mortality assessment difficult to interpret. Measurement of
mortality at 28-days or censoring at hospital discharge have
logistic advantages but as many as one-third of critically ill
patients may still be in hospital after 28 days and deaths can
ANZICS: Australian and New Zealand Intensive Care Society; APACHE: Acute Physiology and Chronic Health Evaluation; APD: Adult Patient Data-
base; CI: confidence interval; CORE: Centre for Outcome and Resource Evaluation; GCS: Glasgow Coma Score; ICU: intensive care unit.
Critical Care Vol 13 No 4 Taori et al.
Page 2 of 8
(page number not for citation purposes)
still occur soon after hospital discharge [3]. Longer follow up
time, however, may make it difficult to distinguish between the
effects of critical illness (or the studied interventions) from
those of underlying age and co-morbidities [10]. Follow up for
longer time periods, especially where this extends beyond
hospital discharge, is more difficult and costly. The ideal
period of follow up would be up to a time point by which the
effects of critical illness remain powerful independent determi-
nants of outcome and before pre-existing factors, such as age
and co-morbidity, can have a marked and confounding impact
on survival [11].
The Australian and New Zealand Intensive Care Society
(ANZICS) Centre for Outcome and Resource Evaluation
(CORE) Adult Patient Database (APD) gathers information
about the vast majority of admissions of critically ill patients
from various intensive care units (ICUs) across Australia and
New Zealand but currently does not follow up patients beyond
hospital discharge [12]. However, in an embedded cohort of
ICU patients treated at the Royal Perth Hospital, which is a
large university teaching hospital in Western Australia (WA
cohort), such information is available [11]. Western Australia
is geographically isolated and has a low rate of emigration [11]
and, as such, loss to medium-term and long-term survival fol-
low-up by the Western Australian Death Registry is very low
[13].
We hypothesized that, if the characteristics and short-term
outcomes of patients in the WA cohort and the various ICUs
from Australia (as identified within the two databases) were
comparable, then the follow-up data of the patients in WA
cohort could be used to estimate the likely in-hospital and out-
of-hospital long-term survival of critically ill patients in Aus-
tralia.
Materials and methods
We conducted a retrospective analysis of prospectively col-
lected data from two large, related databases. Access to the
data was granted by the ANZICS CORE Management Com-
mittee in accordance with standing protocols. Data are col-
lected primarily for ICU Outcome Peer Review under Quality
Assurance Legislation of the Commonwealth of Australia (Part
VC Health Insurance Act 1973, Commonwealth of Australia).
Such data are collected and transferred from hospitals to the
database with government support and funding. Hospital data
are submitted by or on behalf of the ICU Director and results
are reported back to the Director. Each hospital allows subse-
quent data use as appropriate under the ANZICS CORE
standing procedures and in compliance with the ANZICS
CORE Terms of Reference [14] and waives the need for
informed consent. CORE does not hold individual patient
identifying data and as such informed consent has been
waived and specific ethical approval was not required. Hospi-
tal identifying data is held encrypted in the CORE database
and was not released for this study. The WA linked data had
the patient name and address removed and the Western Aus-
tralian Confidentiality of Health Information Committee
approved the study.
The study cohort consisted of all patients over 18 years of age
who were admitted to ICU from emergency departments
between 1 January, 2001 and 31 December, 2002 with one
of three acute physiology and chronic health evaluation score
(APACHE) II diagnoses [15]: sepsis of any etiology; commu-
nity acquired pneumonia or non-operative trauma.
The data for the WA cohort were extracted from the Royal
Perth Hospital ICU database. In this study, the survival out-
come after hospital discharge of the WA cohort was assessed
on 31 December 2003 by linkage to the WA death registry
[11,16]. The APACHE III-related physiology, diagnostic and
chronic health data of admissions from 55 Australian ICUs
were extracted from the ANZICS CORE adult patient data-
base (CORE cohort). In the CORE cohort, only ICUs that con-
sistently contributed data over a longer period (2001 to 2006)
were included, because the quality of the data from these con-
tributing sites was likely to be more consistent than from units
that were discontinuous contributors. Sites with missing data
for two or more years were also excluded. These CORE cohort
APACHE III data were converted to APACHE II data using a
specific algorithm [17,18].
The in-hospital and subsequent survival data of the WA cohort
at different time points after ICU admission was used to
assess whether a 'plateau' was observed. These data were
then further analyzed to determine the incidence of death after
hospital discharge and the quantum effect of various variables
on survival at different time points. A formal landmark survival
analysis was performed with the landmark time point chosen
as ICU discharge. The variables assessed included age, gen-
der, Charlson co-morbidity index [19], Acute physiology score
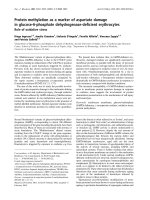
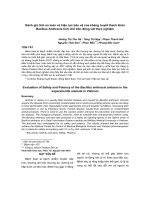
Figure 1
Kaplan Meier curves for time to death from intensive care unit admis-sion for the three types of diagnosisKaplan Meier curves for time to death from intensive care unit admis-
sion for the three types of diagnosis. Survival time is expressed in days.
Available online />Page 3 of 8
(page number not for citation purposes)
component of the APACHE II score [15], and maximum
number of organ failure during ICU admission. The definition of
organ failure used for the study has been described previously
[11,20]. In the assessment of non-operative trauma, Glasgow
Coma Score (GCS) was also analyzed in addition to other var-
iables. The data analyzed had the patient name and address
removed and the study was approved by the Royal Perth Hos-
pital Ethics Committee and the Western Australian Confiden-
tiality of Health Information Committee, which waived the need
for informed consent. The in-hospital survival of the WA cohort
was then compared with the CORE cohort to look at the appli-
cability of its long-term follow-up data to a larger population.
Statistical analysis
Continuous data with a near normal distribution are presented
as mean and standard deviation and data with a skewed dis-
tribution were expressed as median and interquartile range.
Categorical variables and data with a skewed distribution are
analysed by chi-squared and Mann-Whitney test, respectively.
Kaplan-Meier survival analysis and log-rank test was used to
compare the difference in hospital survival between the WA
cohort and ANZICS APD cohort. Single variable and multivar-
iable analyses were performed using logistic regression for
binomial outcomes and reported using odds ratios (95% con-
fidence interval (CI)) and Cox proportional hazard regression
for time to death with results reported using hazard ratios
(95% CI). Survival analysis was performed with survival time
measured from both ICU admission and ICU discharge. Multi-
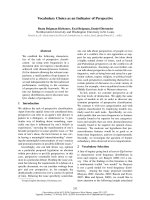
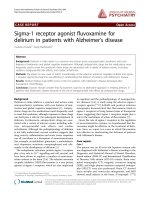
Figure 2
Cumulative hazard function for time to death from intensive care unit admission for the three types of diagnosisCumulative hazard function for time to death from intensive care unit admission for the three types of diagnosis. Note, for increased interpretability,
all survival times greater than 180 days have been truncated to 180 days.
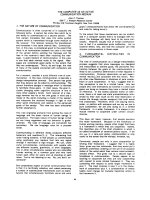
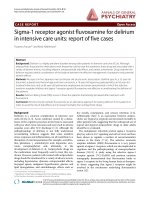
Figure 3
Mortality at different time point as a proportion of cumulative mortality at 180 days after ICU admissionMortality at different time point as a proportion of cumulative mortality at
180 days after ICU admission. ICU = intensive care unit.
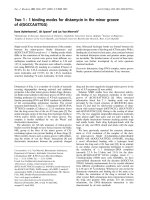
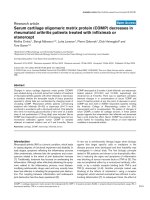
Figure 4
Kaplan Meier curves for time to death from ICU discharge for the three types of diagnosisKaplan Meier curves for time to death from ICU discharge for the three
types of diagnosis. Survival time is expressed in days. ICU = intensive
care unit.
Critical Care Vol 13 No 4 Taori et al.
Page 4 of 8
(page number not for citation purposes)
variable models were constructed using both stepwise selec-
tion and backward elimination procedures before undergoing
a final assessment for clinical and biological plausibility. Statis-
tical analysis was performed using SAS version 9.1 (SAS Insti-
tute, Cary, NC, USA) and SPSS statistical software (version
13.0 for Windows, SPSS Inc., Chicago, IL, USA). A two-sided
P value of 0.05 was considered to be statistically significant.
Results
When considering patients with pneumonia or sepsis, 28-day
mortality only effectively captured 67% and 70% of deaths
that occurred within six months of ICU admission. By consid-
ering 90-day mortality, the proportion of deaths captured
increased to 89% and 93%, respectively (Figures 1 and 2).
The absolute increase in mortality between 90 and 180 days
in these two diagnostic subgroups was relatively small (2.7%,
95% CI = 15% to 9.7%; and 3.6%, 95% CI = 17.5% to
10.4%, respectively; Figure 3 and Table 1). As for the patients
with non-operative trauma, mortality rate appeared to 'plateau'
well before 28 days (Figure 2). These results remained con-
sistent when considering post ICU survival (Figures 4 and 5).
Single-variable analysis showed the APACHE score to be the
most consistent predictor of mortality but not a statistically sig-
nificant predictor of time to death after ICU discharge for either
pneumonia or sepsis (Table 2). GCS was a consistent predic-
tor of survival for trauma-related mortality, while patient age
was a consistent predictor for mortality in the pneumonia sub-
group.
Multivariable analysis showed that markers of acute illness,
such as the number of organ failure and APACHE score, were
the strongest predictors of mortality for sepsis, community
acquired pneumonia and non-operative trauma (Table 2).
Although age was also important in patients with community
acquired pneumonia and sepsis, co-morbidities did not
appear to have an independent predictive value across the
three diagnostic subgroups (Table 2).
When the two cohorts were compared patients from the WA
cohort were slightly younger, had less co-morbidity, and a
longer length of ICU and hospital stay across all three diagnos-
tic subgroups (Table 3). However, their APACHE II predicted
mortality and hospital mortality were not statistically signifi-
cantly different across the three diagnostic subgroups.
Discussion
Using the WA data, we found that the mortality of sepsis and
community acquired pneumonia reached a plateau by 90 days
and that mortality after hospital discharge was common. We
further found that at 90 days after ICU admission the severity
of acute illness on ICU admission was still the most important
predictor of mortality.
Figure 5
Cumulative hazard function for time to death from ICU discharge for the three types of diagnosisCumulative hazard function for time to death from ICU discharge for the
three types of diagnosis. Note, for increased interpretability, all survival
times greater than 180 days have been truncated to 180 days. ICU =
intensive care unit.
Table 1
Mortality at different time points and the percentage of deaths that occur within 180 days captured at each time point
Time period (days) Sepsis (n = 111) Pneumonia (n = 82) Trauma (n = 176)
Cumulative total number of deaths
(% of deaths captured)
Cumulative total number of deaths
(% of deaths captured)
Cumulative total number of deaths
(% of deaths captured)
28 28 (70) 18 (67) 18 (95)
60 35 (88) 19 (70) 18 (95)
90 37 (93) 24 (89) 18 (95)
120 38 (95) 26 (96) 19 (100)
150 39 (98) 26 (96) 19 (100)
180 40 (100) 27 (100) 19 (100)
Available online />Page 5 of 8
(page number not for citation purposes)
Table 2
Single variable and multivariable analysis for prediction of death and survival (*P < 0.05)
Single variable analysis
Diagnosis Variables 28 day 90 day 180 day All mortality Time
to death (TTD)
TTD from
ICU discharge
Pneumonia Age 1.08
(1.03–1.13)*
1.09
(1.04–1.14)*
1.08
(1.04–1.13)*
1.07
(1.03–1.10)*
1.06
(1.03–1.09)*
1.05
(1.01–1.09)*
APACHE score 1.11
(1.02–1.21)*
1.08
(1.01–1.17)*
1.09
(1.02–1.18)*
1.07
(1.00–1.15)*
1.06
(1.01–1.11)*
1.04
(0.97–1.11)
Charlson 1.07
(0.88–1.29)
1.12
(0.94–1.33)
1.13
(0.95–1.35)
1.11
(0.93–1.33)
1.06
(0.96–1.18)
1.09
(0.96–1.22)
GCS 1.30
(0.82–2.05)
1.01
(0.81–1.26)
1.00
(0.81–1.23)
1.00
(0.82–1.23)
1.01
(0.87–1.19)
0.93
(0.80–1.09)
Organ score 1.44
(1.05–1.97)*
1.39
(1.04–1.84)*
1.56
(1.16–2.11)*
1.41
(1.07–1.86)*
1.30
(1.08–1.57)*
1.25
(0.96–1.62)
Male 0.68
(0.22–2.05)
0.74
(0.28–1.96)
1.11
(0.44–2.82)
1.11
(0.46–2.68)
1.03
(0.52–2.06)
1.19
(0.47–2.99)
Sepsis Age 1.01
(0.99–1.04)
1.02
(1.00–1.05)
1.02
(1.00–1.05)
1.03
(1.01–1.06)*
1.02
(1.00–1.04)*
1.05
(1.02–1.08)*
APACHE score 1.07
(1.01–1.13)*
1.07
(1.02–1.13)*
1.06
(1.00–1.11)*
1.05
(1.00–1.11)
1.05
(1.01–1.09)*
1.04
(0.99–1.10)
Charlson 1.04
(0.87–1.23)
1.00
(0.85–1.18)
1.07
(0.91–1.25)
1.15
(0.98–1.35)
1.08
(0.98–1.20)
1.15
(1.02–1.30)*
GCS 0.94
(0.84–1.04)
0.89
(0.8–0.99)*
0.9
(0.81–1.01)
0.9
(0.81–1.00)
0.93
(0.87–1.00)*
0.92
(0.84–1.00)
Organ score 1.67
(1.26–2.23)*
1.42
(1.12–1.8)*
1.38
(1.09–1.74)*
1.38
(1.10–1.73)*
1.28
(1.09–1.50)*
1.14
(0.92–1.41)
Male 0.77
(0.33–1.81)
1.00
(0.45–2.2)
1.07
(0.49–2.33)
1.06
(0.5–2.25)
1
(0.56–1.81)
1.03
(0.46–2.30)
Trauma Age 1.00
(0.97–1.03)
1.00
(0.97–1.03)
1.01
(0.98–1.04)
1.01
(0.99–1.04)
1.01
(0.99–1.03)
1.03
(1.00–1.07)
APACHE score 1.28
(1.16–1.41)*
1.28
(1.16–1.41)*
1.25
(1.15–1.36)*
1.22
(1.13–1.31)*
1.18
(1.12–1.24)*
1.13
(1.05–1.22)*
Charlson 0.87
(0.32–2.35)
0.87
(0.32–2.35)
0.85
(0.31–2.32)
0.72
(0.24–2.13)
0.74
(0.25–2.18)
0
(0–.)
GCS 0.62
(0.49–0.79)*
0.62
(0.49–0.79)*
0.70
(0.59–0.83)*
0.77
(0.69–0.87)*
0.78
(0.70–0.88)*
0.87
(0.76–0.99)*
Organ score 1.75
(1.30–2.36)*
1.75
(1.30–2.36)*
1.73
(1.29–2.31)*
1.66
(1.28–2.16)*
1.46
(1.22–1.75)*
1.44
(1.10–1.87)*
Critical Care Vol 13 No 4 Taori et al.
Page 6 of 8
(page number not for citation purposes)
We compared the characteristics, severity of illness and in-
hospital outcomes of 55 ICUs across Australia (CORE cohort)
with those of a cohort of patients with identical diagnoses from
a university teaching hospital in Western Australia (WA
cohort) for whom long-term outcome was available. We found
that the APACHE II-predicted mortality, hospital mortality, and
in-hospital survival curves were similar between the WA and
CORE cohorts.
This study uses very high quality prospectively collected data
(ANZICS CORE APD) that is representative of the ICU patient
population in Australia and provides a valid comparator with
which to evaluate how general the WA data is [11,12,20].
While acknowledging that there are some differences in the
baseline characteristics between the two cohorts, we note
that all measures of acute illness severity (the most important
predictors of outcome) were statistically equivalent and that
the possibility of similar in-hospital survival curves occurring by
chance is very low. Therefore, we believe that the long-term
survival data of the WA cohort may be reasonably representa-
tive of other Australian ICU populations. The ICU practices
and post acute hospital care across Australia are similar. Aus-
tralian ICU practice and outcomes are sufficiently similar to
those across the developed world to suggest that studies
comparing survival at different landmarks in Australia are likely
to have a relevance to practices elsewhere in the developed
world.
Many interventional ICU trials have used different durations of
follow up with which to assess mortality but the most appropri-
ate duration of follow up is uncertain [3-7]. Our results show
that the mortality of sepsis and community acquired pneumo-
nia does not reach a plateau until 90 days after ICU admission
and that a substantial proportion of late deaths occur after
hospital discharge. Accordingly, assessment of mortality at
day 90 and without censoring at hospital discharge is the
strategy that is most strongly supported by this analysis. Pro-
longation of follow up, to 180 days, adds little value. In con-
trast, duration of follow up to 28 days may well be adequate
for patients with ICU admissions due to non-operative trauma.
Epidemiological data shows that severity of illness and organ
failure that requires intervention can have a mortality effect
long after hospital discharge [21-23] It is thus possible that
characteristics of the disease, patient, and interventions in ICU
may have a long-term effect on outcomes of ICU patients. In
our study multivariable analysis showed that markers of acute
illness, such as the number of organ failure and APACHE
score, were the strongest predictors of mortality for sepsis,
community acquired pneumonia, and non-operative trauma.
On the other hand among non-modifiable characteristics only
age was important in patients with community acquired pneu-
monia and sepsis, while co-morbidities did not appear to have
an independent predictive value across the three diagnostic
subgroups. Although it may be argued that death is not the
only patient-centred outcome, it is however one of the most
important outcomes studied in many clinical trials. Death,
especially long-term survival rate, is often used in many clinical
trials as the primary end-point, not only in ICU medicine but
also in cardiology and oncology.
This study has several strengths. It formally addresses the
important issue of what might be an appropriate duration of
follow-up for the assessment of mortality as an outcome. It
Male 0.68
(0.19–2.47)
0.68
(0.19–2.47)
0.63
(0.17–2.28)
0.44
(0.12–1.54)
0.47
(0.14–1.62)
0.69
(0.15–3.25)
Multivariable analysis
Diagnosis Variables 28 day 90 day 180 day All mortality Time
to death (TTD)
TTD from
ICU discharge
Pneumonia Age 1.08
(1.03–1.13)*
1.09
(1.04–1.14)*
1.08
(1.03–1.13)*
1.07
(1.03–1.10)*
1.05
(1.02–1.09)*
1.05
(1.01–1.09)*
Organ score 1.54
(1.11–2.15)*
1.26
(1.03–1.55)*
Sepsis Age 1.04
(1.01–1.07)*
1.03
(1.00–1.05)*
1.04
(1.01–1.07)*
1.03
(1.01–1.05)*
1.05
(1.02–1.08)*
Organ score 1.45
(1.13–1.85)*
1.47
(1.14–1.89)*
1.38
(1.09–1.74)*
1.45
(1.13–1.85)*
1.31
(1.11–1.54)*
Trauma APACHE score 1.28
(1.16–1.41)*
1.28
(1.16–1.41)*
1.25
(1.15–1.36)*
1.22
(1.13–1.31)*
1.18
(1.12–1.24)*
1.13
(1.05–1.22)*
APACHE = Acute Physiology and Chronic Health Evaluation; GCS = Glasgow Coma Scale.
Table 2 (Continued)
Single variable and multivariable analysis for prediction of death and survival (*P < 0.05)
Available online />Page 7 of 8
(page number not for citation purposes)
used high-quality databases for this assessment and con-
firmed the biological and clinical appropriateness of 90-day
follow up by showing that 90 days after ICU admission, the
degree of illness severity at ICU admission remained an impor-
tant predictor of outcome. However, our study also has limita-
tions. Although the WA cohort was comparable with a wider
Australian ICU sample in severity of illness and hospital sur-
vival, it is still possible that the survival pattern of the two
cohorts could be different and we failed to detect such a dif-
ference. This seems unlikely given the striking similarity in ill-
ness severity, short-term outcome similarities, and the general
uniformity of the urban Australian population. It further seems
unlikely given that the observations are internally consistent for
three separate conditions. However, our results may not be
generally applicable to ICU patients in other countries
because hospital and healthcare systems vary. Thus, similar
studies in other countries are now desirable.
The sample size of the WA cohort in this study was relatively
small and the results, therefore, have wide confidence inter-
vals. We acknowledge that our study may not have enough
power to truly assess the importance of the selected predic-
tors of mortality. Accordingly, studies involving larger samples
may also be desirable to confirm these findings. In addition, we
only examined three specific subgroups of critically ill patients.
The survival pattern during the first 180 days after the onset of
other critical illness may be different in other diagnostic groups
[24]. However, these patients have been the subject of many
of the randomized controlled trials conducted in ICUs over the
past decade and as such, the correct choice of an appropriate
landmark survival end point seems particularly important.
Conclusions
A minimum follow-up time of 90 days without censoring at hos-
pital discharge is necessary to fully capture the mortality effect
of community acquired pneumonia and sepsis. For non-opera-
Table 3
Comparison of the WA and CORE cohorts
Sepsis Pneumonia Trauma
Variable WA
(n = 111)
CORE
(n = 1429)
P WA
(n = 82)
CORE
(n = 1066)
P WA
(n = 176)
CORE
(n = 2114)
P
Age, years (SD) 54.6 (16.9) 60.1 (17.9) 0.001 56.1 (15.7) 61.1 (17.8) 0.003 35.9 (16.27) 42.6 (19.3) 0.001
Male, number (%) 54 (48.6) 792 (55.4) 0.20 47 (57.3) 588 (55.2) 0.73 137 (77.8) 1599(75.6) 0.58
Median APACHE II score (IQR) 22.0 (11.0) 21.0 (13.7) 0.90 20 (9.3) 19 (10) 0.80 13.0 (9.8) 11.0 (10.0) 0.001
Median APACHE II predicted
mortality, % (IQR)
45.2 (37.6) 41.6 (43.6) 0.78 35.5 (28.3) 32.2 (31.0) 0.80 6.3 (12.1) 6.2 (12.4) 0.12
Chronic respiratory disease,
number (%)
2 (1.8) 126 (8.8) 0.006 8 (9.8) 206 (19.3) 0.04 1 (0.6) 58 (2.7) 0.08
Chronic cardiovascular disease,
number (%)
1 (0.9) 140 (9.8) 0.001 1 (1.2) 93 (8.7) 0.01 0 (0) 43 (2.0) 0.07
Chronic renal disease, number (%) 3 (2.7) 105 (7.3) 0.08 3 (3.7) 27 (2.5) 0.47 0 (0) 3 (0.1) 1.00
Chronic liver disease, number (%) 0 (0) 59 (4.1) 0.02 0 (0) 25 (2.3) 0.25 0 (0) 12 (0.6) 0.62
Immunosuppressed state, number
(%)
7 (6.3) 185 (12.9) 0.05 5 (6.1) 101 (9.4) 0.43 0 (0) 38 (1.8) 0.11
Median length of ICU stay, days
(IQR)
5.1 (7.0) 2.4 (4.9) 0.001 7 (8.3) 3.61 (6.6) 0.001 4.0 (9.8) 2.0(4.7) 0.001
Median length of hospital stay,
days (IQR)
18.0 (24.0) 9.9 (16.1) 0.001 15 (11.8) 11.4 (13.5) 0.01 18.0 (26.8) 8.0 (16.7) 0.001
ICU mortality, number (%)* 24 (21.6) 319 (23.0) 0.82 13 (15.9) 169 (16.2) 1.00 17 (9.7) 163 (8.0) 0.47
28-day mortality, number (%) 28 (23.4) 355 (27.9) 0.58 18 (22.0) 190 (20.2) 0.67 18 (10.2) 195 (9.7) 0.79
Hospital mortality, number (%)* 35 (31.5) 417 (30.7) 0.83 20 (24.4) 230 (23.0) 0.79 20 (11.4) 210 (10.5) 0.70
# P values were generated by either Mann-Whitney or chi-squared test.
* Intensive care unit (ICU) and hospital mortality outcome of CORE cohort was available only in 2031 and 2010 cases, respectively.
APACHE = Acute Physiology and Chronic Health Evaluation; IQR = interquartile range; SD = standard deviation.
Critical Care Vol 13 No 4 Taori et al.
Page 8 of 8
(page number not for citation purposes)
tive trauma, a shorter follow-up time appears to be sufficient.
This information is important in providing an evidence-based
approach in designing and interpreting randomized controlled
trials involving these conditions.
Competing interests
The authors declare that they have no competing interests.
Authors' contributions
GT designed the study, collected the data, performed the sta-
tistical analysis and drafted the manuscript. KMH performed
data analysis and helped to draft the manuscript. CG, RB, GH,
and SW participated in its design and analysis of the study,
and coordinated the drafting of the manuscript. MB performed
additional statistical analysis and responded to reviewers. All
authors read and approved the final manuscript.
Acknowledgements
The authors acknowledge the support from the ANZICS Centre for Out-
comes and Resource Evaluation.
References
1. Angus DC, Carlet J, Eds: Surviving intensive care. Update in
intensive care and emergency medicine. Berlin, Heidelberg,
New York: Springer; 2002.
2. Angus DC, Carlet J: Surviving intensive care: a report from the
2002 Brussels roundtable. Intensive Care Med 2003,
29:368-377.
3. Bernard GR, Vincent JL, Laterre PF, LaRosa SP, Dhainaut JF,
Lopez-Rodriguez A, Steingrub JS, Garber GE, Helterbrand JD, Ely
EW, Fischer CJ, for The Recombinant Human Activated Protein C
Worldwide Evaluation in Severe Sepsis (PROWESS) study group:
Efficacy and safety of recombinant human activated protein C
for severe sepsis. N Engl J Med 2001, 344:699-709.
4. Russel JA, Walley KR, Singer J, Gordon AC, Hebert PC, Cooper
DJ, Holmes CL, Mehta S, Granton JT, Storms MM, Cook DJ, Pres-
neill JJ, Ayers D, for the VASST investigators: Vasopressin versus
norepinephrine infusion in patients with septic shock. N Engl
J Med 2008, 358:954-956.
5. Rivers E, Nguyen B, Havstad S, Ressler J, Muzzin A, Knoblich B,
Peterson E, Tomlanovich M, for the Early Goal-Directed Therapy
Collaborative Group: Early goal-directed therapy in the treat-
ment of severe sepsis and septic shock. N Engl J Med 2001,
345:1368-1377.
6. The Acute Respiratory Distress Syndrome Network: Ventilation
with lower tidal volumes for acute lung injury and the acute
respiratory distress syndrome. N Engl J Med 2000,
342:1301-1308.
7. Berghe G Van den, Wilmer A, Hermans G, Meersseman W, Wout-
ers PJ, Milants I, Wijngaerden EV, Bobbaers H, Bouillon R: Inten-
sive insulin therapy in the medical ICU. N Engl J Med 2006,
354:449-461.
8. The National Heart, Lung, and Blood Institute Acute Respiratory
Distress Syndrome (ARDS) Clinical Trials Network: Pulmonary
artery versus central venous catheter to guide treatment of
acute lung injury. N Engl J Med 2006, 354:2213-2224.
9. The National Heart, Lung, and Blood Institute Acute Respiratory
Distress Syndrome (ARDS) Clinical Trials Network: Efficacy and
safety of corticosteroids for persistent acute respiratory dis-
tress syndrome. N Engl J Med 2006, 354:1671-1684.
10. Williams TA, Dobb GJ, Finn JC, Knuiman MW, Geelhoed E, Webb
SAR: Determinants of long term survival after intensive care.
Crit Care Med 2008, 36:1523-1530.
11. Williams TA, Dobb GJ, Finn JC, Knuiman M, Lee KY, Geelhoed E,
Webb SAR: Data linkage enables evaluation of long-term sur-
vival after intensive care.
Anaesth Intensive Care 2006,
34:307-315.
12. Stow PJ, Hart GK, Higlett T, George C, Herkes R, McWilliam D,
Bellomo R, for the ANZICS Database Management committee:
Development and implementation of a high quality clinical
database: The Australian and New Zealand Intensive Care
Society Adult Patient Database. J Crit Care 2006, 21:133-141.
13. Bradshaw PJ, Jamrozik K, Jelfs P, Le M: Mobile Australians: a
moving target for epidemiologists. Med J Aust 2000, 172:566.
14. ANZICS: Database Management Committee [http://
www.anzics.com.au/article.asp?Section=dmg&ID=31]
15. Knaus WA, Draper EA, Wagner DP, Zimmerman JE: APACHE II: a
severity of disease classification system. Crit Care Med 1985,
13:818-829.
16. Holman CDJ, Bass AJ, Rouse IL, Hobbs MST: Population-based
linkage of health records in Western Australia: development of
a health services research-linked database. Aust N Z J Public
Health 1999, 23:453-459.
17. ANZICS: Centre for outcome and resources evaluation, Adult
patient database, Data dictionary. Version 2.1; Appendix D
2008:160-163.
18. CERNER APACHE database [ />Cerner_3.asp?id=27300]
19. Charlson ME, Pompei P, Ales KL, MacKenzie RC: A new method
of classifying prognostic comorbidity in longitudinal studies:
development and validation. J Chronic Dis 1987, 40:373-315.
20. Ho KM, Lee KY, Williams T, Finn J, Knuiman M, Webb SAR: Acute
Physiology and Chronic Health Evaluation (APACHE) II score
predicted mortality better than organ failure scores. Anaesthe-
sia 2007, 62:466-473.
21. Ho KM, Knuiman M, Finn J, Webb SA: Estimating long-term sur-
vival of critically ill patients: the PREDICT model. PLoS one
2008, 3:e3226.
22. Girard TD, Kress JP, Fuchs BD, Thomason JW, Schweickert WD,
Pun BT, Taichman DB, Dunn JG, Pohlman AS, Kinniry PA, Jackson
JC, Canonico AE, Light RW, Shintani AK, Thompson JL, Gordon
SM, Hall JB, Dittus RS, Bernard GR, Ely EW: Efficacy and safety
of a paired sedation and ventilator weaning protocol for
mechanically ventilated patients in intensive care (Awakening
and Breathing Controlled trial): a randomised controlled trial.
Lancet 2008, 371:126-134.
23. Bryk J, Zenati M, Forsythe R, Peitzman A, Ochoa JB: Effect of
calorically dense enteral nutrition formulas on outcome in crit-
ically ill trauma and surgical patients. JPEN J Parenter Enteral
Nutr 2008, 32:6-11.
24. Wright JC, Plenderleith L, Ridley SA: Long term survival follow-
ing intensive care: subgroup analysis and comparison with the
general population. Anaesthesia 2003, 58:637-642.
Key messages
• Hospital or 28-day mortality is not an adequate follow
up end-point for interventional trials in ICU that involve
sepsis and community acquired pneumonia.
• Mortality after hospital discharge is significant up to 90
days when it appears to reach a plateau.
• Severity of illness is the main determinant of mortality at
90 days and, as such, any interventions that aim to
attenuate physiological derangement from sepsis or
community acquired pneumonia are likely to have a sig-
nificant effect on mortality up to 90 days.