Báo cáo y học: "Changes in stroke volume induced by passive leg raising in spontaneously breathing patients: comparison between echocardiography and Vigileo™/FloTrac™ device" docx
Bạn đang xem bản rút gọn của tài liệu. Xem và tải ngay bản đầy đủ của tài liệu tại đây (179.91 KB, 8 trang )
Open Access
Available online />Page 1 of 8
(page number not for citation purposes)
Vol 13 No 6
Research
Changes in stroke volume induced by passive leg raising in
spontaneously breathing patients: comparison between
echocardiography and Vigileo™/FloTrac™ device
Matthieu Biais, Lionel Vidil, Philippe Sarrabay, Vincent Cottenceau, Philippe Revel and
François Sztark
Service d'Anesthésie Réanimation 1, Hôpital Pellegrin, CHU Bordeaux, Place Amélie Raba-Léon, 33076 Bordeaux Cedex, France
Corresponding author: Matthieu Biais,
Received: 27 Aug 2009 Revisions requested: 18 Oct 2009 Revisions received: 28 Oct 2009 Accepted: 7 Dec 2009 Published: 7 Dec 2009
Critical Care 2009, 13:R195 (doi:10.1186/cc8195)
This article is online at: />© 2009 Biais et al.; licensee BioMed Central Ltd.
This is an open access article distributed under the terms of the Creative Commons Attribution License ( />),
which permits unrestricted use, distribution, and reproduction in any medium, provided the original work is properly cited.
Abstract
Introduction Passive leg raising (PLR) is a simple reversible
maneuver that mimics rapid fluid loading and increases cardiac
preload. The effects of this endogenous volume expansion on
stroke volume enable the testing of fluid responsiveness with
accuracy in spontaneously breathing patients. However, this
maneuver requires the determination of stroke volume with a
fast-response device, because the hemodynamic changes may
be transient. The Vigileo™ monitor (Vigileo™; Flotrac™; Edwards
Lifesciences, Irvine, CA, USA) analyzes systemic arterial
pressure wave and allows continuous stroke volume monitoring.
The aims of this study were (i) to compare changes in stroke
volume induced by passive leg raising measured with the
Vigileo™ device and with transthoracic echocardiography and
(ii) to compare their ability to predict fluid responsiveness.
Methods Thirty-four patients with spontaneous breathing
activity and considered for volume expansion were included.
Measurements of stroke volume were obtained with
transthoracic echocardiography (SV-TTE) and with the Vigileo™
(SV-Flotrac) in a semi-recumbent position, during PLR and after
volume expansion (500 ml saline). Patients were responders to
volume expansion if SV-TTE increased ≥ 15%.
Results Four patients were excluded. No patients received
vasoactive drugs. Seven patients presented septic hypovolemia.
PLR-induced changes in SV-TTE and in SV-Flotrac were
correlated (r
2
= 0.56, P < 0.0001). An increase in SV-TTE ≥
13% during PLR was predictive of response to volume
expansion with a sensitivity of 100% and a specificity of 80%.
An increase in SV-Flotrac ≥16% during PLR was predictive of
response to volume expansion with a sensitivity of 85% and a
specificity of 90%. There was no difference between the area
under the ROC curve for PLR-induced changes in SV-TTE
(AUC = 0.96 ± 0.03) or SV-Flotrac (AUC = 0.92 ± 0.05).
Volume expansion-induced changes in SV-TTE correlated with
volume expansion-induced changes in SV-Flotrac (r
2
= 0.77, P
< 0.0001). In all patients, the highest plateau value of SV-TTE
recorded during PLR was obtained within the first 90 s following
leg elevation, whereas it was 120 s for SV-Flotrac.
Conclusions PLR-induced changes in SV-Flotrac are able to
predict the response to volume expansion in spontaneously
breathing patients without vasoactive support.
Introduction
Fluid is administered to critically ill patients in order to increase
cardiac preload and cardiac output (CO). Studies have shown
that about 50% of critically ill patients do not exhibit the
desired effect [1]. Static indices and routine clinical variables
are known to be of little value in discriminating between
patients who will and those who will not respond to volume
expansion (VE) [2]. In contrast, dynamic indices based on car-
diopulmonary interactions and variation in left ventricular
stroke volume (SV) are able to predict adequately the individ-
CI: confidence interval; CO: cardiac output; CO-Flotrac: cardiac output obtained with Vigileo device; CO-TTE: cardiac output obtained with transtho-
racic echocardiography; CVP: central venous pressure; HR: heart rate; MAP: mean arterial pressure; NRs: non-responders; PLR: passive leg raising;
ROC: receiver operating curve; Rs: responders; SD: standard deviation; SV: stroke volume; SV-Flotrac: stroke volume obtained with Vigileo device;
SV-TTE: stroke volume obtained with transthoracic echocardiography; SVR: systemic vascular resistance; VE: volume expansion; VTIAo: velocity time
integral of aortic blood flow.
Critical Care Vol 13 No 6 Biais et al.
Page 2 of 8
(page number not for citation purposes)
ual response to fluid loading in mechanically ventilated
patients [3-9]. However, these indices appear inaccurate in
spontaneously breathing patients because they strongly
depend on respiratory status, which is not controlled in this
case.
Passive leg raising (PLR) is a simple reversible maneuver that
mimics rapid fluid loading. It transiently and reversibly
increases venous return by shifting venous blood from the legs
and the splanchnic reservoir to the intrathoracic compartment
[10-15]. PLR increases the right cardiac preload. If the right
ventricle is preload-responsive, an increase in right CO and
left ventricular filling is observed. As a result, PLR may finally
induce an increase in SV, depending on the degree of left ven-
tricular preload reserve. On the contrary, if the right and/or the
left ventricle are not preload-responsive, no increase in left
ventricular SV is expected. Thus, PLR has been proposed as
a test to detect fluid responsiveness in critically ill patients
[10,12,13].
PLR has been validated to predict fluid responsiveness, but it
requires the determination of CO with a fast-response device,
because the hemodynamic changes may be transient [13,16].
The techniques available at present are transthoracic echocar-
diography, esophageal Doppler, transpulmonary thermodilu-
tion (PiCCOplus
®
, Pulsion Medical Systems™, Munich,
Germany) and transthoracic Doppler ultrasonography
(USCOM
®
; Uscom Ltd., Sydney, Australia) [10,12,13,17].
The recently introduced Vigileo™ monitor, which allows contin-
uous CO monitoring, is based on the analysis of the systemic
arterial pressure wave and does not require pulmonary artery
catheterization or calibration with another method [18]. The
aims of the study were to compare changes in SV induced by
PLR obtained with the Vigileo™ and transthoracic echocardi-
ography and to compare their ability to predict fluid respon-
siveness in spontaneously breathing patients.
Materials and methods
Patients
After approval by the local ethics committee and obtaining
written informed consent, we included 34 patients with spon-
taneous breathing activity, equipped with an arterial catheter
and a central venous catheter, and for whom the decision to
give fluid was taken by the physician. This decision was based
on the presence of at least one clinical or biological sign of
inadequate tissue perfusion defined as (i) systolic blood pres-
sure below 90 mmHg (or a decrease >50 mmHg in previously
hypertensive patients), (ii) oligoanuria (urine output <0.5 mL/
kg/hr for >2 hours) or biological signs of acute renal failure, (iii)
tachycardia (heart rate >100 beats/min), or (iv) presence of
skin mottling.
Exclusion criteria were: unsatisfactory cardiac echogenicity,
increase in intra-abdominal pressure suspected by clinical
context and examination, patients younger than 18 years, body
mass index greater than 40 kg/m
2
or less than 15 kg/m
2
, aortic
valvulopathy, mitral insufficiency greater than grade 2, mitral
stenosis, or intracardiac shunt.
Hemodynamic monitoring
Vigileo™ monitor
A dedicated transducer (FloTrac™, Edwards Lifesciences,
Irvine, CA, USA) was connected to the radial arterial line on
one side and to the Vigileo™ System (Edwards Lifesciences,
Irvine, CA, USA) on the other side. The system, which enables
the continuous monitoring of arterial pressure, CO (cardiac
output obtained with Vigileo device (CO-Flotrac))and SV
(stroke volume obtained with Vigileo device (SV-Flotrac)),
needs no external calibration and provides continuous CO
measurements from the arterial pressure wave. The Vigileo™
(Software version 1.14) analyzes the pressure waveform 100
times per second over 20 seconds, capturing 2000 data
points for analysis and performs its calculations on the most
recent 20 seconds of data. The device calculates SV as k ×
pulsatility, where pulsatility is the standard deviation of arterial
pressure over a 20-second interval, and k is a factor quantify-
ing arterial compliance and vascular resistance. k is derived
from a multivariate regression model including (i) Lange-
wouter's aortic compliance [19], (ii) mean arterial pressure
(MAP), (iii) variance, (iv) skewness and (v) kurtosis of the pres-
sure curve. The rate of adjustment of k is one minute (Software
1.14).
Echocardiographic measurements
Doppler echocardiography was performed by the same oper-
ator (MB) using a standard transthoracic probe (P4-2, Sie-
mens Medical System, Malvern, PA, USA) and a dedicated
unit (Acuson CV-70, Siemens Medical System, Malvern, PA,
USA). Stroke volume obtained with transthoracic echocardi-
ography (SV-TTE) was calculated as the product of the aortic
valve area by the velocity time integral of aortic blood flow
(VTIAo). Using the parasternal long axis view, the diameter of
the aortic cusp and the aortic valve area was calculated (π
diameter
2
/4). As the diameter of the aortic orifice is assumed
to remain constant in a given patient, the diameter was meas-
ured once at baseline. Using the apical five-chamber view, the
VTIAo was computed from the area under the envelope of the
pulsed-wave Doppler signal obtained at the level of the aortic
annulus. The VTIAo value was averaged over five consecutive
measurements. Cardiac output obtained with transthoracic
echocardiography (CO-TTE) was calculated as the product of
heart rate (HR) by SV-TTE. The operator was unaware of SV
and CO-Flotrac values.
Left ventricular ejection fraction was measured using Simp-
son's biplane method from the apical two- and four-chamber
views.
Available online />Page 3 of 8
(page number not for citation purposes)
Central venous pressure measurements
Central venous pressure (CVP) was determined at end-expira-
tion and was averaged from three consecutive respiratory
cycles.
Systemic vascular resistance calculation
Systemic vascular resistance (SVR) were calculated using the
equation: SVR = (MAP-CVP) × 80/CO-TTE.
Respiratory parameters
All patients were breathing spontaneously.
Study design
A first set of measurements (HR, MAP, CVP, SV-FloTrac,
VTIAo, left ventricular ejection fraction and aortic valve area)
was obtained in the semi-recumbent position (45°; designated
'baseline'). Then, the lower limbs were lifted while straight
(45°) with the trunk lowered in the supine position. The second
set of measurements of MAP, CVP, HR, VTIAo (designated
'during PLR') was obtained during leg elevation, at the moment
when VTIAo plateaued at its highest value. The stroke volume
obtained with Vigileo device (SV-Flotrac) was recorded at the
moment when it plateaued at its highest value. The body pos-
ture was then returned to the baseline position and a third set
of measurements (MAP, CVP, HR, VTIAo and SV-FloTrac)
was recorded (designated 'before VE'). Finally, measurements
were obtained after VE, which was performed for 15 minutes
with 500 ml saline (designated 'after VE').
Statistical analysis
Results were expressed as mean ± standard deviation (SD) if
data were normally distributed or median [25-75% interquar-
tile range] if not. Patients were separated into responders (Rs)
and non-responders (NRs) by change in SV-TTE of 15% or
more and less than 15%, respectively, following the volume
challenge [5,6,13]. Changes in hemodynamic parameters
induced by changes in loading conditions were assessed
using a non-parametric Mann-Whitney U-test or Wilcoxon rank
sum test when appropriate. The Spearman rank method was
used to test linear correlations. Receiver operating character-
istic (ROC) curves were generated for PLR-induced changes
in SV-TTE and PLR-induced changes in SV-FloTrac varying
the discriminating threshold of each parameters, and area
under the ROC curves (95% confidence interval (CI)) were
calculated and compared [20].
SV-TTE and SV-Flotrac were compared using the Bland and
Altman method [21]. Bias (mean difference between SV-TTE
and SV-Flotrac) represents the systematic error between both
methods. Precision (SD of the bias) is representative of the
random error or variability between the different techniques.
The limits of agreement were calculated as bias ± two SD, and
defined the range in which 95% of the differences between
the methods were expected to lie. The percentage error was
calculated as the ratio of two SD of the bias to mean CO and
was considered clinically acceptable if it was below 30%, as
proposed by Critchley and Critchley [22].
A P value of less than 0.05 was considered to be statistically
significant. Statistical analysis was performed using Statview
for Windows, version 5 (SAS Institute, Cary, NC, USA) and
Medcalc (software 8.1.1.0; Mariakerke, Belgium).
Results
Patient characteristics
Thirty-four patients were initially included. Four patients were
excluded from analysis because of difficulties in transthoracic
echocardiographic image analysis. The characteristics of the
30 patients finally studied are reported in Table 1.
Patients were included 1.4 ± 1.3 days after admission to the
intensive care unit. No patients received beta-blockers. Every
patient was breathing spontaneously. Nineteen patients
(65%) were intubated and ventilated with pressure support
(inspiratory pressure = 11 ± 3 cmH
2
O, end-expiratory pres-
sure = 3 ± 2 cmH
2
O, fraction of inspired oxygen = 33 ± 7%).
Eleven patients were not intubated.
No patient received vasoactive drugs. The decision to give
fluid was made for low urine output (n = 14), tachycardia (n =
7), biological signs of acute renal failure (n = 4), mottling (n =
3), and low systolic blood pressure (n = 2).
Twenty patients were Rs to VE and 10 were NRs. The effects
of PLR and VE on hemodynamic variables in Rs and NRs are
shown in Table 2.
Table 1
Patient characteristics
Characteristics
Age (years) 55 ± 17
Gender M/F 21/9
Weight, kg 77 ± 20
Body mass index (kg/m
2
)26 ± 5
Body surface area (m
2
)1.89 ± 0.24
Reasons for fluid administration
Septic hypovolemia 7
Non septic hypovolemia 23
Reasons for ICU admission
Vascular surgery 13 (SH = 3)
Digestive surgery 12 (SH = 4)
Kidney transplantation 3 (SH = 0)
Brain injury 2 (SH = 0)
n = 30. F = female; ICU = intensive care unit; M = male; SH = septic
hypovolemia.
Critical Care Vol 13 No 6 Biais et al.
Page 4 of 8
(page number not for citation purposes)
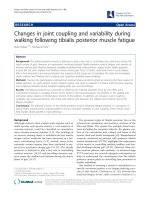
Effects of PLR and VE on changes in SV-TTE
In all patients, the effect of PLR on SV-TTE occurred in the first
90 seconds. Changes in SV-TTE induced by PLR were signif-
icantly greater in Rs than in NRs (P < 0.0001; Figure 1). In Rs,
SV-TTE increased by 21 (18 to 27) % from baseline to PLR
and by 28 (25 to 36) % from before VE to after VE. In NRs, SV-
TTE increased by 6 (-3 to 13) % from baseline to during PLR
and by 12 (1 to 14) % from before VE to after VE.
Effects of PLR and VE on changes in SV-FloTrac
In all patients, the effect of PLR on SV-Flotrac occurred in the
first 120 seconds. The changes in SV-Flotrac induced by PLR
were significantly greater in Rs than in NRs (P = 0.0002). In
Rs, SV-Flotrac increased by 24 (18 to 26) % from baseline to
during PLR and by 25 (22 to 30) from before VE to after VE.
In NRs, SV-Flotrac increased by 3 (-1 to 12) % from baseline
to during PLR and by 7 (5 to 11) from before VE to after VE.
Table 2
Hemodynamic variables in responders and non-responders at baseline, during passive leg raising, before volume expansion and
after volume expansion
Baseline During PLR P1 Before VE After VE P2
HR (beats/min)
Responders 78 (66-114) 78 (65-112) NS 78 (66-109) 77 (65-109) NS
Non-responders 78 (69-90) 78 (70-88) NS 81 (69-90) 81 (70-91) NS
MAP (mmHg)
Responders 83 (71-96) 85 (77-97) NS 84 (69-95) 98 (77-102) 0.0005
Non-responders 79 (73-91) 79 (69-85) NS 75 (70-88) 79 (73-85) NS
SV-TTE (ml)
Responders 72 (61-85) 88 (74-102) <0.0001 70 (58-85) 91 (74-105) <0.0001
Non-responders 79 (72-95) 84 (76-91) NS 77 (72-89) 82 (78-90) 0.02
SV-FloTrac (ml)
Responders 73 (58-86) 88 (76-103) <0.0001 72 (61-83) 90 (78-106) <0.0001
Non-responders 80 (65-88) 79 (68-97) NS 80 (65-86) 85 (67-98) 0.005
VTIAo (cm)
Responders 21 (19-27) 27 (24-32) <0.0001 22 (19-26) 29 (23-32) <0.0001
Nonresponders 25 (21-27) 26 (24-27) NS 22 (21-27) 25 (22-27) 0.02
CO-TTE (l/min)
Responders 5.9 (4.8-7.2) 7.1 (5.8-9.1) <0.0001 5.8 (4.7-7.1) 7.2 (6.1-8.8) <0.0001
Non-responders 6.2 (6.1-6.6) 6.3 (6.1-7.7) NS 6.1 (5.5-6.7) 6.5 (6.0-7.1) 0.02
CO-FloTrac (l/min)
Responders 5.7 (4.5-7.7) 6.7 (5.7-9.5) <0.0001 5.6 (4.6-7.8) 7.2 (6.1-9.5) <0.0001
Non-responders 6.1 (5.4-6.4) 6.3 (5.2-7.5) NS 5.9 (5.4-6.6) 6.4 (5.9-7.6) 0.005
SVR (dyn/s/cm
-5
)
Responders 968 (806-1187) 805 (721-1082) 0.0002 960 (820-1275) 826 (702-1085) 0.0006
Non-responders 865 (807-1026) 810 (737-938) NS 816 (781-1089) 820 (711-997) NS
CVP (mmHg)
Responders 5 (5-5) 8 (7-9) <0.0001 5 (5-5) 9 (8-10) <0.0001
Non-responders 9 (6-10) 10 (7-11) 0.01 9 (6-10) 10 (7-11) 0.01
CO-FloTrac = cardiac output obtained with Vigileo™ device; CO-TTE = cardiac output obtained with transthoracic echocardiography; CVP =
central venous pressure; HR = heart rate; MAP = mean arterial pressure; PLR = passive leg raising; SV-Flotrac = stroke volume obtained with
Vigileo™ device; SVR = systemic vascular resistance; SV-TTE = stroke volume obtained with transthoracic echocardiography; VE = volume
expansion; VTIAo = velocity-time integral of aortic blood flow. P1 = during PLR values vs baseline values, P2 = after VE values vs before VE
values.
Available online />Page 5 of 8
(page number not for citation purposes)
Comparison between changes in SV-TTE and changes in
SV-FloTrac
The correlation between PLR-induced changes in SV-TTE and
SV-Flotrac was r
2
= 0.56 (P < 0.0001) and the correlation
between VE-induced changes in SV-TTE and SV-Flotrac was
r
2
= 0.77 (P < 0.0001; Figures 2 and 3). After VE, the classi-
fication between Rs and NRs was similar using SV-TTE and
SV-FloTrac in 29 patients (97%).
Prediction of fluid responsiveness
PLR-induced changes in SV-TTE
An increase in SV-TTE induced by PLR of more than 13% pre-
dicted the response to VE (increase in SV-TTE ≥ 15% follow-
ing VE) with a sensitivity of 100% (95% CI = 83 to 100) and
a specificity of 80% (95% CI = 44 to 97). Two patients exhib-
ited an increase in SV-TTE of more than 13% induced by PLR
whereas they were NRs to VE.
PLR-induced changes in SV-FloTrac
An increase in SV-Flotrac induced by PLR of more than 16%
predicted the response to VE (increase in SV-TTE = 15% fol-
lowing VE) with a sensitivity of 85% (95% CI = 62 to 97) and
a specificity of 90% (95% CI = 56 to 98). Three patients did
not exhibit an increase in SV-FloTrac of more than 16% during
PLR whereas they were Rs to VE and in one patient, SV-
FloTrac was more than 16% during PLR whereas he was NR
to VE.
There was no difference between the areas under the ROC
curve for PLR-induced changes in SV-TTE (0.96 ± 0.03) or
SV-Flotrac (0.92 ± 0.05; Figure 4)
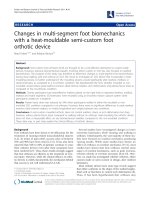
SV comparison
Bias and 95% limit of agreement between SV-TTE and SV-
Flotrac at baseline, during PLR, before VE and after VE are
shown in Figure 5. Percentage error between CO-TTE and
CO-Flotrac at baseline, during PLR, before VE and after VE
were 25%, 27%, 30% and 29%, respectively.
Discussion
This study demonstrates that PLR-induced changes in SV-
Flotrac are able to predict fluid responsiveness in spontane-
Figure 1
PLR-induced changes in SV-TTE and in SV-Flotrac in responders and non-respondersPLR-induced changes in SV-TTE and in SV-Flotrac in responders and
non-responders. Box plots and individual values of passive leg raising
(PLR)-induced changes in stroke volume measured with transthoracic
echocardiography (SV-TTE) and with Vigileo™ (SV-Flotrac) in respond-
ers (Rs) and in non-responders (NRs).
Rs NRs Rs NRs
PLR-induced changes in SV (%)
-10
0
10
20
30
40
SV-Flotrac SV-TTE
16%
13%
P=0.0002
P<0.0001
Figure 2
Relation between PLR-induced changes in SV-TTE and SV-FlotracRelation between PLR-induced changes in SV-TTE and SV-Flotrac.
Relation between passive leg raising (PLR)-induced changes in stroke
volume measured with transthoracic echocardiography (SV-TTE) and
with Vigileo™ (SV-FloTrac).
PLR-induced changes in SV-TTE (%)
-10 0 10 20 30 40
PLR-induced changes in SV-FloTrac (%)
-10
0
10
20
30
40
r²=0.56
p<0.0001
Figure 3
Relation between VE-induced changes in SV-TTE and SV-FlotracRelation between VE-induced changes in SV-TTE and SV-Flotrac. Rela-
tion between volume expansion (VE)-induced changes in stroke volume
measured with transthoracic echocardiography (SV-TTE) and with Vig-
ileo™ (SV-FloTrac).
VE-induced changes in SV-TTE (%)
0 10203040506
VE-induced changes in SV-FloTrac (%)
0
0
10
20
30
40
50
60
r²=0.77
p<0.0001
Critical Care Vol 13 No 6 Biais et al.
Page 6 of 8
(page number not for citation purposes)
ously breathing patients without vasoactive support. However,
changes in SV-Flotrac were observed after a longer delay than
changes in SV-TTE.
To our knowledge, this is the first clinical study evaluating this
issue. The accuracy of Vigileo™/Flotrac™ to assess CO has
been tested in numerous settings with various results [23-27].
During cardiac surgery and using the second-generation
device, Mayer and colleagues showed a good agreement with
intermittent pulmonary artery thermodilution [27]. In contrast, it
seems that the Vigileo™ does not accurately determine abso-
lute CO values in the event of profound systemic vasodilation
(septic shock or liver transplantation) and in unstable patients
[23,24,26].
Recently published studies investigating the ability of the Vig-
ileo™ system to track changes in SV showed discordant
results. Sakka and colleagues studied 24 mechanically venti-
lated patients with sepsis and found that the Vigileo™ was una-
ble to track changes in SV induced by an increase in
norepinephrine dosage. Patients exhibited very low SVR at
baseline, which increased significantly after the intervention
[26]. Biancofiore and colleagues studied 29 patients undergo-
ing liver transplantation with very low SVR and showed that
changes in CO-Flotrac did not correlate well with changes in
CO measured by pulmonary artery catheter [28]. In contrast, it
has been demonstrated that in patients with sub-normal SVR,
the Vigileo™ is able to track changes in SV induced by
mechanical ventilation, VE or body positioning [9,29,30]. In
the present study, SVR at baseline were sub-normal and PLR
induced significant changes in SVR only in Rs.
Three patients did not exhibit changes in SV-Flotrac following
PLR whereas they were Rs to VE. In these patients, SV-TTE
increased by more than 13% during PLR. The absence of
reactivity of the device probably stems from the algorithm and
not from the PLR maneuver. Two of the three patients pre-
sented severe sepsis and their SVR was low (573 and 790
dyn/sec/cm
5
). This is in accordance with previously published
data and underlines that changes in SV-Flotrac induced by
PLR may be somewhat unreliable in patients with very low
SVR. A third version of the device has recently been designed
to improve SV estimation in septic patients.
In all patients included in the study, the effect of PLR on SV-
TTE occurred in the first 90 seconds whereas it occurred in
the first 120 seconds for the SV-Flotrac. This may be due to
the algorithm of the device which performs SV calculation on
the most recent 20 seconds and the k calibration every one
minute. This has to be taken into account in clinical practice.
PLR induces a gravitational transfer of blood from the lower
part of the body to the intrathoracic compartment and
increases cardiac preload [16]. Several types of PLR have
been proposed to test fluid responsiveness [12-15,31]. The
final position induced by PLR was similar (lower limbs elevated
at 45° and trunk in supine position), but the baseline positions
were different. The trunk may be elevated at 45° (semi-recum-
bent), at 30° or supine. It has been recently shown that PLR
using the semi-recumbent position at baseline induced a
greater increase in cardiac preload and in cardiac index than
PLR using the supine position as baseline and that it is prefer-
able for assessing fluid responsiveness [10].
Our study has some limitations. First, the sample was small
and may limit the interpretation of the results. Second, only
seven septic patients were included and none of the patients
received vasopressive drugs. The findings cannot be extrapo-
lated to patients with severe sepsis and receiving vasopres-
sive support. Third, we used SV assessed by transthoracic
echocardiography as reference. Transthoracic echocardiogra-
phy has its inherent limitations but we took care to obtain inter-
pretable measurements: the VTIAo was averaged over five
consecutive measurements and four patients were excluded
for unsatisfactory cardiac echogenicity. Finally, patients were
defined as Rs to VE if SV-TTE increased by 15% or more. This
threshold was chosen by reference to previous studies
[6,8,12].
Conclusions
Our findings suggest that in spontaneously breathing patients
with subnormal SVR and without vasoactive support, changes
in SV-Flotrac induced by PLR correlate with changes in SV-
Figure 4
ROC curves for predicting response to volume expansionROC curves for predicting response to volume expansion. Receiver
operating characteristic (ROC) curves comparing the ability of passive
leg raising (PLR)-induced changes in stroke volume measured with
transthoracic echocardiography (SV-TTE) and with Vigileo™ (SV-
Flotrac) to discriminate responders and non-responders following vol-
ume expansion.
100 - Specificity (%)
0 204060801
Sensitivity (%)
00
0
20
40
60
80
100
PLR-induced changes in SV-TTE
PLR-induced changes in SV-FloTrac
Available online />Page 7 of 8
(page number not for citation purposes)
TTE and are able to predict fluid responsiveness, and that the
maximal change in SV-Flotrac during PLR occurred in the first
120 seconds. Other studies are necessary to test the accu-
racy of the Vigileo™ to track changes in SV induced by a PLR
maneuver in patients with low SVR.
Competing interests
The authors declare that they have no competing interests.
Authors' contributions
MB conceived and designed the study. MB performed all tran-
sthoracic echocardiography. MB, LV, PS, LP and VC per-
formed data acquisition. MB, PR and FS participated in the
data analysis and interpretation of the results. MB and FS were
involved in the statistical analysis and wrote the paper. All
authors read and approved the final manuscript.
Acknowledgements
The authors thank Ray Cooke for revising the English.
References
1. Michard F, Teboul JL: Predicting fluid responsiveness in ICU
patients: a critical analysis of the evidence. Chest 2002,
121:2000-2008.
2. Osman D, Ridel C, Ray P, Monnet X, Anguel N, Richard C, Teboul
JL: Cardiac filling pressures are not appropriate to predict
hemodynamic response to volume challenge. Crit Care Med
2007, 35:64-68.
3. Hofer CK, Muller SM, Furrer L, Klaghofer R, Genoni M, Zollinger A:
Stroke volume and pulse pressure variation for prediction of
fluid responsiveness in patients undergoing off-pump coro-
nary artery bypass grafting. Chest 2005, 128:848-854.
4. Reuter DA, Felbinger TW, Schmidt C, Kilger E, Goedje O, Lamm
P, Goetz AE: Stroke volume variations for assessment of car-
Key messages
• PLR-induced changes in SV obtained with SV-TTE and
SV-Flotrac are correlated.
• PLR-induced changes in SV-Flotrac are able to predict
fluid responsiveness in spontaneously breathing
patients without vasopressive support.
• The effect of PLR occurred in the first 120 seconds for
the SV-Flotrac and in the first 90 seconds for the SV-
TTE.
Figure 5
Comparison between SV-TTE and SV-Flotrac at baseline, during PLR, before VE and after VEComparison between SV-TTE and SV-Flotrac at baseline, during PLR, before VE and after VE. Bland-Altman plots between stroke volume measured
by transthoracic echocardiography (SV-TTE) and by Vigileo™ (SV-Flotrac) at baseline, during passive leg raising, before and after volume expansion.
The continuous lines show the mean difference (bias) and the dotted lines show the 95% limits of agreement (two standard deviations).
(SV-Echo + SV-Flotrac) / 2 (ml)
40 60 80 100 120 140 160
SV-Echo - SV-Flotrac (ml)
-40
-20
0
20
40
Mean
1.0
+ 2SD
- 2SD
17.0
-14.9
Baseline
(SV-Echo + SV-Flotrac) / 2 (ml)
40 60 80 100 120 140 160
SV-Echo - SV-Flotrac (ml)
-40
-20
0
20
40
Mean
1.8
+ 2SD
- 2SD
21.9
-18.3
During Passive Leg Raising
(SV-Echo + SV-Flotrac) / 2 (ml)
40 60 80 100 120 140 160
SV-Echo - SV-Flotrac (ml)
-40
-20
0
20
40
Mean
-1.6
+ 2SD
- 2SD
16.6
-19.8
Before Volume Expansion
(SV-Echo + SV-Flotrac) / 2 (ml)
40 60 80 100 120 140 160
SV-Echo - SV-Flotrac (ml)
-40
-20
0
20
40
Mean
-0.7
+ 2
SD
- 2
SD
20.2
-21.5
After Volume Expansion
Critical Care Vol 13 No 6 Biais et al.
Page 8 of 8
(page number not for citation purposes)
diac responsiveness to volume loading in mechanically venti-
lated patients after cardiac surgery. Intensive Care Med 2002,
28:392-398.
5. Feissel M, Michard F, Mangin I, Ruyer O, Faller JP, Teboul JL: Res-
piratory changes in aortic blood velocity as an indicator of fluid
responsiveness in ventilated patients with septic shock. Chest
2001, 119:867-873.
6. Michard F, Boussat S, Chemla D, Anguel N, Mercat A, Lecarpen-
tier Y, Richard C, Pinsky MR, Teboul JL: Relation between respi-
ratory changes in arterial pulse pressure and fluid
responsiveness in septic patients with acute circulatory fail-
ure. Am J Respir Crit Care Med 2000, 162:134-138.
7. Michard F, Chemla D, Richard C, Wysocki M, Pinsky MR, Lecar-
pentier Y, Teboul JL: Clinical use of respiratory changes in arte-
rial pulse pressure to monitor the hemodynamic effects of
PEEP. Am J Respir Crit Care Med 1999, 159:935-939.
8. Tavernier B, Makhotine O, Lebuffe G, Dupont J, Scherpereel P:
Systolic pressure variation as a guide to fluid therapy in
patients with sepsis-induced hypotension. Anesthesiology
1998, 89:1313-1321.
9. Biais M, Nouette-Gaulain K, Cottenceau V, Revel P, Sztark F:
Uncalibrated pulse contour-derived stroke volume variation
predicts fluid responsiveness in mechanically ventilated
patients undergoing liver transplantation. Br J Anaesth 2008,
101:761-768.
10. Jabot J, Teboul JL, Richard C, Monnet X: Passive leg raising for
predicting fluid responsiveness: importance of the postural
change. Intensive Care Med 2009, 35:85-90.
11. Caille V, Jabot J, Belliard G, Charron C, Jardin F, Vieillard-Baron A:
Hemodynamic effects of passive leg raising: an echocardio-
graphic study in patients with shock. Intensive Care Med 2008,
34:1239-1245.
12. Lamia B, Ochagavia A, Monnet X, Chemla D, Richard C, Teboul JL:
Echocardiographic prediction of volume responsiveness in
critically ill patients with spontaneously breathing activity.
Intensive Care Med 2007, 33:1125-1132.
13. Monnet X, Rienzo M, Osman D, Anguel N, Richard C, Pinsky MR,
Teboul JL: Passive leg raising predicts fluid responsiveness in
the critically ill. Crit Care Med 2006, 34:1402-1407.
14. Lafanechere A, Pene F, Goulenok C, Delahaye A, Mallet V,
Choukroun G, Chiche JD, Mira JP, Cariou A: Changes in aortic
blood flow induced by passive leg raising predict fluid respon-
siveness in critically ill patients. Crit Care 2006, 10:R132.
15. Boulain T, Achard JM, Teboul JL, Richard C, Perrotin D, Ginies G:
Changes in BP induced by passive leg raising predict
response to fluid loading in critically ill patients. Chest 2002,
121:1245-1252.
16. Monnet X, Teboul JL: Passive leg raising. Intensive Care Med
2008, 34:659-663.
17. Thiel SW, Kollef MH, Isakow W: Non-invasive stroke volume
measurement and passive leg raising predict volume respon-
siveness in medical ICU patients: an observational cohort
study. Crit Care 2009, 13:R111.
18. Manecke GR: Edwards FloTrac sensor and Vigileo monitor:
easy, accurate, reliable cardiac output assessment using the
arterial pulse wave. Expert Rev Med Devices 2005, 2:523-527.
19. Langewouters G, Wesseling K, Goedhard W: The pressure
dependent dynamic elasticity of 35 thoracic and 16 abdominal
human aortas in vitro described by a five component model. J
Biomech 1985, 18:613-620.
20. Hanley JA, McNeil BJ: A method of comparing the areas under
receiver operating characteristic curves derived from the
same cases. Radiology 1983, 148:839-843.
21. Bland JM, Altman DG: Statistical methods for assessing agree-
ment between two methods of clinical measurement. Lancet
1986, 1:307-310.
22. Critchley LA, Critchley JA: A meta-analysis of studies using bias
and precision statistics to compare cardiac output measure-
ment techniques. J Clin Monit Comput 1999, 15:85-91.
23. Biais M, Nouette-Gaulain K, Cottenceau V, Vallet A, Cochard JF,
Revel P, Sztark F: Cardiac output measurement in patients
undergoing liver transplantation: pulmonary artery catheter
versus uncalibrated arterial pressure waveform analysis.
Anesth Analg 2008, 106:1480-1486.
24. Compton FD, Zukunft B, Hoffmann C, Zidek W, Schaefer JH: Per-
formance of a minimally invasive uncalibrated cardiac output
monitoring system (Flotrac/Vigileo) in haemodynamically
unstable patients. Br J Anaesth 2008, 100:451-456.
25. de Waal EE, Kalkman CJ, Rex S, Buhre WF: Validation of a new
arterial pulse contour-based cardiac output device. Crit Care
Med 2007, 35:1904-1909.
26. Sakka SG, Kozieras J, Thuemer O, van Hout N: Measurement of
cardiac output: a comparison between transpulmonary ther-
modilution and uncalibrated pulse contour analysis. Br J
Anaesth 2007, 99:337-342.
27. Mayer J, Boldt J, Wolf MW, Lang J, Suttner S: Cardiac output
derived from arterial pressure waveform analysis in patients
undergoing cardiac surgery: validity of a second generation
device. Anesth Analg 2008, 106:867-872. table of contents
28. Biancofiore G, Critchley LA, Lee A, Bindi L, Bisa M, Esposito M,
Meacci L, Mozzo R, DeSimone P, Urbani L, Filipponi F: Evaluation
of an uncalibrated arterial pulse contour cardiac output moni-
toring system in cirrhotic patients undergoing liver surgery. Br
J Anaesth 2009, 102:47-54.
29. Senn A, Button D, Zollinger A, Hofer CK: Assessment of cardiac
output changes using a modified FloTrac/Vigileo algorithm in
cardiac surgery patients. Crit Care 2009, 13:R32.
30. Biais M, Nouette-Gaulain K, Roullet S, Quinart A, Revel P, Sztark
F: A comparison of stroke volume variation measured by Vig-
ileo/FloTrac system and aortic Doppler echocardiography.
Anesth Analg 2009, 109:466-469.
31. Maizel J, Airapetian N, Lorne E, Tribouilloy C, Massy Z, Slama M:
Diagnosis of central hypovolemia by using passive leg raising.
Intensive Care Med 2007, 33:1133-1138.