Báo cáo y học: "Regional lung aeration and ventilation during pressure support and biphasic positive airway pressure ventilation in experimental lung injury" potx
Bạn đang xem bản rút gọn của tài liệu. Xem và tải ngay bản đầy đủ của tài liệu tại đây (739.47 KB, 12 trang )
Gama de Abreu et al. Critical Care 2010, 14:R34
/>Open Access
RESEARCH
© 2010 Gama de Abreu et al.; licensee BioMed Central Ltd. This is an open access article distributed under the terms of the Creative
Commons Attribution License ( which permits unrestricted use, distribution, and repro-
duction in any medium, provided the original work is properly cited.
Research
Regional lung aeration and ventilation during
pressure support and biphasic positive airway
pressure ventilation in experimental lung injury
Marcelo Gama de Abreu*†1, Maximiliano Cuevas
†2
, Peter M Spieth
1
, Alysson R Carvalho
1
, Volker Hietschold
3
,
Christian Stroszczynski
3
, Bärbel Wiedemann
4
, Thea Koch
2
, Paolo Pelosi
5
and Edmund Koch
6
Abstract
Introduction: There is an increasing interest in biphasic positive airway pressure with spontaneous breathing
(BIPAP+SB
mean
), which is a combination of time-cycled controlled breaths at two levels of continuous positive airway
pressure (BIPAP+SB
controlled
) and non-assisted spontaneous breathing (BIPAP+SB
spont
), in the early phase of acute lung
injury (ALI). However, pressure support ventilation (PSV) remains the most commonly used mode of assisted
ventilation. To date, the effects of BIPAP+SB
mean
and PSV on regional lung aeration and ventilation during ALI are only
poorly defined.
Methods: In 10 anesthetized juvenile pigs, ALI was induced by surfactant depletion. BIPAP+SB
mean
and PSV were
performed in a random sequence (1 h each) at comparable mean airway pressures and minute volumes. Gas
exchange, hemodynamics, and inspiratory effort were determined and dynamic computed tomography scans
obtained. Aeration and ventilation were calculated in four zones along the ventral-dorsal axis at lung apex, hilum and
base.
Results: Compared to PSV, BIPAP+SB
mean
resulted in: 1) lower mean tidal volume, comparable oxygenation and
hemodynamics, and increased PaCO
2
and inspiratory effort; 2) less nonaerated areas at end-expiration; 3) decreased
tidal hyperaeration and re-aeration; 4) similar distributions of ventilation. During BIPAP+SB
mean
: i) BIPAP+SB
spont
had
lower tidal volumes and higher rates than BIPAP+SB
controlled
; ii) BIPAP+SB
spont
and BIPAP+SB
controlled
had similar
distributions of ventilation and aeration; iii) BIPAP+SB
controlled
resulted in increased tidal re-aeration and hyperareation,
compared to PSV. BIPAP+SB
spont
showed an opposite pattern.
Conclusions: In this model of ALI, the reduction of tidal re-aeration and hyperaeration during BIPAP+SB
mean
compared
to PSV is not due to decreased nonaerated areas at end-expiration or different distribution of ventilation, but to lower
tidal volumes during BIPAP+SB
spont
. The ratio between spontaneous to controlled breaths seems to play a pivotal role
in reducing tidal re-aeration and hyperaeration during BIPAP+SB
mean
.
Introduction
Maintenance of spontaneous breathing activity during ven-
tilatory support in acute lung injury (ALI) may improve
pulmonary gas exchange, systemic blood flow, and oxygen
supply to the tissues [1]. Most importantly, spontaneous
breathing activity may contribute to decrease the time of
ventilatory support and the length of stay in the intensive
care unit [2]. Although pressure support ventilation (PSV)
is the most frequently used form of assisted mechanical
ventilation [3], there is increasing interest in biphasic posi-
tive airway pressure with superposed spontaneous breath-
ing (BIPAP+SB
mean
) [4]. PSV is a pressure-limited, flow-
cycled mode in which every breath is supported by a con-
* Correspondence:
1
Pulmonary Engineering Group, Department of Anaesthesiology and
Intensive Care Therapy, University Hospital Carl Gustav Carus, Technical
University of Dresden, Fetscherstr. 74, 01307 Dresden, Germany
†
Contributed equally
Full list of author information is available at the end of the article
Gama de Abreu et al. Critical Care 2010, 14:R34
/>Page 2 of 12
stant level of pressure at the airways, thus the tidal volume
(V
T
) and inspiratory flow may adapt to the demands of the
patient [5]. In contrast, BIPAP+SB
mean
is a combination of
time-cycled controlled breaths at two levels of continuous
positive airway pressure (BIPAP+SB
controlled
) and non-
assisted spontaneous breathing (BIPAP+SB
spont
) [4]. Com-
pared with controlled mechanical ventilation and PSV, a
possible advantage of non-assisted spontaneous breath dur-
ing BIPAP+SB
mean
is that they may generate higher trans-
pulmonary pressures in dependent lung areas, contributing
to lung recruitment, reduction of cyclic collapse/reopening
and improvement of ventilation/perfusion matching [6-8].
Previous studies comparing PSV with BIPAP+SB
mean
have not assessed the distribution of both aeration and ven-
tilation [6,9,10]. In experimental ALI, we observed that aer-
ation compartments of the whole lungs did not differ
between BIPAP+SB
mean
or PSV and controlled mechanical
ventilation [11]. In contrast, Yoshida and colleagues [10]
suggested that, in patients with ALI, improvement of lung
aeration is more pronounced during BIPAP+SB
mean
than
PSV. However, both in an animal [11] and patient study
[10], aeration was assessed at end-expiration with static
computed tomography (CT) during breath holding, possibly
introducing artifacts. As dynamic CT (CT
dyn
) does not
require breath holding, it may be considered a suitable tech-
nique for assessing lung aeration and ventilation during
BIPAP+SB
mean
and PSV.
In the current study, we investigated the distributions of
regional aeration and ventilation at the lungs' apex, hilum
and base during PSV and BIPAP+SB
mean
using CT
dyn
in
experimental ALI. We hypothesized that BIPAP+SB
mean
,
compared with PSV: is associated with decreased amounts
of nonaerated lung tissue and increased relative ventilation
in dorsal lung zones due to increased inspiratory effort; and
decreases tidal reaeration and hyperaeration through reduc-
tion of nonaerated lung tissue and different distribution of
ventilation.
Materials and methods
The protocol of this study has been approved by the local
animal care committee and the Government of the State
Saxony, Germany. Ten pigs (weighing 25.0 to 36.5 kg)
were pre-medicated and anesthetized with intravenous
midazolam, ketamine, and remifentanil. The trachea was
intubated and lungs were ventilated with an EVITA XL 4
Lab (Dräger Medical AG, Lübeck, Germany) in the vol-
ume-controlled mode using a V
T
of 12 ml/kg, inspiratory:
expiratory ratio (I:E) of 1:1, fraction of inspired oxygen
(FiO
2
) of 0.5, positive end-expiratory pressure (PEEP) of 5
cmH
2
O, and respiratory rate (RR) set to achieve normocap-
nia. We decided to use a PEEP of 5 cmH
2
O to allow a better
differentiation of tidal recruitment/reaeration and tidal
hyperaeration between the modes investigated. Previous
data from our group [12] suggest that such phenomena
occur simultaneously but in different proportions depend-
ing on the level of PEEP. A FiO
2
of 0.5 was chosen to allow
adequate oxygenation without increasing atelectasis. FiO
2
and PEEP were not changed during the experiments. An
esophageal catheter (Erich Jaeger GmbH, Höchberg, Ger-
many) was advanced through the mouth into the mid chest.
A crystalloid solution (E153, Serumwerk Bernburg AG,
Bernburg, Germany) at a rate of 10 to 20 mL.kg
-1
.h
-1
was
used to maintain volemia.
Hemodynamics was monitored with catheters placed in
right external carotid and pulmonary arteries. Arterial and
mixed venous blood samples were analyzed.
Airway flow, airway pressure (P
aw
) and esophageal pres-
sure were measured using calibrated flow and pressure sen-
sors placed at the endotracheal tube, and respiratory
parameters calculated. The ratio of inspiratory to total
respiratory cycle (Ti/Ttot) was also determined. The prod-
uct of inspiratory esophageal pressure vs. time (PTP), the
difference between P
aw
at the beginning of inspiration and
100 ms thereafter (P
0.1
), and the dynamic intrinsic PEEP
(PEEP
i,dyn
) were determined. Values of PTP, P
0.1
and
PEEP
i,dyn
were taken from two minute and four minute
recordings during controlled and assisted mechanical venti-
lation, respectively.
Respiratory parameters were computed from controlled
(BIPAP+SB
controlled
) and spontaneous (BIPAP+SB
spont
)
breath cycles. The contributions of spontaneous and con-
trolled breaths to BIPAP+SB
mean
were weighted by their
respective rates (weighted mean BIPAP+SB
mean
). Mean air-
way and transpulmonary pressures were weighted also by
time, that is as the integral of the area under the flow curve
divided by time, as shown in detail in Additional file 1.
Dynamic computed tomography
CT
dyn
measurements were performed with a Somatom Sen-
sation 16 (Siemens, Erlangen, Germany) at three different
lung levels: apex (about 3 cm cranial to the carina); hilum
(at carina level); base (about 2 to 3 cm caudal to the carina).
Scans were obtained every 120 ms during a period of 60
seconds, resulting in approximately 500 images per level.
Each image obtained corresponded to a matrix with 512 ×
512 voxels of 0.443 × 0.443 × 1 mm
3
. Segmentation of the
region of interest contained between the boundaries defined
by the rib cage and mediastinal organs was performed semi-
automatically, with software (CHRISTIAN II, Technical
University Dresden, Germany) developed by one of the
authors (MC). Each level was further divided into four
zones of equal heights from ventral to dorsal (1 = ventral, 2
= mid-ventral, 3 = mid-dorsal, and 4 = dorsal). The four
zones had equal height at each different level (apex, hilus,
and base).
Gama de Abreu et al. Critical Care 2010, 14:R34
/>Page 3 of 12
Aeration compartments at end-expiration and end-inspi-
ration were computed based on an arbitrary scale for attenu-
ation described elsewhere [13]. Accordingly, ranges of -
1000 to -900 Hounsfield units (HU), -900 to -500 HU, -500
to -100 HU, and -100 to +100 HU were used to define the
hyperaerated, normally aerated, poorly aerated, and nonaer-
ated compartments, respectively.
Tidal reaeration was calculated as the decrease in the per-
centage of nonaerated and poorly aerated compartments
from end-expiration to end-inspiration [14]. Tidal hyperaer-
ation was calculated as the increase in the percentage of
hyperaeration from end-expiration to end-inspiration [14].
Ventilation in one zone of a given level was computed as
the variation of gas content between end-inspiration and
end-expiration of that zone divided by the total variation of
gas content in the respective level.
For BIPAP+SB
mean
, CT variables were computed in the
same way as for respiratory parameters, that is weighted
means of spontaneous and controlled breaths.
Protocol for measurements
After preparation, animals were allowed to stabilize for 15
minutes (baseline, volume-controlled mode). ALI was
induced by means of surfactant depletion [15] and consid-
ered stable if partial pressure of oxygen (PaO
2
)/FiO
2
was
200 mmHg or less for at least 30 minutes (injury, volume-
controlled mode). After obtaining the measurements at
injury, BIPAP+SB
controlled
was initiated as follows: the driv-
ing pressure, which corresponded to the difference between
the higher and the lower continuous positive P
aw
level of 5
cmH
2
O, was set to obtain V
T
of 7 to 8 ml/kg and mechani-
cal RR was set to reach partial pressure of carbon dioxide
(PaCO
2
) in the range of 50 to 60 mmHg, without spontane-
ous breathing. The I:E ratio was set to achieve mean P
aw
in
the range of 8 to 10 cmH
2
O, as expected in PSV. At the
same time, depth of anesthesia was a reduced, remaining
constant thereafter. Lower mechanical RR combined with
reduced depth of anesthesia enabled spontaneous breathing
(unsynchronized and superimposed to BIPAP+SB
controlled
).
When spontaneous breathing represented 20% or more of
total minute ventilation, all animals were subjected to
BIPAP+SB
mean
and PSV in randomized sequence for 60
minutes. During BIPAP+SB
mean
, the initial ventilatory set-
tings of BIPAP+SB
controlled
were kept unchanged and spon-
taneous breathing efforts and rate increased according to
the respiratory drive of the animals, without pressure sup-
port. During PSV, the target pressure support was set to
achieve V
T
of 7 to 8 ml/kg, the inspiratory flow trigger was
fixed at 2.0 L/min and the ventilator cycled-off at 25% of
peak flow. Each assisted mechanical ventilation mode
lasted 60 minutes. Measurements were performed at the
following steps: baseline, injury and at the end of each
assisted mechanical ventilation mode. The time elapsed
between stabilization of injury, and first and second assisted
mechanical ventilation mode corresponded to 60 and 120
minutes, respectively.
Statistics
Data are given as mean ± standard deviation. Changes in
functional variables were tested with two-tailed student's
paired t-tests. Variables derived from CT
dyn
measurements
were evaluated with mixed linear models using the follow-
ing factors: level (apex, hilum, and base), zone (1 to 4) and
type of mechanical ventilation (PSV, BIPAP+SB
mean
,
BIPAP+SB
controlled
and BIPAP+SB
spont
). Compound sym-
metry for the measures on the same animal was assumed.
Identical correlations were also assumed and their strength
was estimated by components of variance. Residuals were
checked for normal distribution, as suggested by their plots.
Final mixed linear models resulted from stepwise model
choices and included only statistical significant effects.
Multiple comparisons were adjusted by the Bonferroni pro-
cedure. Univariate and multivariate analysis were per-
formed with the software SPSS (Version 15.0, Chicago, IL,
USA) and SAS (Procedure Mixed, Version 8, SAS Institute
Inc, Cary, NC, USA), respectively. Statistical significance
was accepted at P < 0.05 in all tests.
Results
Induction of acute lung injury
ALI was achieved with one to five lavages (median = 2.5),
resulting in increased peak and mean P
aw
and mean trans-
pulmonary pressure (Ppeak, Pmean, and Ppl mean, respec-
tively; Table 1), as well as reduced oxygenation and
increased mean pulmonary artery pressure (Table 2).
Assisted mechanical ventilation
During BIPAP+SB
mean
we detected spontaneous breathing
only on low but not on high continuous positive P
aw
levels.
Minute ventilation did not differ between PSV and
BIPAP+SB
mean
(Table 1). However, mean V
T
was higher,
whereas mean RR was lower during PSV. Ppeak during
BIPAP+SB
controlled
and PSV were comparable. The time
spent during inspiration was proportionally shorter in
BIPAP+SB
mean
than PSV, as reflected by Ti/Tot. Pmean dur-
ing BIPAP+SB
mean
did not differ from PSV. However,
Pmean and Ppl mean were higher during BIPAP+SB
controlled
and lower during BIPAP+SB
spont
as compared with PSV.
PEEP
i,dyn
values did not differ between assisted mechanical
ventilation modes, but values of P
0.1
and PTP were higher
during BIPAP+SB
mean
compared with PSV.
Arterial oxygenation and hemodynamic variables did not
differ between the assisted mechanical ventilation modes,
Gama de Abreu et al. Critical Care 2010, 14:R34
/>Page 4 of 12
Table 1: Respiratory parameters
Baseline Injury PSV BIPAP+SB
mean
BIPAP+SB
controlled
BIPAP+SB
spont
MV (L/min) 5.1 ± 1.7 4.1 ± 1.7 6.6 ± 1.9 6.2 ± 2.1 2.3 ± 0.9
†,‡
4.0 ± 2.2
†,‡,§
V
T
(mL) 347 ± 58 349 ± 61 202 ± 48 129 ± 40
†
255 ± 103 97 ± 34
†,‡,§
RR (/min) 15 ± 4 14 ± 4 34 ± 11 51 ± 17
†
9 ± 3
†,‡
43 ± 17
†,‡,§
Ti/Ttot 0.49 ± 0.01 0.49 ± 0.01 0.33 ± 0.05 0.24 ± 0.08
†
0.26 ± 0.06
†,‡
Ppeak (cmH
2
O) 20 ± 2 34 ± 3 * 23 ± 2 24 ± 3
P
aw
mean (cmH
2
O) 11 ± 1 15 ± 1 * 9 ± 1 9 ± 1 14 ± 2
†,‡
5 ± 1
†,‡,§
Ppl mean (cmH
2
O) 3 ± 2 7 ± 2 * 2 ± 1 2 ± 1 6 ± 3
†,‡
1 ± 1
†,‡,§
PEEP
i,dyn
(cmH
2
O) 1 ± 1 1 ± 1
PTP (cmH
2
O.s.min
-1
) 7 ± 5 91 ± 54
†
P0.1 (cmH
2
O) 1 ± 1 3 ± 1
†
Values are given as mean ± standard deviation; baseline, before induction of acute lung injury; injury, after induction of acute lung injury. The contributions of spontaneous and controlled
breaths to BIPAP+SB
mean
were weighted by their respective rates (weighted mean). * P < 0.05 vs. Baseline;
†
P < 0.05 vs. PSV;
‡
P < 0.05 vs. BIPAP+SB
mean
;
§
P < 0.05 vs. BIPAP+SB
contolled
.
BIPAP+SB
controlled
, controlled breath cycles during BIPAP+SB
mean
; BIPAP+SB
mean
, biphasic positive airway pressure + spontaneous breathing; BIPAP+SB
spont
, spontaneous breath cycles during
BIPAP+SB
spont
; MV, minute volume; P
0.1
, airway pressure generated 100 ms after onset of an occluded inspiratory effort; P
aw
mean, mean airway pressure; PEEP
i,dyn
, dynamic intrinsic end-
expiratory pressure; Ppeak, peak airway pressure; Ppl mean, mean transpulmonary pressure; PSV, pressure support ventilation; PTP, inspiratory esophageal pressure time product; RR, respiratory
rate; Ti/Ttot, inspiratory to total respiratory time; V
T
, tidal volume.
Gama de Abreu et al. Critical Care 2010, 14:R34
/>Page 5 of 12
but PaCO
2
was higher during BIPAP+SB
mean
than PSV
(Table 2).
The statistical analysis evidenced no effect of the
sequence of ventilation modes on the hyperaerated, nor-
mally aerated, poorly aerated, and nonaerated compart-
ments at end-expiration. The Additional files 2 and 3 show
CT
dyn
videos of lungs during BIPAP+SB
mean
and PSV in
one animal, respectively.
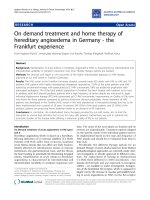
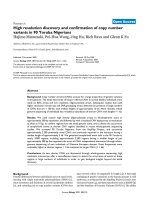
During BIPAP+SB
mean
and PSV, we observed at end-
expiration and end-inspiration (Figures 1 and 2, respec-
tively) a gravity-dependent loss of lung aeration, character-
ized by increase of nonaerated and poorly aerated areas, as
well as decrease in hyperaerated and normally aerated tis-
sue in dorsal zones, as compared with ventral ones (P <
0.0001). Similarly, the percentages of nonaerated and
poorly aerated areas increased, whereas those from nor-
mally aerated and hyperaerated areas decreased from lung
apex to base following the gravitational gradient, indepen-
dent from the assisted mechanical ventilation mode and
lung zone (P < 0.0001).
Compared with PSV, BIPAP+SB
controlled
and BIPAP+SB
s-
pont
resulted in a reduction of the percentage of nonaeration
at end-expiration at the lung base (Figure 1, P < 0.05). At
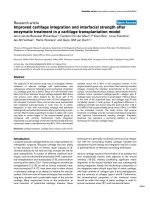
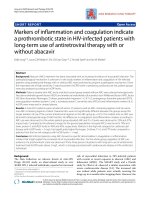
end-inspiration, BIPAP+SB
mean
led to an increased percent-
age of normally aerated tissue at apex and hilum, as well as
reduced poorly aerated and nonaerated tissue at apex and
base, respectively, mainly during controlled breaths (Figure
2, P < 0.05). The distribution of aeration during
BIPAP+SB
controlled
and BIPAP+SB
spont
was comparable at
end-expiration, as well as end-inspiration (Figures 1 and 2,
respectively).
Table 2: Gas exchange and hemodynamic variables
Baseline Injury PSV BIPAP+SB
mean
Gas exchange
PaO
2
/FIO
2
(mmHg)
513 ± 62
(489.6-547.2)
119 ± 30*
(92.0-143.1)
264 ± 127
(136.0-378.7)
246 ± 112
(143.1-332.5)
(%)
5.5 ± 1.4
(4.4-6.5)
33.9 ± 12.8*
(24.7-39.7)
16.9 ± 10.4
(6.7-24.3)
19.8 ± 12.1
(11.6-28.7)
PaCO
2
(mmHg)
34 ± 6
(29.4-39.7)
39 ± 8*
(30.1-46.5)
48 ± 6
(44.2-55.2)
59 ± 13
†
(46.9-66.2)
Hemodynamics
CO
(L/min)
3.2 ± 0.8
(2.4-3.8)
3 ± 0.8
(2.3-3.8)
4.3 ± 1.4
(2.8-5.3)
4.2 ± 1.2
(3.2-5.2)
HR
(/min)
77 ± 13
(69-83)
75 ± 12
(65-86)
91 ± 18
(83-100)
91 ± 19
(77-110)
MAP
(mmHg)
73 ± 9
(67-79)
69 ± 12
(62-75)
75 ± 8
(71-77)
79 ± 14
(68-98)
MPAP
(mmHg)
22 ± 4
(20-24)
30 ± 5*
(27-32)
31 ± 5
(26-35)
33 ± 6
(30-36)
CVP
(mmHg)
10 ± 3
(8-12)
11 ± 2
(10-11)
9 ± 2
(8-10)
9 ± 2
(7-11)
PCWP
(mmHg)
13 ± 2
(12-14)
14 ± 2
(12-15)
13 ± 4
(11-14)
12 ± 2
(11-15)
Values are given as mean ± standard deviation. Baseline, before induction of acute lung injury; injury, after induction of acute lung injury. * P
< 0.05 vs. baseline;
†
P < 0.05 vs. PSV.
BIPAP+SB
mean
, biphasic positive airway pressure + spontaneous breathing; CO, cardiac output; CVP, central venous pressure; FiO
2
, fraction of
inspired oxygen; HR, heart rate; MAP, mean arterial pressure; MPAP, mean pulmonary arterial pressure; PaCO
2
, partial pressure of arterial
carbon dioxide; PaO
2
, partial pressure of arterial oxygen; PCWP, pulmonary artery occlusion pressure; PSV, pressure support ventilation;
, mixed venous admixture.
Q/Q
VA t
Q/Q
VA t
Gama de Abreu et al. Critical Care 2010, 14:R34
/>Page 6 of 12
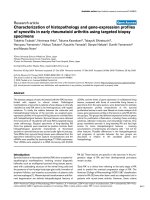
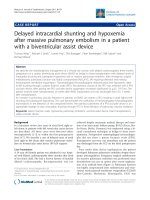
As shown in Figure 3, tidal reaeration had a gravity-
dependent pattern (P < 0.0001), increasing from ventral to
mid-dorsal (P < 0.0001), but decreasing from mid-dorsal to
dorsal zones (P < 0.0001). Compared with PSV,
BIPAP+SB
mean
induced less tidal reaeration in mid-dorsal
zones, mainly due to spontaneous breaths. Also, in dorsal
zones, tidal reaeration was more pronounced during PSV
than BIPAP+SB
spont
. On the other hand, tidal reaeration was
less marked during PSV than controlled breaths of
BIPAP+SB
mean
.
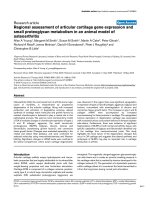
Tidal hyperaeration increased from dorsal to ventral lung
zones, as well as from apex to base (Figure 4, P < 0.0001
both). Tidal hyperaeration was decreased during
BIPAP+SB
mean
compared with PSV. In ventral zones of the
lung apex and base, tidal hyperaeration increased during
controlled but decreased during BIPAP+SB
spont
compared
with PSV.
Distribution of ventilation did not differ among the lung
levels, but was lowest in ventral and highest in mid-ventral
zones (P < 0.0001 both). No differences were observed
among PSV, BIPAP+SB
mean
, BIPAP+SB
controlled
and
BIPAP+SB
spont
(P = 1.0).
Discussion
In a surfactant depletion model of ALI, we found that
BIPAP+SB
mean
compared with PSV resulted in: lower mean
V
T
, comparable oxygenation and hemodynamics, and
increased PaCO
2
and inspiratory effort; less nonaerated
areas at end-expiration; decreased tidal hyperaeration and
reaeration; and similar distributions of relative ventilation.
During BIPAP+SB
mean
: BIPAP+SB
spont
had lower V
T
and
higher rate than BIPAP+SB
controlled
; BIPAP+SB
spont
and
BIPAP+SB
controlled
had similar distributions of ventilation
and aeration; BIPAP+SB
controlled
resulted in increased tidal
Figure 1 Distributions of hyperaerated (hyper), normally aerated (normal), poorly aerated (poorly) and nonaerated (non) compartments
at end-expiration during pressure support ventilation (PSV), biphasic positive pressure ventilation + spontaneous breaths (BIPAP+SB
mean
),
controlled (BIPAP+SB
controlled
) and spontaneous (BIPAP+SB
spont
) breath cycles. Calculations were performed for different lung zones from ven-
tral to dorsal (1 = ventral, 2 = mid-ventral, 3 = mid-dorsal, and 4 = dorsal) at lungs apex, hilum, and base using dynamic computed tomography. The
contributions of BIPAP+SB
spont
and BIPAP+SB
controlled
to BIPAP+SB
mean
were weighted by their respective rates (weighted mean). Bars and vertical lines
represent means and standard deviations, respectively. * P < 0.05 vs. PSV; † P < 0.05 vs. BIPAP+SB
controlled
.
0%
20%
40%
60%
80%
100%
1234
zone (ventral-dorsal)
hyper
normal
poorly
non
0%
20%
40%
60%
80%
100%
1234
zone (ventral-dorsal)
hyper
normal
poorly
non
0%
20%
40%
60%
80%
100%
1234
zone (ventral-dorsal)
hyper
normal
poorly
non
0%
20%
40%
60%
80%
100%
1234
zone (ventral-dorsal)
hyper
normal
poorly
non
0%
20%
40%
60%
80%
100%
1234
zone (ventral-dorsal)
hyper
normal
poorly
non
0%
20%
40%
60%
80%
100%
1234
zone (ventral-dorsal)
hyper
normal
poorly
non
0%
20%
40%
60%
80%
100%
1234
zone (ventral-dorsal)
hyper
normal
poorly
non
0%
20%
40%
60%
80%
100%
1234
zone (ventral-dorsal)
hyper
normal
poorly
non
0%
20%
40%
60%
80%
100%
1234
zone (ventral-dorsal)
hyper
normal
poorly
non
0%
20%
40%
60%
80%
100%
1234
zone (ventral-dorsal)
hyper
normal
poorly
non
0%
20%
40%
60%
80%
100%
1234
zone (ventral-dorsal)
hyper
normal
poorly
non
0%
20%
40%
60%
80%
100%
1234
zone (ventral-dorsal)
hyper
normal
poorly
non
Base Hilum Apex
*
**
PSV BIPAP+SB
mean
BIPAP+SB
controlled
BIPAP+SB
spont
0%
20%
40%
60%
80%
100%
1234
zone (ventral-dorsal)
hyper
normal
poorly
non
0%
20%
40%
60%
80%
100%
1234
zone (ventral-dorsal)
hyper
normal
poorly
non
0%
20%
40%
60%
80%
100%
1234
zone (ventral-dorsal)
hyper
normal
poorly
non
0%
20%
40%
60%
80%
100%
1234
zone (ventral-dorsal)
hyper
normal
poorly
non
0%
20%
40%
60%
80%
100%
1234
zone (ventral-dorsal)
hyper
normal
poorly
non
0%
20%
40%
60%
80%
100%
1234
zone (ventral-dorsal)
hyper
normal
poorly
non
0%
20%
40%
60%
80%
100%
1234
zone (ventral-dorsal)
hyper
normal
poorly
non
0%
20%
40%
60%
80%
100%
1234
zone (ventral-dorsal)
hyper
normal
poorly
non
0%
20%
40%
60%
80%
100%
1234
zone (ventral-dorsal)
hyper
normal
poorly
non
0%
20%
40%
60%
80%
100%
1234
zone (ventral-dorsal)
hyper
normal
poorly
non
0%
20%
40%
60%
80%
100%
1234
zone (ventral-dorsal)
hyper
normal
poorly
non
0%
20%
40%
60%
80%
100%
1234
zone (ventral-dorsal)
hyper
normal
poorly
non
Base Hilum Apex
*
**
PSV BIPAP+SB
mean
BIPAP+SB
controlled
BIPAP+SB
spont
Gama de Abreu et al. Critical Care 2010, 14:R34
/>Page 7 of 12
reaeration and hyperareation, compared with PSV.
BIPAP+SB
spont
showed an opposite pattern.
To our knowledge, this is the first study showing that
despite reduced nonaerated lung tissue during
BIPAP+SB
mean
compared with PSV, differences in tidal
reaeration and hyperaeration seem to be due only to lower
V
T
of spontaneous breaths, because the distribution ventila-
tion are comparable.
The present study differs from previous investigations on
BIPAP+SB
mean
and PSV [6,9-11] in that: CT
dyn
was used to
assess regional aeration during up to 60 seconds; no breath
holds at end-expiration or end-inspiration were used; and
both the mean P
aw
and minute ventilation were comparable
between BIPAP+SB
mean
and PSV. Different investigators
have used CT
dyn
to quantify lung aeration, detect tidal
recruitment and derecruitment, as well hyperaeration in
ALI/acute respiratory distress syndrome (ARDS) [8,16,17].
When negative intrapleural pressures are generated, CT
dyn
seems to be superior to static helical CT for quantifying
lung aeration at mid-expiration and mid-inspiration [18].
Furthermore, as V
T
during BIPAP+SB
mean
and PSV are not
constant [19], aeration measurements taken within a single
breath may be less representative of longer periods of venti-
lation.
Aeration compartments
Compared with PSV, BIPAP+SB
mean
reduced the percent-
age of nonaerated areas at end-expiration in dependent lung
zones, both BIPAP+SB
controlled
and BIPAP+SB
spont
. At end-
inspiration, the patterns of distribution of aeration were
similar between BIPAP+SB
mean
and PSV. Nonetheless,
BIPAP+SB
controlled
showed less poorly aerated and more
normally aerated percentages of lung tissue than
BIPAP+SB
mean
. Two mechanisms can explain these obser-
Figure 2 Distributions of hyperaerated (hyper), normally aerated (normal), poorly aerated (poorly) and nonaerated (non) compartments
at end-inspiration during pressure support ventilation (PSV), biphasic positive pressure ventilation + spontaneous breaths (BIPAP+SB-
mean
), controlled (BIPAP+SB
controlled
) and spontaneous (BIPAP+SB
spont
) breath cycles. Calculations were performed for different lung zones from
ventral to dorsal (1 = ventral, 2 = mid-ventral, 3 = mid-dorsal, and 4 = dorsal) at lungs apex, hilum, and base using dynamic computed tomography.
The contributions of BIPAP+SB
spont
and BIPAP+SB
controlled
to BIPAP+SB
mean
were weighted by their respective rates (weighted mean). Bars and vertical
lines represent means and standard deviations, respectively. * P < 0.05 vs. PSV; † P < 0.05 vs. BIPAP+SB
controlled
.
0%
20%
40%
60%
80%
100%
1234
zone (ventral-dorsal)
hyper
normal
poorly
non
0%
20%
40%
60%
80%
100%
1234
zone (ventral-dorsal)
hyper
normal
poorly
non
0%
20%
40%
60%
80%
100%
1234
zone (ventral-dorsal)
hyper
normal
poorly
non
0%
20%
40%
60%
80%
100%
1234
zone (ventral-dorsal)
hyper
normal
poorly
non
0%
20%
40%
60%
80%
100%
1234
zone (ventral-dorsal)
hyper
normal
poorly
non
0%
20%
40%
60%
80%
100%
1234
zone (ventral-dorsal)
hyper
normal
poorly
non
0%
20%
40%
60%
80%
100%
1234
zone (ventral-dorsal)
hyper
normal
poorly
non
0%
20%
40%
60%
80%
100%
1234
zone (ventral-dorsal)
hyper
normal
poorly
non
0%
20%
40%
60%
80%
100%
1234
zone (ventral-dorsal)
hyper
normal
poorly
non
0%
20%
40%
60%
80%
100%
1234
zone (ventral-dorsal)
hyper
normal
poorly
non
0%
20%
40%
60%
80%
100%
1234
zone (ventral-dorsal)
hyper
normal
poorly
non
0%
20%
40%
60%
80%
100%
1234
zone (ventral-dorsal)
hyper
normal
poorly
non
Base Hilum Apex
†
*
*
*
*
†
†
†
†
†
†
†
PSV BIPAP+SB
mean
BIPAP+SB
controlled
BIPAP+SB
spont
0%
20%
40%
60%
80%
100%
1234
zone (ventral-dorsal)
hyper
normal
poorly
non
0%
20%
40%
60%
80%
100%
1234
zone (ventral-dorsal)
hyper
normal
poorly
non
0%
20%
40%
60%
80%
100%
1234
zone (ventral-dorsal)
hyper
normal
poorly
non
0%
20%
40%
60%
80%
100%
1234
zone (ventral-dorsal)
hyper
normal
poorly
non
0%
20%
40%
60%
80%
100%
1234
zone (ventral-dorsal)
hyper
normal
poorly
non
0%
20%
40%
60%
80%
100%
1234
zone (ventral-dorsal)
hyper
normal
poorly
non
0%
20%
40%
60%
80%
100%
1234
zone (ventral-dorsal)
hyper
normal
poorly
non
0%
20%
40%
60%
80%
100%
1234
zone (ventral-dorsal)
hyper
normal
poorly
non
0%
20%
40%
60%
80%
100%
1234
zone (ventral-dorsal)
hyper
normal
poorly
non
0%
20%
40%
60%
80%
100%
1234
zone (ventral-dorsal)
hyper
normal
poorly
non
0%
20%
40%
60%
80%
100%
1234
zone (ventral-dorsal)
hyper
normal
poorly
non
0%
20%
40%
60%
80%
100%
1234
zone (ventral-dorsal)
hyper
normal
poorly
non
Base Hilum Apex
†
*
*
*
*
†
†
†
†
†
†
†
PSV BIPAP+SB
mean
BIPAP+SB
controlled
BIPAP+SB
spont
Gama de Abreu et al. Critical Care 2010, 14:R34
/>Page 8 of 12
vations. First, spontaneous breathing may have favored
recruitment of more dependent zones at end-expiration,
with effects being preserved during controlled breaths. This
hypothesis is supported by increased PTP and Ppl mean
during BIPAP+SB
mean
compared with PSV. Second,
BIPAP+SB
controlled
generated higher products of P
aw
in time
during inspiration, as shown by our data, thus promoting
recruitment of lung zones with increased time constants,
with effects being preserved during BIPAP+SB
spont
. Indeed,
it has been shown that in controlled ventilation the more tis-
sue is recruited at end-inspiration, the more tissue remains
recruited at end-expiration [20]. On the other hand, the
amount of hyperaeration at end-inspiration was higher dur-
ing BIPAP+SB
controlled
than PSV, despite comparable Ppeak.
The most probable explanation is that Pmean was higher
during BIPAP+SB
controlled
than PSV. Another likely expla-
nation is that the gas volume at end-expiration was higher,
as suggested by lower percentages of nonaerated areas dur-
ing BIPAP+SB
mean
, generating an overall shift towards
more aeration. Accordingly, hyperaeration was more local-
ized in non-dependent lung zones. However, mean hyper-
aeration at end-inspiration was comparable between
BIPAP+SB
mean
and PSV, due to less hyperaeration during
BIPAP+SB
spont
.
Tidal reaeration and hyperaeration
Tidal recruitment or reaeration and tidal hyperaeration have
been proposed to reflect the phenomena of cyclic collapse/
reopening and overdistension of lung units in ALI/ARDS
[14,21], which are important risk factors for ventilator-
Figure 3 Tidal reaeration during pressure support ventilation (PSV), biphasic positive pressure ventilation + spontaneous breaths (BI-
PAP+SB
mean
), controlled (BIPAP+SB
controlled
) and spontaneous (BIPAP+SB
spont
) breath cycles. Calculations were performed for different lung
zones from ventral to dorsal (1 = ventral, 2 = mid-ventral, 3 = mid-dorsal, and 4 = dorsal) at lungs apex, hilum, and base using dynamic computed
tomography. The contributions of BIPAP+SB
spont
and BIPAP+SB
controlled
to BIPAP+SB
mean
were weighted by their respective rates (weighted mean). Bars
and vertical lines represent means and standard deviations, respectively. * P < 0.05 vs. PSV; † P < 0.05 vs. BIPAP+SB
controlled
.
0
10
20
30
40
50
1 2 3 4 1 2 3 4
tidal reaeration (%)
0
10
20
30
40
50
1 2 3 4 1 2 3 4
tidal reaeration (%)
0
10
20
30
40
50
1 2 3 4 1 2 3 4
tidal reaeration (%)
Base Hilum Apex
zone (ventral-dorsal) zone (ventral-dorsal)
zone (ventral-dorsal) zone (ventral-dorsal)
zone (ventral-dorsal) zone (ventral-dorsal)
0
10
20
30
40
50
1 2 3 4 1 2 3 4
tidal reaeration (%)
zone (ventral-dorsal) zone (ventral-dorsal)
0
10
20
30
40
50
1 2 3 4 1 2 3 4
tidal reaeration (%)
0
10
20
30
40
50
1 2 3 4 1 2 3 4
tidal reaeration (%)
zone (ventral-dorsal) zone (ventral-dorsal)
zone (ventral-dorsal) zone (ventral-dorsal)
*
*,†
*
*†
*,†
*,†
*,†
†
†
†
PSV BIPAP+SB
mean
BIPAP+SB
controlled
BIPAP+SB
spont
0
10
20
30
40
50
1 2 3 4 1 2 3 4
tidal reaeration (%)
0
10
20
30
40
50
1 2 3 4 1 2 3 4
tidal reaeration (%)
0
10
20
30
40
50
1 2 3 4 1 2 3 4
tidal reaeration (%)
Base Hilum Apex
zone (ventral-dorsal) zone (ventral-dorsal)zone (ventral-dorsal) zone (ventral-dorsal)
zone (ventral-dorsal) zone (ventral-dorsal)zone (ventral-dorsal) zone (ventral-dorsal)
zone (ventral-dorsal) zone (ventral-dorsal)zone (ventral-dorsal) zone (ventral-dorsal)
0
10
20
30
40
50
1 2 3 4 1 2 3 4
tidal reaeration (%)
zone (ventral-dorsal) zone (ventral-dorsal)zone (ventral-dorsal) zone (ventral-dorsal)
0
10
20
30
40
50
1 2 3 4 1 2 3 4
tidal reaeration (%)
0
10
20
30
40
50
1 2 3 4 1 2 3 4
tidal reaeration (%)
zone (ventral-dorsal) zone (ventral-dorsal)zone (ventral-dorsal) zone (ventral-dorsal)
zone (ventral-dorsal) zone (ventral-dorsal)zone (ventral-dorsal) zone (ventral-dorsal)
*
*,†
*
*†
*,†
*,†
*,†
†
†
†
PSV BIPAP+SB
mean
BIPAP+SB
controlled
BIPAP+SB
spont
Gama de Abreu et al. Critical Care 2010, 14:R34
/>Page 9 of 12
associated lung injury [22]. Recruitment occurs mainly in
nonaerated tissue [21], but seems to also take place in the
poorly aerated tissue [14]. Tidal reaeration and hyperaera-
tion have been described during studies on controlled
mechanical ventilation [14,21,23,24], but data during
assisted mechanical ventilation are scarce. Wrigge and col-
leagues [8] reported in an oleic acid model of ALI, more
aeration and less tidal recruitment in dependent lung zones
during BIPAP+SB
mean
compared with pressure-controlled
ventilation. However, other forms of assisted mechanical
ventilation were not addressed. We found that mean tidal
hyperaeration and reaeration were less pronounced during
BIPAP+SB than PSV. However, when analyzed separately,
we found that BIPAP+SB
controlled
were associated with
increased tidal hyperaeration and reaeration compared with
PSV, whereas BIPAP+SB
spont
showed the opposite pattern.
As mean V
T
and Ppl were lower during BIPAP+SB
spont
than
BIPAP+SB
controlled
, BIPAP+SB
mean
could be claimed to be
more lung protective than PSV due to lower mean distend-
ing volumes/pressures during spontaneous breathing. On
the other hand, Plpl, tidal hyperaeration and reaeration were
more pronounced during BIPAP+SB
controlled
than PSV.
Thus, the phenomena of cyclic collapse-reopening and
overdistension may be more significant if the proportion of
controlled to spontaneous breaths during BIPAP+SB
mean
is
high. Furthermore, RR was higher during BIPAP+SB
mean
compared with PSV, which may favor lung injury [25]. Our
findings raise the question on how much spontaneous
breathing should be allowed or used during BIPAP+SB
mean
to improve respiratory function and reduce ventilator-asso-
Figure 4 Tidal hyperaeration during pressure support ventilation (PSV), biphasic positive pressure ventilation + spontaneous breaths (BI-
PAP+SB
mean
), controlled (BIPAP+SB
controlled
) and spontaneous (BIPAP+SB
spont
) breath cycles. Calculations were performed for different lung
zones from ventral to dorsal (1 = ventral, 2 = mid-ventral, 3 = mid-dorsal, and 4 = dorsal) at lungs apex, hilum, and base using dynamic computed
tomography. The contributions of BIPAP+SB
spont
and BIPAP+SB
controlled
to BIPAP+SB
mean
were weighted by their respective rates (weighted mean). Bars
and vertical lines represent means and standard deviations, respectively. * P < 0.05 vs. PSV; † P < 0.05 vs. BIPAP+SB
controlled
.
0
5
10
15
1 2 3 4 1 2 3 4
tidal hyperaeration (%)
Base Hilum Apex
zone (ventral-dorsal) zone (ventral-dorsal)
zone (ventral-dorsal) zone (ventral-dorsal)
zone (ventral-dorsal) zone (ventral-dorsal) zone (ventral-dorsal) zone (ventral-dorsal)
zone (ventral-dorsal) zone (ventral-dorsal)
zone (ventral-dorsal) zone (ventral-dorsal)
0
5
10
15
1 2 3 4 1 2 3 4
tidal hyperaeration (%)
0
5
10
15
1 2 3 4 1 2 3 4
tidal hyperaeration (%)
0
5
10
15
1 2 3 4 1 2 3 4
tidal hyperaeration (%)
0
5
10
15
1 2 3 4 1 2 3 4
tidal hyperaeration (%)
0
5
10
15
1 2 3 4 1 2 3 4
tidal hyperaeration (%)
*
*
*
*
*,†
†
†
†
†
†
PSV BIPAP+SB
mean
BIPAP+SB
controlled
BIPAP+SB
spont
0
5
10
15
1 2 3 4 1 2 3 4
tidal hyperaeration (%)
Base Hilum Apex
zone (ventral-dorsal) zone (ventral-dorsal)zone (ventral-dorsal) zone (ventral-dorsal)
zone (ventral-dorsal) zone (ventral-dorsal)zone (ventral-dorsal) zone (ventral-dorsal)
zone (ventral-dorsal) zone (ventral-dorsal)zone (ventral-dorsal) zone (ventral-dorsal) zone (ventral-dorsal) zone (ventral-dorsal)zone (ventral-dorsal) zone (ventral-dorsal)
zone (ventral-dorsal) zone (ventral-dorsal)zone (ventral-dorsal) zone (ventral-dorsal)
zone (ventral-dorsal) zone (ventral-dorsal)zone (ventral-dorsal) zone (ventral-dorsal)
0
5
10
15
1 2 3 4 1 2 3 4
tidal hyperaeration (%)
0
5
10
15
1 2 3 4 1 2 3 4
tidal hyperaeration (%)
0
5
10
15
1 2 3 4 1 2 3 4
tidal hyperaeration (%)
0
5
10
15
1 2 3 4 1 2 3 4
tidal hyperaeration (%)
0
5
10
15
1 2 3 4 1 2 3 4
tidal hyperaeration (%)
*
*
*
*
*,†
†
†
†
†
†
PSV BIPAP+SB
mean
BIPAP+SB
controlled
BIPAP+SB
spont
Gama de Abreu et al. Critical Care 2010, 14:R34
/>Page 10 of 12
ciated lung injury. However, it was beyond the scope of this
work to determine the impact of BIPAP+SB
mean
and PSV
on lung injury.
Distribution of ventilation and gas exchange
As BIPAP+SB
mean
was associated with increased inspira-
tory effort, we expected the relative ventilation to be higher
with that mode in the most dependent lung zones compared
with PSV [26]. However, the distribution of ventilation was
similar during BIPAP+SB
mean
and PSV, both during sponta-
neous and controlled breaths. The most likely explanation
is that although the inspiratory transpulmonary pressures in
dependent zones increased aeration during BIPAP+SB
mean
compared with PSV, the impedance to ventilation was
likely to not be changed and shift of relative ventilation did
not occur.
As the percentage of nonaerated areas was decreased dur-
ing BIPAP+SB
mean
compared with PSV, we expected an
improvement in oxygenation. However PaO
2
/FIO
2
and
venous admixture were comparable between modes, sug-
gesting that hypoxic vasoconstriction most likely played a
role. BIPAP+SB
mean
results in increased redistribution of
pulmonary blood flow from dorsal to ventral zones [11].
Two possible mechanisms may explain limited carbon
dioxide exchange during BIPAP+SB
mean
compared with
PSV, despite similar minute ventilation. First, total alveolar
ventilation was reduced due low V
T
in spontaneous breaths.
Second, during controlled breaths, higher dead space due to
increased hyperaerated areas may have occurred.
Limitations
This study has several limitations. First, the surfactant
depletion model does not reproduce all features of clinical
ALI and extrapolation of our results to the clinical scenario
is limited. Second, artifacts introduced by the cranial-cau-
dal movement of lungs were not compensated during calcu-
lations of aeration by CT
dyn
, and levels chosen for the slices
may have slightly differed between ventilation modes.
However, measurements were performed at three different
lung levels and we did observe regional differences. Fur-
thermore, the levels used for CT scans were referred to ana-
tomical landmarks (carina), likely reducing such artifacts.
Third, tidal aeration and hyperaeration calculations were of
volumetric nature. As hyperaerated areas have proportion-
ally low mass, the absolute amount of lung tissue undergo-
ing cyclic hyperaeration may be reduced. On the other
hand, the thresholds for CT compartments most likely
resulted in underestimation of hyperaeration in ALI, but
they correspond to those internationally recommended
[27,28]. Fourth, the assessment of relative ventilation by
changes in CT densities may have been skewed by move-
ment of gas within structures with limited participation in
gas exchange, like small airways. Nevertheless, stress/strain
of those structures seems to play an important role in venti-
lator-induced lung injury [29]. Fifth, we did not determine
the impact of BIPAP+SB
mean
and PSV on lung mechanical
stress and inflammation directly. However, in experimental
ALI, tidal hyperaeration and reaeration seem to be closely
related to overdistension and collapse/reopening of lung
units, respectively [12,14,30].
Conclusions
In this model of ALI, the reduction of tidal reaeration and
hyperaeration during BIPAP+SB
mean
compared with PSV is
not due to decreased nonaerated areas at end-expiration or
different distribution of ventilation, but to lower V
T
during
BIPAP+SB
spont
.
Key messages
• Compared with PSV, BIPAP+SB
mean
resulted in: lower
mean V
T
, comparable oxygenation and hemodynamics,
and increased PaCO
2
and inspiratory effort; less nonaer-
ated areas at end-expiration; decreased tidal hyperaera-
tion and reaeration; similar distributions of relative
ventilation.
• During BIPAP+SB
mean
: BIPAP+SB
spont
had lower V
T
and
higher rate than BIPAP+SB
controlled
; BIPAP+SB
spont
and
BIPAP+SB
controlled
had similar distributions of ventilation
and aeration; BIPAP+SB
controlled
resulted in increased
tidal reaeration and hyperareation, compared with PSV,
while BIPAP+SB
spont
showed an opposite pattern.
• The ratio between spontaneous to controlled breaths could
play an important role in reducing tidal reaeration and
hyperaeration during BIPAP+SB
mean
.
Additional material
Abbreviations
ALI: acute lung injury; ARDS: acute respiratory distress syndrome; BIPAP+SB
con-
trolled
: time-cycled controlled breaths at two levels of continuous positive air-
Additional file 1 Calculation of mean airway pressures. This file shows
exactly how the mean airway pressures were calculated for the different
modes of assisted ventilation, including the spontaneous and controlled
cycles of biphasic positive airway pressure + spontaneous breathing
(BIPAP+SB
mean
).
Additional file 2 Dynamic computed tomography in a representative
animal during biphasic positive airway pressure + spontaneous
breathing (BIPAP+SB
mean
). This video shows a dynamic computed
tomography scan (grey scale) of the chest taken for approximately 60 sec-
onds at the hilus in one representative animal during assisted ventilation
with BIPAP+SB
mean
. Acute lung injury was induced by surfactant depletion.
See Additional file 3 for comparison with pressure support ventilation (PSV).
Additional file 3 Dynamic computed tomography in a representative
animal during pressure support ventilation (PSV). This video shows a
dynamic computed tomography scan (grey scale) of the chest taken for
approximately 60 seconds at the hilus in a representative animal during
assisted ventilation with PSV. Acute lung injury was induced by surfactant
depletion. See Additional file 2 for comparison with biphasic positive airway
pressure + spontaneous breathing (BIPAP+SB
mean
).
Gama de Abreu et al. Critical Care 2010, 14:R34
/>Page 11 of 12
way pressure during BIPAP+SB
mean
; BIPAP+SB
mean
: biphasic positive airway
pressure with non-assisted spontaneous breathing; BIPAP+SB
spont
: non-assisted
spontaneous breathing during BIPAP+SB
mean
; CT: computed tomography;
CT
dyn
: dynamic computed tomography; FiO
2
: fraction of inspired oxygen; HU:
Hounsfield units; I:E: inspiratory:expiratory ratio; P
0.1
: decay in airway pressure
100 ms after begin of the inspiration; PaCO
2
: partial pressure of arterial carbon
dioxide; PaO
2
: partial pressure of arterial oxygen; P
aw
: airway pressure; PEEP:
positive end-expiratory pressure; PEEP
i,dyn
: dynamic intrinsic end-expiratory
pressure; Pmean: mean airway pressure; Ppeak: peak airway pressure; Ppl
mean: mean transpulmonary pressure; PSV: pressure support ventilation; PTP:
pressure versus time product of the inspiratory esophageal pressure; RR: respi-
ratory rate; Ti/Ttot: inspiratory to total respiratory time; V
T
: tidal volume.
Competing interests
The authors declare that they have no competing interests.
Authors' contributions
All authors made substantial contribution to the study design. MGA and MC
drafted the manuscript and helped to perform the experiments. PM, ARC and
CS helped to perform the experiments and contributed to drafting the manu-
script. MC and VH developed the software for analysis of dynamic computed
tomography scans and helped to draft the manuscript. BW performed the
more complex multivariate statistical analysis and helped to draft the manu-
script. All other authors revised the manuscript for important intellectual con-
tent. All authors approved the final version of the manuscript for publication.
Acknowledgements
This work was supported, in part, by a research grant of the European Society
of Anaesthesiology (ESA), Brussels, Belgium. We are indebted to the students of
the Pulmonary Engineering Group of the Department of Anesthesiology and
Intensive Care Therapy, University Hospital Carl Gustav Carus, Technical Univer-
sity of Dresden, Germany, for their support during the experiments.
Author Details
1
Pulmonary Engineering Group, Department of Anaesthesiology and Intensive
Care Therapy, University Hospital Carl Gustav Carus, Technical University of
Dresden, Fetscherstr. 74, 01307 Dresden, Germany,
2
Department of
Anaesthesiology and Intensive Care Therapy, University Hospital Carl Gustav
Carus, Technical University of Dresden, Fetscherstr. 74, 01307 Dresden,
Germany,
3
Institute of Radiology, University Hospital Carl Gustav Carus,
Technical University of Dresden, Fetscherstr. 74, 01307 Dresden, Germany,
4
Institute of Medical Informatics and Biometry, Medical Faculty Carl Gustav
Carus, Technical University of Dresden, Löscherstr. 18, 01309 Dresden, Germany
,
5
Department of Ambient, Health and Safety, University of Insubria, Servizio di
Anestesia B, Ospedale di Circolo e Fondazione Macchi viale Borri 57, 21100
Varese, Italy and
6
Clinical Sensoring and Monitoring, Department of
Anaesthesiology and Intensive Care Therapy, University Hospital Carl Gustav
Carus, Technical University of Dresden, Fetscherstr. 74, 01307 Dresden,
Germany
References
1. Putensen C, Hering R, Muders T, Wrigge H: Assisted breathing is better in
acute respiratory failure. Curr Opin Crit Care 2005, 11:63-68.
2. Putensen C, Zech S, Wrigge H, Zinserling J, Stuber F, von Spiegel T, Mutz
N: Long-term effects of spontaneous breathing during ventilatory
support in patients with acute lung injury. Am J Respir Crit Care Med
2001, 164:43-49.
3. Esteban A, Ferguson ND, Meade MO, Frutos-Vivar F, Apezteguia C,
Brochard L, Raymondos K, Nin N, Hurtado J, Tomicic V, González M,
Elizalde J, Nightingale P, Abroug F, Pelosi P, Arabi Y, Moreno R, Jibaja M,
D'Empaire G, Sandi F, Matamis D, Montañez AM, Anzueto A, VENTILA
Group: Evolution of mechanical ventilation in response to clinical
research. Am J Respir Crit Care Med 2008, 177:170-177.
4. Seymour CW, Frazer M, Reilly PM, Fuchs BD: Airway pressure release and
biphasic intermittent positive airway pressure ventilation: Are they
ready for prime time? J Trauma 2007, 62:1298-1309.
5. Chiumello D, Pelosi P, Calvi E, Bigatello LM, Gattinoni L: Different modes
of assisted ventilation in patients with acute respiratory failure. Eur
Respir J 2002, 20:925-933.
6. Putensen C, Mutz N, Putensen-Himmer G, Zinserling J: Spontaneous
breathing during ventilatory support improves ventilation-perfusion
distributions in patients with acute respiratory distress syndrome. Am
J Respir Crit Care Med 1999, 159:1241-1248.
7. Wrigge H, Zinserling J, Neumann P, Defosse J, Magnusson A, Putensen C,
Hedenstierna G: Spontaneous breathing improves lung aeration in
oleic acid-induced lung injury. Anesthesiology 2003, 99:376-384.
8. Wrigge H, Zinserling J, Neumann P, Muders T, Magnusson A, Putensen C,
Hedenstierna G: Spontaneous breathing with airway pressure release
ventilation favors ventilation in dependent lung regions and counters
cyclic alveolar collapse in oleic-acid-induced lung injury: a randomized
controlled computed tomography trial. Crit Care 2005, 9:R780-R789.
9. Henzler D, Pelosi P, Bensberg R, Dembinski R, Quintel M, Pielen V, Rossaint
R, Kuhlen R: Effects of partial ventilatory support modalities on
respiratory function in severe hypoxemic lung injury. Crit Care Med
2006, 34:
1738-1745.
10. Yoshida T, Rinka H, Kaji A, Yoshimoto A, Arimoto H, Myiaichi T, Kan M: The
impact of spontaneous ventilation on distribution of lung aeration in
patients with acute respiratory distress syndrome: airway pressure
release ventilation versus pressure support ventilation. Anesth Analg
2009, 109:1892-1900.
11. Gama de Abreu M, Spieth P, Pelosi P, Carvalho AR, Walter C, Schreiber-
Ferstl A, Aikele P, Neykova B, Hübler M, Koch T: Noisy pressure support
ventilation: A pilot study on a new assisted ventilation mode in
experimental lung injury. Crit Care Med 2008, 36:818-827.
12. Carvalho AR, Spieth PM, Pelosi P, Vidal Melo MF, Koch T, Jandre FC,
Giannella-Neto A, Gama de Abreu M: Ability of dynamic airway pressure
curve profile and elastance for positive end-expiratory pressure
titration. Intensive Care Med 2008, 34:2291-2299.
13. Puybasset L, Cluzel P, Gusman P, Grenier P, Preteux F, Rouby JJ, the CT
Scan ARDS Study Group: Regional distribution of gas and tissue in acute
respiratory distress syndrome. I. Consequences for lung morphology.
Intensive Care Med 2000, 26:857-869.
14. Malbouisson LM, Muller JC, Constantin JM, LU Q, Puybasset L, Rouby JJ,
the CT Scan ARDS Study Group: Computed tomography assessment of
positive end-expiratory pressure-induced alveolar recruitment in
patients with acute respiratory distress syndrome. Am J Respir Crit Care
Med 2001, 163:1444-1450.
15. Lachmann B, Robertson B, Vogel J: In vivo lung lavage as an
experimental model of the respiratory distress syndrome. Acta
Anaesthesiol Scand 1980, 24:231-236.
16. Markstaller K, Karmrodt J, Doebrich M, Wolcke B, Gervais H, Weiler N,
Thelen M, Dick W, Kauczor HU, Eberle B: Dynamic computed
tomography: a novel technique to study lung aeration and atelectasis
formation during experimental CPR. Resuscitation 2002, 53:307-313.
17. David M, Karmrodt J, Bletz C, David S, Herweling A, Kauczor HU,
Markstaller K: Analysis of atelectasis, ventilated, and hyperinflated lung
during mechanical ventilation by dynamic CT. Chest 2005,
128:3757-3770.
18. Helm E, Talakoub O, Grasso F, Engelberts D, Alirezaie J, Kavanagh BP,
Babyn P: Use of dynamic CT in acute respiratory distress syndrome
(ARDS) with comparison of positive and negative pressure ventilation.
Eur Radiol 2009, 19:50-57.
19. Gama de Abreu M, Spieth P, Pelosi P, Carvalho AR, Walter C, Schreiber-
Ferstl A, Aikele P, Neykova B, Hübler M, Koch T: Noisy pressure support
ventilation: a pilot study on a new assisted ventilation mode in
experimental lung injury. Crit Care Med 2008, 36:818-827.
20. Pelosi P, Goldner M, McKibben A, Adams A, Eccher G, Caironi P, Losappio
S, Gattinoni L, Marini JJ: Recruitment and derecruitment during acute
respiratory failure: an experimental study. Am J Respir Crit Care Med
2001, 164:122-130.
21. Gattinoni L, Pelosi P, Crotti S, Valenza F: Effects of positive end-expiratory
pressure on regional distribution of tidal volume and recruitment in
adult respiratory distress syndrome. Am J Respir Crit Care Med 1995,
151:1807-1814.
22. dos Santos CC, Slutsky A: The contribution of biophysical lung injury to
the development of biotrauma. Annu Rev Physiol 2006, 68:585-618.
23. Lu Q, Malbouisson L, Mourgeon E, Goldstein I, Coriat P, Rouby JJ:
Assessment of PEEP-induced reopening of collapsed lung regions in
Received: 21 September 2009 Revised: 29 December 2009
Accepted: 16 March 2010 Published: 16 March 2010
This article is available from: 2010 Gama de Abreu et al.; licensee BioMed Central Ltd. This is an open access article distributed under the terms of the Creative Commons Attribution License ( which permits unrestricted use, distribution, and reproduction in any medium, provided the original work is properly cited.Critica l Care 2010, 14:R 34
Gama de Abreu et al. Critical Care 2010, 14:R34
/>Page 12 of 12
acute lung injury: are one or three CT sections representative of the
entire lung? Intensive Care Med 2001, 27:1504-1510.
24. Terragni PP, Rosboch G, Tealdi A, Corno E, Menaldo E, Davini O, Gandini G,
Herrmann P, Mascia L, Quintel M, Slutsky AS, Gattinoni L, Ranieri VM: Tidal
hyperinflation during low tidal volume ventilation in acute respiratory
distress syndrome. Am J Respir Crit Care Med 2007, 175:160-166.
25. Hotchkiss JR, Blanch L, Murias G, Adams AB, Olson DA, Wangesteen DO,
Leo PH, Marini JJ: Effects of decreased respiratory frequency on
ventilator-induced lung injury. Am J Respir Crit Care Med 2000,
161:463-468.
26. Putensen C, Wrigge H: Clinical review: Biphasic positive airway pressure
and airway pressure release ventilation. Crit Care 2004, 8:492-497.
27. Gattinoni L, Caironi P, Pelosi P, Goodman LR: What has computed
tomography taught us about the acute respiratory distress syndrome?
Am J Respir Crit Care Med 2001, 164:1701-1711.
28. Rouby JJ, Puybasset L, Nieszkowska A, Lu Q: Acute respiratory distress
syndrome: lessons from computed tomography of the whole lung. Crit
Care Med 2003, 31:S285-S295.
29. Jain M, Sznajder JI: Bench-to-bedside review: Distal airways in acute
respiratory distress syndrome. Crit Care 2007, 11:206.
30. Carvalho AR, Jandre FC, Pino AV, Bozza FA, Salluh J, Rodrigues R, Ascoli FO,
Giannella-Neto A: Positive end-expiratory pressure at minimal
respiratory elastance represents the best compromise between
mechanical stress and lung aeration in oleic acid induced lung injury.
Crit Care 2007, 11:R86.
doi: 10.1186/cc8912
Cite this article as: Gama de Abreu et al., Regional lung aeration and ventila-
tion during pressure support and biphasic positive airway pressure ventila-
tion in experimental lung injury Critical Care 2010, 14:R34