Báo cáo y học: "A mathematical model for LH release in response to continuous and pulsatile exposure of gonadotrophs to GnRH" ppt
Bạn đang xem bản rút gọn của tài liệu. Xem và tải ngay bản đầy đủ của tài liệu tại đây (709.25 KB, 17 trang )
BioMed Central
Page 1 of 17
(page number not for citation purposes)
Theoretical Biology and Medical
Modelling
Open Access
Research
A mathematical model for LH release in response to continuous
and pulsatile exposure of gonadotrophs to GnRH
Talitha M Washington
1
, J Joseph Blum
2
, Michael C Reed*
3
and P
Michael Conn
4
Address:
1
Department of Mathematics, College of New Rochelle, USA,
2
Department of Cell Biology, Duke University, Durham, USA,
3
Department
of Mathematics, Duke University, Durham, USA and
4
Oregon National Primate Research Center, Oregon Health & Science University, Beaver-ton,
USA
Email: Talitha M Washington - ; J Joseph Blum - ; Michael C Reed* - ; P
Michael Conn -
* Corresponding author
Abstract
In a previous study, a model was developed to investigate the release of luteinizing hormone (LH)
from pituitary cells in response to a short pulse of gonadotropin-releasing hormone (GnRH). The
model included: binding of GnRH to its receptor (R), dimerization and internalization of the
hormone receptor complex, interaction with a G protein, production of inositol 1,4,5-
trisphosphate (IP
3
), release of calcium from the endoplasmic reticulum (ER), entrance of calcium
into the cytosol via voltage gated membrane channels, pumping of calcium out of the cytosol via
membrane and ER pumps, and release of LH. The extended model, presented in this paper, also
includes the following physiologically important phenomena: desensitization of calcium channels;
internalization of the dimerized receptors and recycling of some of the internalized receptors; an
increase in G
q
concentration near the plasma membrane in response to receptor dimerization; and
basal rates of synthesis and degradation of the receptors. With suitable choices of the parameters,
good agreement with a variety of experimental data of the LH release pattern in response to pulses
of various durations, repetition rates, and concentrations of GnRH were obtained. The
mathematical model allows us to assess the effects of internalization and desensitization on the
shapes and time courses of LH response curves.
Background
Gonadotropin-releasing hormone (GnRH) is released by
the hypothalamus in a pulsatile fashion and stimulates
luteinizing hormone (LH) and follicle stimulating hor-
mone (FSH) release by pituitary cells by a complex series
of signaling processes. Although there is substantial infor-
mation about various individual steps in the signaling sys-
tem, there is less understanding of how these components
interact to give rise to the overall behavior of the system.
The frequency of pulses varies throughout the menstrual
cycle increasing markedly just prior to ovulation. And, it
has been observed in in vitro experiments on perifused
pituitary cells that pulse frequency and concentration
have marked (nonlinear) influences on the release of LH
and FSH. The purpose of our work is to use mathematics
and machine computation to understand the dynamics of
this important and interesting physiological system.
Published: 24 September 2004
Theoretical Biology and Medical Modelling 2004, 1:9 doi:10.1186/1742-4682-1-9
Received: 14 June 2004
Accepted: 24 September 2004
This article is available from: />© 2004 Washington et al; licensee BioMed Central Ltd.
This is an open-access article distributed under the terms of the Creative Commons Attribution License ( />),
which permits unrestricted use, distribution, and reproduction in any medium, provided the original work is properly cited.
Theoretical Biology and Medical Modelling 2004, 1:9 />Page 2 of 17
(page number not for citation purposes)
In a prior study, [1], a mathematical model was developed
to investigate the rate of release of luteinizing hormone
from pituitary gonadotrophs in response to short pulses
of gonadotropin-releasing hormone. The model included
binding of the hormone to its receptor, dimerization,
interaction with a G-protein, production of inositoltri-
sphosphate (IP
3
), release of calcium from the endoplas-
mic reticulum (ER), entrance of calcium into the cytosol
via voltage gated membrane channels, pumping of cal-
cium out of the cytosol via membrane and ER pumps, and
the release of luteinizing hormone (LH). Cytosolic cal-
cium dynamics were simplified and it was assumed that
there is only one pool of releasable LH. Despite these and
other simplifications, the model results matched experi-
mental curves and enabled us to understand the reasons
for the qualitative features of the LH release curves in
response to GnRH pulses of short durations and different
concentrations both in the presence and absence of exter-
nal calcium. We note that Heinze et al, [2], created a math-
ematical model for LH release that reproduces some data
for pulsatile administration of GnRH. Their model, how-
ever, does not include most of the important intracellular
mechanisms known to play important roles; thus, they
match data but do not study mechanisms. We also note
that mathematical models for other aspects of the repro-
ductive hormone system have been created: Keenan et al,
[3], developed a stochastic systems model for the interac-
tions between GnRH, LH, and testosterone; Gordan et al,
[4] modelled the pulsatile release of GnRH by hypotha-
lamic neurons.
There are four important medium-term effects that were
not included in the previous study. Desensitization of the
response to GnRH occurs because after GnRH binds to its
receptors, some of the bound complexes are internalized
and partially degraded [5]. Secondly, prolonged exposure
to GnRH desensitizes the outer membrane calcium ion
channels, as described in detail by Stojilkovic et al [6].
Thirdly, there exist basal rates of receptor synthesis and
degradation. Finally, in response to GnRH, there also
occurs an increase in the number of G
q/11
proteins closely
associated with the plasma membrane [7]. Incorporation
of these four phenomena into the previous model allows
us to analyze the contrasting effects of desensitization and
signal amplification during medium-term continuous
and pulsatile exposures to GnRH. We then show that the
LH response curves of the enlarged model capture most of
the essential features of a large number of experimental
studies.
It should be noted that in the present model we ignore the
long-term effects that result in changes in DNA, messenger
RNA, and protein concentrations (e.g., receptor number)
that are known to occur several hours after exposure to
GnRH [8-11]. Thus, in the present study, we limit the time
of exposure to three hours. We also ignore the long term
effects of diacylglycerol which is known to cause an
increase in the synthesis of LH
α
, the
α
subunit of the LH
dimer [12].
Model Development
Let H(t) represent the GnRH concentration (nM) in the
surrounding medium t minutes after the initiation of the
experiment. Initially, the hormone is bound by the recep-
tor, R.
The bound complex HR reacts with itself to form dimers
[13], denoted by HRRH.
A G
q/11
protein, denoted GQ, reacts with the dimer to pro-
duce an effector, E (e.g., phospholipase C, [13]).
The values of the rate constants, k
1
, k
2
, k
3
, k
-1
, k
-2
, k
-3
, are
the same as in our earlier model [1]. The abbreviations for
the physiological components of the model are listed in
Table 1 and all the rate constants for the current model are
listed in Table 2.
The monomers, HR, can also interact with each other to
form larger aggregates [14]. Macroaggregation and inter-
nalization occur at least 20 minutes after exposure to
GnRH [14]. All of the internalized hormone and some of
the receptors are then degraded, and the receptors that are
not degraded are returned to the membrane [15,16]. We
assume that a fraction of receptors, r
0
, can be returned
intact to the membrane after a time delay of 20 minutes.
Table 1: Glossary of Variables
H GnRH concentration (nM)
R Free GnRH receptor concentration (nM)
HR Hormone-receptor complex concentration (nM)
HRRH Hormone-receptor dimer concentration (nM)
GQ G
q/11
protein concentration (nM)
E Effector concentration (nM)
IP
3
Inositol 1,4,5-trisphosphate concentration (nM)
CAC Cytosolic Ca
2+
concentration (
µ
M)
CAER ER Ca
2
+ concentration (
µ
M)
CHO Fraction of open ER Ca
2+
channels
LH LH concentration (ng)
HR HR+
→
←
−
k
k
1
1
HR HR HRRH+
→
←
−
k
k
2
2
HRRH GQ E+
→
←
−
k
k
3
3
Theoretical Biology and Medical Modelling 2004, 1:9 />Page 3 of 17
(page number not for citation purposes)
Consistent with the data of [14], we assume that r
0
= 0.6.
Since we are not concerned with the details of the inter-
nalization or return processes, we adopt simple first order
reactions for these processes. We assume that n mono-
mers, HR, are internalized at a rate k
11
and that r
0
n mono-
mers that have been internalized are available to be
returned to the membrane at rate k
11
.
There is evidence that the macroaggregates consist of an
average of n = 100 monomers [14]. In our model, we will
choose k
11
= 0.08/n = 0.0008 nM
-1
·min
-1
. With this
choice, 7% of the receptors are internalized after a 5
minute pulse of 1 nM GnRH, and 60 minutes after the ini-
tial exposure, approximately half of the internalized
receptors have returned. It should be noted that it is only
the combination k
11
n that occurs in the equations.
We make the following simple assumption about the
recyling of receptors (consistent with the data of Maya-
Nunez et al. [17] and Table 2 of Conn et al. [18]). i.e. that
the formation of macroaggregates begins 20 minutes after
exposure to GnRH and that the internalization and recy-
cling process takes 20 minutes after the formation of the
macroaggregates. Let
χ
(t) be the function that equals 1 for
t ≥ 0 and equals 0 for t < 0. Then, at time t, the rate of inter-
nalization of receptors is k
11
n[HR](t) and the rate of
return of receptors to the membrane is k
11
n[HR](t - 40)
χ
(t
- 40). To simplify notation, we write [HR]
40
= [HR](t -
40)
χ
(t - 40).
Since only 60% percent of the internalized receptors are
returned to the membrane after exposure to GnRH, there
would not be a full recovery of receptors in the mem-
brane. In the model we therefore include a low basal rate
of receptor synthesis, P
0
= 8.3 × 10
-6
nM·min
-1
, and degra-
dation,
γ
= 8.3 × 10
-4
min
-1
. The ratio is chosen so that
the resting (in the absence of hormone) receptor concen-
tration is R
0
= 10
-2
nM, and the magnitude of P
0
is chosen
so that approximately of the resting amount of recep-
tor is produced per hour, thus ensuring a slow recovery to
the steady state receptor concentration in the absence of
GnRH.
The number of membrane associated GQ proteins
increases in response to a GnRH agonist as described by
Cornea et al [7]. For simplicity we assume that the
increase of GQ proteins near the membrane depends on
the concentration of HRRH in the membrane. The kinetic
coefficient k
33
is the parameter that determines the rate of
increased concentration of GQ at the membrane in
response to the formation of HRRH. We are assuming a
finite pool of GQ that can be transported from the cyto-
plasm to the immediate vicinity of the plasma membrane.
This pool is assumed to be regulated by the amount of
HRRH for only the first 20 minutes, and after this time the
rate of increase is negligible [7]. To fit the experimental
data, we choose k
33
= 2.7 min
-1
and multiply the kinetic
coefficient k
33
by e
-t/20
. With these parameters, 60 minutes
after a constant exposure to 1 nM GnRH, there is a 40%
increase of GQ concentration near the membrane and 120
minutes after exposure to the hormone, there is only a
43% increase. The following differential equations reflect
the physiological assumptions that we have so far
discussed.
Table 2: Constants
R
0
Total receptor concentration (nM)
GQ
0
Total G
q/11
protein concentration (nM)
ERUL Resting Ca
2+
concentration in ER (normally 40
µ
M)
CAE External Ca
2+
concentration (normally 1000
µ
M)
α
= 2 nM
-1
, see equation (17)
β
= 4 min
-1
, see equation (17)
v
1
= 0.02 min
-1
, see equation (12)
v
2
= 0.002 min
-1
, see equation (12)
r
0
= 0.6, fraction internalized receptors returned
P
0
= 8.3 × 10
-6
nM·min
-1
, basal rate of receptor synthesis
γ
= 8.3 × 10
-4
min
-1
, basal rate of receptor degradation
k
1
= 2.5 nM
-1
·min
-1
k
-1
= 5 min
-1
k
2
= 2500 nM
-1
·min-
1
k
-2
= 5 min
-1
k
3
= 4000 nM
-1
·min
-1
k
-3
= 200 min
-1
k
5
= 2 × 10
7
min
-1
k
-5
= 10 min
-1
k
6
= 1 nM
-1
·min
-1
k
66
= 10 nM
-1
·min
-1
k
666
= 0
k
-6
= 5 min
-1
k
7
= 2.2
µ
M·min
-1
k
8
= 0.4 nM
-1
·min
-1
k
88
= 0
k
888
= 0
k
9
= 0.0002 min
-1
k
10
= 5 ng·min
-1
k
11
= 0.0008 nM-
1
·min
-1
k
33
= 2.7 min
-1
P
0
γ
1
20
d
dt
kk knPRHRHRrHR R
[]
=−
[][]
+
[]
+
[]
+−
[]
−11011
40
0
1
γ
()
d
dt
kk k kknHR H R HR HRRH HR HR
[]
=
[][]
−
[]
+
[]
−
[]
−
[]
−−112 2
2
11
22 2()
d
dt
kkk kHRRH HRRH HR GQ HRRH E
[]
=−
[]
+
[]
−
[][ ]
+
[]
−−22
2
33
3()
d
dt
kkke
t
GQ GQ HRRH E HRRH
[]
=−
[][ ]
+
[]
+
[]
−
−
3333
20
4
/
()
Theoretical Biology and Medical Modelling 2004, 1:9 />Page 4 of 17
(page number not for citation purposes)
We further assume that the production of IP
3
is propor-
tional to the concentration of E and that it is converted to
inactive metabolites at a rate proportional to its
concentration.
As in [1], the fraction of open channels in the ER, denoted
by CHO, depends on IP
3
concentration. CHO reaches its
maximum 0.25 min after exposure to GnRH and the max-
imum value of CHO is 0.6. To incorporate multiple
pulses, we modify the function CHO from the previous
model so that it reaches its maximum 0.25 min after the
start of each pulse. Thus we have
where t
p
is the time after the start of each individual pulse
and, as in [1],,
α
= 2 nM
-1
and
β
= 4 min
-1
.
In response to GnRH, calcium is released from the ER into
the cytoplasm with a rate constant ERR and is pumped
back into the ER. As discussed in the previous model, the
rate constant ERR increases proportionally to cytosolic
calcium concentration, CAC, with a rate constant k
66
and
is inhibited at high CAC at a rate that is proportional to
the square of CAC, with a rate constant k
666
. Just as in, [1],
k
6
= 1, k
66
= 10, and k
666
= 0, i.e., we ignore the inhibitory
effects of calcium on reuptake of calcium into the ER.
ERR = k
6
+ k
66
[CAC] - k
666
[CAC]
2
(8)
The change in cytosolic calcium concentration, CAER, is
then determined by the rate constant ERR, which is the
rate of extrusion, multiplied by the fraction of open chan-
nels, CHO, and the difference in concentration between
the calcium concentration in the cytoplasm and the
endoplasmic reticulum. As in Blum et al. [1], calcium is
actively transported back into the ER by pumps with the
rate constant k
-6
= 5 min
-1
.
As in the previous model, the volume of the ER is assumed
to be 1/20 of the volume of the cytosol. CAC is deter-
mined by the rate of calcium efflux through ion channels
in the ER membrane minus the rate at which calcium is
being pumped back into the ER, plus the rate of calcium
entry from the plasma membrane. The function VSR
denotes the rate of calcium influx from extracellular cal-
cium into the cytosol and depends on E with rate constant
k
8
[19] and on CAC with rate constants k
88
for the influx at
low CAC and k
888
for the inhibitory effects at high CAC.
There is considerable evidence that desensitization occurs,
i.e., the fraction of open calcium channels in the cell
membrane decreases soon after exposure to GnRH [18].
Since the precise mechanism of desensitization in
unknown, we assume that VSR depends on E and CAC,
and that channels slowly become inactive in response to
exposure to GnRH, consistent with the experimental data
[18]. We further assume that the fraction of open calcium
channels in the outer membrane, denoted by VSRO(t),
decreases at a linear rate of v
1
= 0.02 min
-1
when the
hormone is applied and has a minimum value of 0. In the
absence of hormone, the fraction of open channels
increases at a linear rate of v
2
= 0.002 min
-1
and has a max-
imum value of 1. Thus, immediately a five minute pulse
of 5 nM GnRH, 10% of the channels are in the refractory
state and 50 minutes after the removal of the GnRH, all of
the channels have recovered, consistent with experimental
data; see [18] for more details. Incorporating calcium
influx, pumps and leakage into the cytoplasm from the
medium (the term k
9
[CAE], we have
where
VSR(t) = (k
8
E(t) + k
88
[CAC](t) - k
888
([CAC])(t))
2
) ×
VSRO(t) (11)
and VSRO satisfies the following.
0 ≤ VSRO(t) ≤ 1 (13)
Finally, the rate of release of LH depends on cytosolic cal-
cium concentration (see Blum et al. [1] for details).
Although there is evidence that there are three pools of LH
in gonadotrophs, one pool, comprising of only 2% of the
total LH, is released within one minute after exposure to
GnRH, and the third pool is not released during continu-
ous exposure to GnRH (Naor et al.,[20]). Therefore, as in
the previous model [1], we treat LH as being released from
a single pool.
d
dt
kkE GQ HRRH E
[]
=
[][ ]
−
[]
−33
5()
d
dt
kkIP3 E IP3
[]
=
[]
−
[]
−55
6()
CHO
IP3
IP3
t
t
t
te
p
t
p
()
=
[]
()
+
[]
()
+
(
)
−
−
−
α
α
β
β
10
110
03 03 7
3
3
1
()
d
dt
k
[[
([
.([
CAER] ERR CHO([CAER] CAC])
CAC])
CAC])
2
2
=− ⋅ −
+
+
−6
2
05 2
(([ [ERUL] CAER]) 9−
()
d
dt
k
[CAC] ERR CHO([CAER] CAC])
CAC])
2
=⋅ −
−
−
(. ) [
(. )
([
.
005
005
2
05
6
++
−
+−−
+
2
01
7
([
([ [
[
[
.[
CAC])
ERUL] CAER])
VSR([CAE] CAC])
CAC]
C
2
2
k
AAC]
CAE] 10
2
+
()
k
9
[
d
dt
t
v
v
Ht
Ht
VSRO(
if
if
)
() ,
()
=
−
>
=
()
1
2
0
0
12
Theoretical Biology and Medical Modelling 2004, 1:9 />Page 5 of 17
(page number not for citation purposes)
The mathematical model consists of equations (1) – (14).
These non-linear equations cannot be solved analytically
but solutions can be obtained by machine computation.
To do this, we used the solver ODE45 in Matlab.
The values of the rate constants are given in Table 2. The
values for many of them are discussed in detail, with ref-
erences, in our original paper, [1]. The values of the rate
constants for the signalling mechanisms introduced in
this paper were discussed (above) as the mechanisms were
introduced. In some cases the rate constants were taken
from experimental data (references given) and in other
cases, where direct experimental data does not yet exist,
we explained the rationale for our choices. Since the
resulting model captures and explains many experimental
studies (see below), these choices provide useful predic-
tions for future experimental studies.
Results
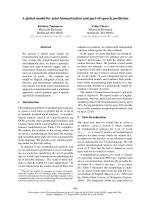
In Figure 1, we compare the amounts of LH released in 5
minute intervals in the original model and the present
model in response to continuous administration of 5 nM
GnRH. In both models there is an initial large pulse of LH
released. However, in the original model (open circles in
Panel A) the long-term release plateaus at a high level,
while in the present model (solid circles) the long term
release declines to a low level. Panel A in Figure 4 contains
experimental results of Hawes et al. [21], that clearly show
show a decline in LH release to a low level after approxi-
mately 1.5 to 2 hours. Similar experimental results were
obtained by Baird et al, [[22], Figure 4] and by Janovick
and Conn, [[5], Figure 1, Panel A].
Figures 2 and 3 show in detail the changes that occur in all
components of the system during the model experiments
described above. Fig. 2A shows the total amount of the LH
released as a function of time while Fig. 2B shows the LH
release rate (LHRR), which peaks within one minute after
exposure to GnRH and then declines slowly for the next
50 minutes to a very low value in the present model. Note
that LHRR is the instantaneous rate of LH release (in ng/
min) while LH release in Figure 1A is in ng released in
each five minute interval. In the previous model(dashed
lines), LHRR plateaus at a high level (Figure 2B), so the
total LH released increases linearly (Figure 2A). In the
present model (solid lines), LHRR declines to a low level.
In both the previous and present models, there is a rapid
extrusion of calcium from the ER (Fig. 2D) and an initial
rapid increase in CAC (Fig. 2C), which correlate well with
the time course of the rate of change of LHRR (Figure 2B).
However, the long-term behavior is different in the two
models because in the present model CAC declines to a
low plateau. This explains the similar drop in LH release
since the rate of LH release depends on CAC (see equation
(14)). The drop in CAC is caused by the desensitization of
the outer membrane channels; Figure 2E shows that the
fraction of open channels declines linearly to zero in 50
minutes. In the ER membrane, there is an almost instan-
taneous increase of open calcium channels followed by a
rapid decrease and then a slight further decline (Fig. 2F).
Figures 3A and 3C show the concentrations of free recep-
tors and receptors bound to the hormone. It can be seen
that, initially in both the present and previous models,
there is a very rapid decline in free receptors, R, and a very
rapid increase of receptors to which GnRH has bound
(HR) but have not yet dimerized. This is immediately
followed, as shown in Figure 3D, by the formation of the
dimers (HRRH). After this initial reaction, the concentra-
tions of HR and HRRH remain constant in the previous
model, but decline in the present model due to internali-
zation and degradation. The recycling of receptors was
assumed to start at 40 minutes (see equation (1)), which
Amount of LH released in five minute intervals in response to constant exposure to 5 nM GnRHFigure 1
Amount of LH released in five minute intervals in response
to constant exposure to 5 nM GnRH. The solid circles show
the results of the present model while the open circles show
the results of the original model [1]. The decay of LH release
to zero is in accord with experimental results (see discussion
in text); thus, new mechanisms included in the present model
allow one to match this data (and other data, see other fig-
ures) from several laboratories for medium-term GnRH
exposure experiments.
0 20 40 60 80 100 120 140 160 180
0
0.5
1
1.5
2
2.5
Time (min)
LH Release (ng)
d
dt
k
LH
CAC
CAC
[]
=
[]
+
[]
()
10
2
2
2
14
Theoretical Biology and Medical Modelling 2004, 1:9 />Page 6 of 17
(page number not for citation purposes)
Panel A shows the total amount of LH released as a function of time during continuous exposure to 5 nM GnRH, while Panel B shows the instantaneous rate of LH release at each moment of timeFigure 2
Panel A shows the total amount of LH released as a function of time during continuous exposure to 5 nM GnRH, while Panel B
shows the instantaneous rate of LH release at each moment of time. Panels C and D show the calcium concentration in the
cytosol and the endoplasmic reticulum, respectively. Panels E and F show the fraction of open calcium channels in the outer
membrane and the endoplasmic reticulum, respectively. The solid lines show the results of the present model while the dashed
lines show the results of the earlier model [1].
0 50 100 150
0
10
20
30
40
50
60
Total LH (ng)
0 50 100 150
0
0.5
1
1.5
LHRR (ng/min)
0 50 100 150
0
0.2
0.4
0.6
0.8
1
CAC (µM)
0 50 100 150
10
15
20
25
30
35
40
CAER (µM)
0 50 100 150
0
0.2
0.4
0.6
0.8
1
Time (min)
VSRO
0 50 100 150
0
0.2
0.4
0.6
Time (min)
CHO
A
B
C
D
E
F
Theoretical Biology and Medical Modelling 2004, 1:9 />Page 7 of 17
(page number not for citation purposes)
Panels A, C, and D show the concentrations of free, bound, and dimerized receptors, respectively, while Panel B shows the total amount of receptors in the membraneFigure 3
Panels A, C, and D show the concentrations of free, bound, and dimerized receptors, respectively, while Panel B shows the
total amount of receptors in the membrane. Panel E shows the concentration of IP3. Panel F shows the GQ concentration at
the membrane as a function of time during the continuous exposure to 5 nM GnRH. The solid lines show the results of the
current model and the dashed lines show the results of the earlier model in [1].
0 50 100 150
0
0.002
0.004
0.006
0.008
0.01
R (nM)
0 50 100 150
3
4
5
6
7
8
9
10
11
x 10
−3
R Total (nM)
0 50 100 150
0
1
2
3
x 10
−3
HR (nM)
0 50 100 150
0
0.2
0.4
0.6
0.8
1
1.2
1.4
x 10
−3
HRRH (nM)
0 50 100 150
0
1000
2000
3000
4000
5000
6000
Time (min)
IP3 (nM)
0 50 100 150
0.08
0.09
0.1
0.11
0.12
0.13
0.14
0.15
0.16
Time (min)
GQ (nM)
A
B
C
D
E
F
Theoretical Biology and Medical Modelling 2004, 1:9 />Page 8 of 17
(page number not for citation purposes)
is why the rates of decrease of HR and HRRH decline at
that time. Because of degradation, only a fraction (r
0
=
0.6) of the internalized receptors are returned to the mem-
brane. Thus, in the presence of continuous exposure to
GnRH, the total number of receptors in the membrane
continues to decline as shown in Figure 3B. The rate of
change of IP3 (Fig. 3E) is closely related to the rate of
change of HRRH as shown in Fig. 3D. Finally, Fig. 3F
shows that there is a slow increase of approximately 43%
of the concentration GQ associated with the membrane
during the exposure.
Figures 6, 7, and 8 show model results for gonadotrophs
exposed to 5 minute pulses of 5 nM GnRH administered
every 15 minutes for a total duration of 3 hours. In the
Experimental data of Hawes et al.[21]Figure 4
Experimental data of Hawes et al.[21]. Gonadotrophs were
treated continuously with lO nM GnRH (Panel A), with 5
minute pulses every 30 minutes (Panel B), or every 15 min-
utes (Panel C).
Experimental data of Baird et al.[22]Figure 5
Experimental data of Baird et al.[22]. Panels A and B show
the response of pubertal rat and hamster anterior pituitary
cells, respectively, to six minute pulses of 10 nM GnRH.
Theoretical Biology and Medical Modelling 2004, 1:9 />Page 9 of 17
(page number not for citation purposes)
previous model (Figure 6A, open circles), there was a drop
in LH release between the first and second pulse, but the
same amount of LH was released in response to all subse-
quent pulses, contrary to experimental observations. The
initial drop occurs because there is insufficient time for
the calcium in the ER to refill completely (data not
shown). In the present model, in response to the first
pulse there is a large release of LH. In response to the sec-
ond pulse considerably less LH is released, and in
subsequent pulses there is a steady decline in the amount
of LH released. This continual decline in LH release has
been observed in a large number of experiments. Panels B
and C of Figure 4 show the results of Hawes et al [21]
obtained from female weanling rats. Figure 5 shows the
results of experiments by Baird et al. [22] in which LH
release was measured in response to similar GnRH pulse
patterns in pubertal female rats (Panel A) and hamsters
(Panel B). See also Janovick & Conn, [[5], Figure 1B]. This
decline in the amount of LH release results both from
desensitization of the calcium channels in the outer mem-
brane and internalization of the receptors into the lyso-
somes, as we will see below.
The previous model (Blum et al, [1]) was intended to
explain the short term response of gonadotrophs to
GnRH. The success of the previous model in the first few
minutes is not visible in Figures 1, 2, 3, and 6 because the
long time scale compresses the first five minutes. The
present model, which includes the four important
medium-term processes discussed in the Introduction,
now enables us to study the effects of these intracellular
processes on medium-term responses, including the
responses to pulses of GnRH. From now on, when we
refer to the "model", we mean the present expanded
model.
As shown in Figure 7B, the LH release rate decreases
appreciably after the first pulse, and then continues to
decrease slowly with each subsequent pulse. This arises
(see equation (14)) because of the decline in the size of
the cytosolic calcium pulse after each GnRH pulse as
shown in Figure 7C. The ER is able to refill its calcium
store to almost the same level as the preceding pulse,
although the amount remaining in the ER after each pulse
decreases appreciably (Figure 7D). Notice that the fraction
of open channels in the outer membrane (Figure 7F)
declines dramatically, while the fraction of open ER chan-
nels declines only slightly with each pulse (Figure 7E).
This suggests that the primary cause of decline in the
amount LH release with each GnRH pulse is the
desensitization of the outer membrane. We examine this
hypothesis further below.
To understand why the number of open ER channels does
not decrease markedly from pulse to pulse, we refer to Fig-
ure 8. Note that the total number of receptors (Figure 8B)
declines steadily by approximately 1/3 in the course of the
experiment as does the number of free receptors (Figure
8A). The decline in the HRRH peaks is much greater
(approximtely 40%, Figure 8D) because the formation of
these dimers depends on the square of [HR]. However,
the decline in the effector, E, which leads to the formation
of IP3 (see equation (6)) is only 25% (data not shown)
because of the substantial, rapid rise in GQ (Figure 8F) in
response to the first pulse of GnRH. Thus, the IP3 peaks
decline only about 25% (Figure 8E). Because of the
Michaelis-Menten kinetics of the interaction between IP3
and the ER channels, there is an even smaller change in
the fraction of open ER channels (CHO) in response to
each GnRH pulse. This explains why the internalization
and degradation of receptors does not have a more pro-
found effect.
We now investigate how the desensitization depends on
pulse frequency and GnRH concentration. In Figure 4, we
examined the response of the cells to pulsatile administra-
tion of a intermediate concentration of GnRH. We now
examine the LH release pattern in response to pulsatile
exposure to lower (0.1 nM) and higher (10 nM) concen-
trations of GnRH. Panels A, B, and C of Figure 9 show the
model results for five minute pulses of GnRH adminis-
tered every 15, 30, and 60 minutes, respectively. On each
panel, the three curves correspond to pulse concentrations
of 10(stars), 1 (crosses), and 0.1 (open circles) nM of
Amount of LH released as a function of time during a series of 5 minute pulses of 5 nM GnRH every 15 minutesFigure 6
Amount of LH released as a function of time during a series
of 5 minute pulses of 5 nM GnRH every 15 minutes. Open
circles are the original model results and solid circles are the
current model results.
0 20 40 60 80 100 120 140 160 180
0
0.5
1
1.5
2
2.5
Time (min)
LH Release (ng)
Theoretical Biology and Medical Modelling 2004, 1:9 />Page 10 of 17
(page number not for citation purposes)
Model responses to a series of 5 minute pulses of 5 nM GnRH every 15 minutesFigure 7
Model responses to a series of 5 minute pulses of 5 nM GnRH every 15 minutes.
0 50 100 150
0
2
4
6
8
10
12
14
Total LH (ng)
0 50 100 150
0
0.5
1
1.5
LHRR (ng/min)
0 50 100 150
0
0.2
0.4
0.6
0.8
1
CAC (µM)
0 50 100 150
10
15
20
25
30
35
40
CAER (µM)
0 50 100 150
0
0.2
0.4
0.6
0.8
1
Time (min)
VSRO
0 50 100 150
0
0.1
0.2
0.3
0.4
0.5
0.6
Time (min)
CHO
A
B
C
D
E F
Theoretical Biology and Medical Modelling 2004, 1:9 />Page 11 of 17
(page number not for citation purposes)
Model responses to a series of 5 minute pulses of 5 nM GnRH every 15 minutesFigure 8
Model responses to a series of 5 minute pulses of 5 nM GnRH every 15 minutes.
0 50 100 150
0
0.002
0.004
0.006
0.008
0.01
R (nM)
0 50 100 150
0
0.002
0.004
0.006
0.008
0.01
R Total (nM)
0 50 100 150
0
0.5
1
1.5
2
2.5
3
x 10
−3
HR (nM)
0 50 100 150
0
0.2
0.4
0.6
0.8
1
1.2
1.4
x 10
−3
HRRH (nM)
0 50 100 150
0
1000
2000
3000
4000
5000
6000
Time (min)
IP3 (nM)
0 50 100 150
0.08
0.09
0.1
0.11
0.12
0.13
0.14
Time (min)
GQ (nM)
A
B
C
D
E
F
Theoretical Biology and Medical Modelling 2004, 1:9 />Page 12 of 17
(page number not for citation purposes)
GnRH, respectively. At the lowest concentration in each
case there is little or no desensitization throughtout the
three hour time period. At the high concentration, there is
a large release of LH in response to the first pulse. For
pulse period of 15 minutes, there is a large decline in the
amount of LH released with each subsequent pulse (Panel
A).
The decline is much smaller for pulse period of 30 min-
utes (Panel B). For a pulse period of 1 hour, the same
amount of LH is released in response to each pulse for
each GnRH concentration (Panel C). In vivo, one would
not expect desensitization, so this result is consistent with
experimental observations that LH pulses of the same
magnitude occur approximately once an hour except just
prior to ovulation (Kaiser et al,[23]). Note also that at the
medium concentration of 1nM there is less desensitiza-
tion at both period 15 and period 30 minutes than at the
high concentration. These results are consistent with the
experimental results seen by Hawes et al, [21] (our Figure
4) and Baird et al., [22] (our Figure 5), and Janovick &
Conn, [[5], see their Figures 1,2,3,4].
Experiments have been performed to examine LH release
in response to different concentrations of GnRH. King et.
al. [24] performed an experiment in which they exposed
pituitary cells to increasing concentrations of GnRH for 2
minutes at 30 minute intervals for a total time of three
hours. Fig. 10 shows the model results for such an experi-
ment. The pattern of LH release by the model closely coin-
cides with the experimental results except that at 150
minutes the model predicts a somewhat larger LH release
than observed experimentally. In Figure 11 we show the
total amount of LH released in the model during a one
hour and a two hour exposure to increasing concentra-
tions of GnRH. The saturating shape of each curve is sig-
moidal at medium and high GnRH concentrations, as
observed experimentally (see: Keri et al. [[25], Figure 1];
King et al., [[24], Figure 4]; Conn et al, [[18], Figure 6];
and Stoljikovic et al. [[26], Figure 7]). Note that, because
of desensitization, the amount of LH released in 2 hours
is much less than twice the amount released in one hour.
King et al. [24] also performed an experiment in which the
cells were exposed to 20-minute pulses of 100 nM GnRH
at 1-hour intervals. The model results (Figure 12) show a
peak followed by a rapid decline to approximately half of
the peak value and then a slower decrease to a lower level
of LH release. The pattern is repeated at a reduced peak
level with subsequent pulses. This pattern resembles Fig. 9
Dependence of desensitization on GnRH concentration and pulse frequencyFigure 9
Dependence of desensitization on GnRH concentration and
pulse frequency. Panels A, B, and C show model LH outputs
in response to 5 minutes pulses of GnRH at pulse periods of
15 (Panel A), 30 (Panel B), and 60(Panel C) minutes. Each
panel shows responses to 10 nM(*), 1 nM(+), and O.1 nM(❍)
GnRH.
0 50 100 150 20
0
0
0.5
1
1.5
2
0 50 100 150 20
0
0
0.5
1
1.5
2
LH Release (ng)
0 50 100 150 20
0
0
1
2
3
Time (min)
LH released during 2 minute pulses of GnRH administered every 30 minutes at the indicated increasing concentrations of GnRHFigure 10
LH released during 2 minute pulses of GnRH administered
every 30 minutes at the indicated increasing concentrations
of GnRH.
0 50 100 150
0
0.2
0.4
0.6
0.8
1
1.2
1.4
1.6
Time (min)
LH Released (ng)
10
−1
nM
1 nM 10 nM
10
2
nM 10
3
nM
Theoretical Biology and Medical Modelling 2004, 1:9 />Page 13 of 17
(page number not for citation purposes)
in King et al. [24] except that the experimental results
show a flattening of the LH release curve late in the pulse,
while the model results show a continual slow decline.
Notice that both the model and experimental results show
that even at one hour intervals pulses can cause desensiti-
zation if the pulse length is long enough or the frequency
is high enough.
To investigate which of the two desensitization mecha-
nisms, receptor interalization or outer membrane calcium
channel desensitization, plays the major role in LH release
densensitization, we set either the receptor internalization
to zero (i.e k
11
= 0) or calcium channel densensitization to
zero (v
0
= 0 = v
1
) and compared the results to the full
model for continuous and pulsatile exposures. In the full
model, in response to continuous exposure there is initial
rapid increase in LH release followed by a decrease to
basal levels at about 40 minutes (Figure 13, Panel A, open
squares), comparable to the results observed by Janovick
& Conn [5]. An almost identical response occurs if k
11
= 0,
except that the rate of decline after the initial spike is
somewhat slower(Figure 13, Panel A, solid circles). If,
however, v
0
= 0 and v
1
= 0, while k
11
retains its normal
value, then the amount of LH released declines much
more slowly and does not reach basal levels (Figure 13,
Panel A, open circles). In response to 5 minute pulses
every 15 minutes (Figure 13, Panel B), again there is a rel-
atively small effect of setting the internalization of the
receptors to zero and a much larger effect of ignoring the
desensitization of the calcium channels. Thus, for contin-
uous and pulsatile exposures up to 3 hours, internaliza-
tion of the receptors plays a relatively small role in the
desensitization of gonadotrophs, whereas calcium chan-
nel desensitization has a much larger effect.
In all of our previous simulations, except those in Figure
13 where we compared the two mechanisms for
desensitization of LH release, the parameters in the model
were never varied. We now discuss two situations where
the modification of parameters gives good fits to the data
and possibly new insights.
Stojilkovic et al. [6] exposed gonadotrophs from two week
old ovariectomized female rats to two 30 minute pulses of
100 nM GnRH at one hour intervals or to two 30 minute
pulses of 100 nM endothelin (ET), a hormone with LH
releasing activity comparable to GnRH. In response to
GnRH, the peak of the response to the second pulse was
actually slightly larger than the response of the first pulse
(Figure 14, Panel A). However, the response to the second
pulse using the present model without any change in
parameters was appreciably smaller than the response to
the first pulse (Figure 14, Panel B). A closer
approximation to the experimental results from
ovariectomized rats was obtained simply by increasing the
rate of recovery of the outer membrane calcium channels
from v
2
= 0.002 min
-1
to v
2
= 0.02 min
-1
(data not shown).
If, in addition, the rate of internalization of receptors is
decreased from k
11
= 0.08/n nM
-1
·min
-1
to k
11
= 0.04/n
Total LH released after a 1 hour (open circles) and 2 hour (closed circles) continuous exposure to the concentrations of GnRH shown on the abscissaFigure 11
Total LH released after a 1 hour (open circles) and 2 hour
(closed circles) continuous exposure to the concentrations
of GnRH shown on the abscissa.
LH released in the model in response to 20 minute pulses of 100 nM GnRH administered every hourFigure 12
LH released in the model in response to 20 minute pulses of
100 nM GnRH administered every hour.
−12 −11.5 −11 −10.5 −10 −9.5 −9 −8.5 −8 −7.5 −7
0
2
4
6
8
10
12
14
log[M] GnRH
LH Release (ng)
0 20 40 60 80 100 120 140 160 180
0
0.5
1
1.5
2
2.5
Time (min)
LH Release (ng)
Theoretical Biology and Medical Modelling 2004, 1:9 />Page 14 of 17
(page number not for citation purposes)
nM
-1
·min
-1
, the response to the second pulse of GnRH
was very similar to that observed experimentally, as
shown in Figure 14, Panel C.
In the experiments of Stojilkovic et al. [6], the first 30
minute pulse of ET provokes a high peak in LH release, as
for GnRH. This peak, however, is followed by a rapid
decline to basal levels. Furthermore, only a very small
amount of LH was released in response to the second
pulse of ET (see our Figure 15, Panel A). They attributed
this rapid desensitization in part to rapid internalization
of the ET receptors (see also Stojilkovic et al. [27]). To test
this hypothesis, we increased the rate of internalization of
these receptors from k
11
= 0.08/n to k
11
= 0.8/n. Although
LH released during constant exposure (Panel A) and to 5 minute pulses every 15 minutes (Panel B) to 5 nM GnRHFigure 13
LH released during constant exposure (Panel A) and to 5 minute pulses every 15 minutes (Panel B) to 5 nM GnRH. Open cir-
cles indicate the model with no desensiti-zation of calcium channels in outer membrane (v
1
= 0 and v
2
= 0); solid circles indicate
the model with calcium channel desensitization but with no internalization of receptors (k
11
= 0); open squares indicate the full
model.
Panel A shows the results of an experiment of Stojilkovic et al.[19] in which rat pituitary cells were exposed to two 30 minute pulses of 100 nM GnRH at one hour intervalsFigure 14
Panel A shows the results of an experiment of Stojilkovic et al.[19] in which rat pituitary cells were exposed to two 30 minute
pulses of 100 nM GnRH at one hour intervals. Panel B shows the response of the present model to the same pulses. If, how-
ever, the rate of recovery of the calcium channels in the outer membrane is increased from v
2
= 0.002 min
-1
to v
2
= 0.02 min
-1
and the rate internalization of receptors is decreased from k
11
= 0.08/n nM
-1
·min
-1
to k
11
= 0.04/n nM
-1
·min
-1
, then the present
model gives responses (Panel C) similar to the exerperimental results in Panel A. The ordinate units for Panels B and C are ng.
0 20 40 60 80 100 120 140 160 180
0
0.5
1
1.5
2
2.5
Time (min)
LH Release (ng)
A
0 20 40 60 80 100 120 140 160 180
0
0.5
1
1.5
2
2.5
Time (min)
LH Release (ng)
B
Theoretical Biology and Medical Modelling 2004, 1:9 />Page 15 of 17
(page number not for citation purposes)
this decreased the amount LH released appreciably on the
second pulse, the amount of LH released was not reduced
to a comparably low level as observed experimentally. We
therefore also decreased the amount of return of
internalized ET receptors to the membrane, r
0
, from 60%
to 10%. As shown in Fig. 15, Panel B, the model now pro-
duces a good match to the experimental data. We also
note that as in the experimental data, the LH released in
response to ET with the receptor internalization
modification returns to basal level much faster than in the
case of GnRH.
A similar result can be acheived by introducing desensiti-
zation of both the outer membrane and ER calcium chan-
nels instead of changing the internalization and recycling
of the receptors. The parameters for the desensitization of
the calcium channels in the outer membrane were
increased from 0.02 min
-1
to 0.4 min
-1
. This resulted in
approximately 70% decrease in the magnitude of
response to the second pulse of ET, but further increase in
v
1
did not cause any further reduction in magnitude. Since
there is evidence suggesting that the calcium channels in
the ER desensitize in response to GnRH (Conn et al [18]),
we introduced this desensitization into the model to see if
ER desensitization might also be occuring in response to
ET. For simplicity, the rates of desensitization and of
recovery of the ER calcium channels were chosen to be
identical to that of the desensitization of the outer
calcium channels. By including desensitization of both
the outer membrane and ER calcium channels, the
amount of LH released in response to the second pulse of
ET was as small as was observed experimentally (data not
shown). Thus, our current model, with few parameter
changes, appears capable of explaining the responses to
endothelin. However, in the absence of more detailed
experimental data (for example responses to pulses of dif-
ferent durations and frequencies, etc.) we cannot at
present distinguish between the two above proposed
mechanisms.
Discussion
We have extended our previous model to include receptor
internalization and partial degradation, outer membrane
calcium channel desensitization, basal levels of receptor
synthesis and destruction, and an increase in the number
of G
q/11
proteins closely associated with the plasma
membrane. With these additions we are now able to
examine the behavior of the model system over medium
term (up to three hours) exposures to GnRH and to a vari-
ety of pulsatile exposures. We have compared the model
behavior to many such different experiments and found
that it shows the essential response properties of the gona-
dotrophs. Furthermore, since the model includes many of
the intracellualar physiological processes, we have used
Panel A shows the results of an experiment of Stojilkovic et al. [6] in which rat pituitary cells were exposed to two 30 minute pulses of 100 nM endothelin at one hour intervalsFigure 15
Panel A shows the results of an experiment of Stojilkovic et al. [6] in which rat pituitary cells were exposed to two 30 minute
pulses of 100 nM endothelin at one hour intervals. Note that the response to Endothelin is markedly different than the
response to GnRH in Panel A of Figure 14. If we change the present model by increasing in internalization of receptors (k
11
=
0.8/n nM
-1
·min
-1
) and a decreasing the return of internalized receptors (from 60% to 10%), then the model (Panel B) closely
approximates the experimental results. The ordinate units for Panels B are ng.
Theoretical Biology and Medical Modelling 2004, 1:9 />Page 16 of 17
(page number not for citation purposes)
the model to investigate and understand the mechanisms
that give rise to the various experimental results.
We note that the response of gonadotrophs to GnRH
depends on the method of cell preparation, the stage of
the estrous cycle, and the particular animals and species
used. Thus, the real physiological parameters will vary in
these different situations. Therefore, one would not expect
that our model with the fixed set of "standard" parameters
(used for the simulations in Figures 1,2,3 and
6,7,8,9,10,11,12) would match perfectly any particular set
of experimental data. Of course, one can tune the model
by adjusting parameters. For example, notice that the
degree of desensitization to six minute pulses of 10 nM
GnRH is differs markedly for the pubertal female rats and
hamsters in the experiments of Baird et al. [22] as shown
in Figure 5. The model behavior with standard parameters
gives less desensitization than the hamster and more than
the rat (see open circles in Figure 16). By changing the
model parameter v
1
(the rate of desensitization of the
outer membrane calcium channels) from 0.02/min to
0.005/min we obtain a good match to the rat data (closed
circles in Figure 16), and by changing v
1
from 0.02/min to
0.05/min we obtain a good match to the hamster data
(stars in Figure 16). This does not prove, of course, that it
is only physiological variation in this parameter that gives
the different experimental results, but it does suggest the
specific experiments that could be performed to test this
hypothesis.
We used parameter variation to investigate whether recep-
tor internalization or outer membrane calcium channel
desensitization plays the major role in LH release
desensitization and concluded that outer membrane
calcium channel desensitization is more important, at
least in the experiments of Janovick and Conn [5]. We also
used parameter variation to show that changing two
parameters (the rate of recovery of the outer membrane
channels and the rate of receptor internalization) the
model gives good matches to the data of Stoljilkovic et al
[19], on LH responses to pulses of endothelin. This
strongly suggests that the same intracellular mechanisms
are primarily responsible for the LH responses to GnRH
and endothelin.
It is important to note that the model ignores a number of
processes that play a role in the long-term response to
GnRH. In gonadotrophs, depending on the frequency and
duration of exposure to pulses of GnRH, there may be an
increase or decrease in the number of receptors in the cell
membrane due to changes in gene expression and/or
mRNA translation [28,9,8,29,30]. These long-term effects
are not important for the current study but will be
included in future work. It is also known that there is acti-
vation of protein kinase C in gonadotrophs exposed to
GnRH [20], but while PKC may not be involved in GnRH-
mediated LH release [31], PKC may have other roles in the
pituitary, such as to modulate gonadotroph responsive-
ness to GnRH [32]. Another aspect that our model ignores
is the rapid calcium concentration oscillations in the
cytosol. As shown by Stojilkovic and Tomic [33], the fre-
quency of the oscillations affect the LH release. In the
present model, as in the previous model [1], for simplicity
we have assumed that the average cytosolic calcium
concentration is an adequate approximation to the rapid
oscillatory responses. Finally, we note (Stanislaus et al,
[34]) that there is evidence that the GnRH receptor inter-
acts with more than one G protein and Stanislaus et
al,[13], have proposed that this underlies the differential
regulation of the release of luteinizing hormone and
follicle stimulating hormone. We plan to address these
questions in future work.
Authors' Contributions
Washington and Reed contributed mostly to the mathe-
matical development, Conn contributed to the physiolog-
ical analysis, and Blum contributed to both.
Competing Interests
The authors declare that they have no competing interests.
Model responses to six minutes pulses of 10 nM GnRH every 30 minutes with the standard parameters (crosses), with v
1
changed from 0.02/min to 0.005/min (stars) or to 0.05/min (open circles)Figure 16
Model responses to six minutes pulses of 10 nM GnRH every
30 minutes with the standard parameters (crosses), with v
1
changed from 0.02/min to 0.005/min (stars) or to 0.05/min
(open circles). The weak desensitization (stars) is similar to
that of the rat in the experiments of Baird et al.[22](our Fig-
ure 5A) and the strong desensitization (open circles) is simi-
lar to that seen in the hamster (our Figure 5B).
0 30 60 90 120 150 180
0
0.5
1
1.5
2
2.5
Time (min)
LH Release (ng)
Theoretical Biology and Medical Modelling 2004, 1:9 />Page 17 of 17
(page number not for citation purposes)
Acknowledgements
This research was supported by National Science Foundation grant DMS-
0109872 and National Institues of Health grant HD19899. We are grateful
to Dr. Paula Budu for helping us prepare some of the figues.
References
1. Blum JJ, Reed MC, Janovick JA, Conn PM: A mathematical model
quantifying GnRH-induced LH secretion from
gonadotropes. Am J Physiol Endocrinol Metab 2000, 278:E263-E272.
2. Heinze K, Kenner RW, Midgley AR Jr: A Mathematical Model of
Luteinizing Hormone Release fro Ovine Pituitary Cells in
Perifusion. Am J Physiol 1998, 275:E1061-E1071.
3. Keenan DM, Sun W, Veldhuis JD: A stochastic biomathematical
model of the male reproductive hormone system. SIAM J Appl
Math 2000, 61:934-965.
4. Gordan JD, Attardi BJ, Pfaff DW: Mathematical exploration of
pulsatil-ity in cultured gonadotropin-releasing hormone
neurons. Neuroendocrinol 1998, 67:2-17.
5. Janovick JA, Conn PM: A cholera toxin-sensitive guanyl nucle-
otide binding protein mediates the movement of pituitary
luteinizing hormone into a re-leasable pool: loss of this event
is associated with the onset of homologous desensitization
to gonadotropin-releasing hormone. Endocrinology 1993,
132:2131-2135.
6. Stojilkovic SS, Iida T, Merelli F, Torsello A, Krsmanovic LZ, Catt KJ:
Interactions between calcium and protein kinase C in the
control of signaling and secretion in pituitary gonadotrophs.
J Biol Chem 1991, 266:10377-10384.
7. Cornea A, Janovick JA, Stanislaus D, Conn PM: Redistribution of
G
q/11
α in the pituitary gonadotrope in response to a gonado-
tropin-releasing hormone agonist. Endocrinology 1998,
139:397-402.
8. Kaiser UB, Jakubowiak A, Steinberger A, Chin WW: Differential
effects of gonadotropin-releasing hormone (GnRH) pulse
frequency on gonadotropin subunit and GnRH receptor
messenger ribonucleic acid levels in vitro. Endocrinology 1997,
138:1224-1231.
9. Haisenleder DJ, Yasin M, Marshall JC: Gonadotropin subunit and
gonadotropin-releasing hormone receptor gene expression
are regulated by alterations in the frequency of calcium pul-
satile signals. Endocrinology 1997, 138:5227-5230.
10. Dalkin AC, Burger LL, Aylor KW, Haisenleder DJ, Workman LJ, Cho
S, Marshall JC: Regulation of gonadotropin subunit gene tran-
scription by gonadotropin-releasing hormone: measure-
ment of primary transcript ribonucleic acids by quantitative
reverse transcription-polymerase chain reaction assays.
Endocrinology 2001, 142:139-146.
11. Burger LL, Dalkin AC, Aylor KW, Haisenleder DJ, Marshall JC:
GnRH pulse frequency modulation of gonadotropin subunit
gene transcription in normal gonadotropes-assessment by
primary transcript assay provides evidence for roles of
GnRH and follistatin. Endocrinology 2002, 143:3243-3249.
12. Conn PM, Ganong BR, Ebeling J, Staley D, Neidel JE, Bell RM: Diacy-
glycerols release LH: structure-activity relations reveal a
role for protein kinase C. Biochem Biophys Res Commun 1985,
126:532-539.
13. Stanislaus D, Janovick JA, Wilkie TM, Offermanns S, Conn PM: Gona-
dotropin and gonadal steroid release in response to a gona-
dotropin-releasing hormone agonist in Gqalpha and
G11alpha knockout mice. Endocrinology 1998, 139:2710-2717.
14. Cornea A, Janovick JA, Maya-Nunez G, Conn PM: Gonadotropin-
releasing hormone receptor microaggregation. J Biol Chem
2001, 276:2153-2158.
15. Cornea A, Janovick JA, Lin X, Conn PM: Simultaneous and inde-
pendent visualization of the gonadotropin-releasing hor-
mone receptor and its ligand: evidence for independent
processing and recycling in living cells. Endocrinology 1999,
140:4272-4280.
16. Jennes L, Stumpf WE, Conn PM: Intracellular pathways of elec-
tron-opaque gonadotropin-releasing hormone derivatives
bound by cultured gonadotropes. Endocrinology 1983,
113:1683-1689.
17. Maya-Nunez G, Janovick JA, Conn PM: Combined modification of
intracellular and extracellular loci on human gonadotropin-
releasing hormone receptor provides a mechanism for
enhanced expression. Endocrine 2000, 13:401-407.
18. Conn PM, Staley DD, Yasumoto T, Huckle WR, Janovick JA: Homol-
ogous desensitization with gonadotropin-releasing hormone
(GnRH) also diminishes gonadotrope responsiveness to Mai-
totoxin: a role for the GnRH receptor-regulated calcium ion
channel in mediation of cellular desensitization. Mol Endocrinol
1987, 1:154-159.
19. Stojilkovic SS, Iida T, Merelli F, Catt KJ: Calcium signaling and
secretory responses in endothelin-stimulated anterior pitui-
tary cells. Mol Pharmacol 1991, 39:762-770.
20. Naor Z, Zer J, Zakut H, Hermon J: Characterization of pituitary
calcium-activated, phospholipid-dependent protein kinase:
redistribution by gonadotropin-releasing hormone. Proc Natl
Acad Sci 1985, 82:8203-8207.
21. Hawes BE, Waters SB, Janovick JA, Bleasdale JE, Conn PM: Gonado-
tropin-releasing hormone-stimulated intracellular Ca
2+
fluc-
tuations and luteinizing hormone release can be uncoupled
from inositol phosphate production. Endocrinol 1992,
130:3475-3483.
22. Baird SJ, Tharandt L, Tamarkin L: Regulation of luteinizing hor-
mone release by pulsatile and continuous administration of
gonadotropin-releasing hormone to superfused rat and
hamster pituitary cells. Endocrinology 1984, 114:1041-1047.
23. Kaiser UB, Sabbagh E, Katzenellenbogen RA, Conn PM, Chin WW: A
Mechanism for the differential regulation of gonadotropin
subunit gene expression by gonadotropin-releasing
hormone. Proc Natl Acad Sci, U S A 1995, 92:12280-12284.
24. King JA, Davidson JS, Millar RP: Desensitization of gonadotropin-
releasing hormone in perifused chicken anterior pituitary
cells. Endocrinology 1986, 119:1510-1518.
25. Keri G, Nikolics K, Teplan I, Molnar J: Desensitization of luteiniz-
ing hormone release in cultured pituitary cells by gonadotro-
pin-releasing hormone. Mol Cell Endocrinol 1983, 30:109-120.
26. Stojilkovic SS, Stutzin A, Shun-ichiro I, Dufour S, Torsello A, Virmani
MA, Rojas E, Catt KJ: Generation and Amplification of the
Cytosolic Calcium Signal During Secretory Responses to
Gonadotropin-releasing Hormone. The New Biologist 1990,
2:272-283.
27. Stojilkovic SS, Balla T, Fukuda S, Cesnjaj M, Merelli F, Krsmanovic LZ,
Catt KJ: Endothelin ET
A
receptors mediate the signaling and
secretory actions of endothelins in pituitary gonadotrophs.
Endocrinology 1992, 130:465-474.
28. Conn PM, Rogers DC, Seay SG: Biphasic regulation of the gona-
dotropin-releasing hormone receptor by receptor microag-
gregation and intracellular Ca2+ levels. Mol Pharmacol 1984,
25:51-55.
29. Loumaye E, Catt KJ: Homologous regulation of gonadotropin-
releasing hormone receptors in cultured pituitary cells. Sci-
ence 1982, 215:983-985.
30. Yasinj R, Bergel F: Lactate dehydrogenase isoenzyme patterns
in human normal and malignant gastric mucosa. Eur J Cancer
1965, 1:203-209.
31. McArdle CA, Gorospe WC, Huckel WR, Conn PM: Homologous
down-regulation of gonadotropin-releasing hormone recep-
tors and desensitization of gonadotropes: lack of depend-
ence in protein kinase C. Mol Endocrinol 1987, 1:420-429.
32. Stanislaus D, Pinter JH, Janovick JA, Conn PM: Mechanisms Medi-
ating Multiple Physiological Responses to Gonadotropin-
releasing Hormone. Molec Cell Endocrinol 1998, 144:1-10.
33. Stojilkovic SS, Tomic M: GnRH-induced calcium and current
oscillations in gonadotropes. Trends Endocrinol Metab 1996,
7:379-384.
34. Stanislaus D, Ponder S, Ji TH, Conn PM: Gonadotropin-releasing
Hormone Receptor Couples to Multiple G-proteins in Rat
Gonadotrophes and in GGH
3
Cells: Evidence from Palmi-
toylation and Overexpression of G proteins. Biology of
Reproduction 1998, 59:579-586.