Financial Engineering PrinciplesA Unified Theory for Financial Product Analysis and Valuation phần 5 ppt
Bạn đang xem bản rút gọn của tài liệu. Xem và tải ngay bản đầy đủ của tài liệu tại đây (559.54 KB, 31 trang )
A credit derivative is simply a forward, future, or option that trades to an
underlying spot credit-sensitive instrument or variable. For example, if
investors purchase a 10-year bond of the XYZ corporation and the bond is
rated single-A, they can purchase a credit spread option on the security such
that their credit risk exposure is mitigated in the event of a deterioration in
XYZ’s credit standing
—
at least to the extent that this credit weakness trans-
lates into a widening credit spread. The pricing of a credit spread option
certainly takes into consideration the kind of drift and default data presented,
as would presumably any nonderivative credit-sensitive instrument (like a
credit-sensitive bond). However, drift and default tables represent an aggre-
gation of data at a very high level. Accordingly, the data are an amalgamation
of statistics accumulated over several economic cycles, with no segmentation
by industry-type, maturity of industry-type, or the average age of companies
within an industry category. Thus, by slicing out these various profiles, a more
100 PRODUCTS, CASH FLOWS, AND CREDIT
Credit
Cash flows
Forwards & futures,
Options
Bonds
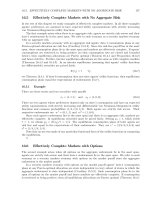
TABLE 3.6 Moody’s One-Year Transition Matrices
Corporate Average One-Year Rating Transition Matrix, 1980–1998
Rating to (%)
Initial
Rating Aaa Aa A Baa Ba B Caa—C Default WR*
Aaa 85.44 9.92 0.98 0.00 0.03 0.00 0.00 0.00 3.63
Aa 1.04 85.52 9.21 0.33 0.14 0.14 0.00 0.03 3.59
A 0.06 2.76 86.57 5.68 0.71 0.17 0.01 0.01 4.03
Baa 0.05 0.32 6.68 80.55 5.72 0.95 0.08 0.15 5.49
Ba 0.03 0.07 0.51 5.20 76.51 7.40 0.49 1.34 8.46
B 0.01 0.04 0.16 0.60 6.07 76.12 2.54 6.50 7.96
Caa—C 0.00 0.00 0.66 1.05 3.05 6.11 62.97 25.16 0.00
* WR: Withdrawn rating.
Source: Moody’s Investor’s Service, January 1999, “Historical Default Rates of
Corporate Bond Issuers, 1920–1998.”
03_200306_CH03/Beaumont 8/15/03 12:42 PM Page 100
TLFeBOOK
meaningful picture may emerge pertaining to how a credit (or portfolio of
credits) may evolve over time.
In addition to the simple case of buying or selling a credit spread put or
call option on specific underlying bonds, credit derivatives, that account for
a rather small percentage of the overall credit derivatives market, there are
other types of credit derivative transactions. Any non-spot vehicle that can
effectively absorb or transfer all or a portion of a security’s (or portfolio’s)
credit risk can be appropriately labeled a credit derivative instrument.
Consider the case of a credit-linked note.
A credit-linked note is a fixed income security with an embedded credit
derivative. Simply put, if the reference credit defaults or goes into bank-
ruptcy, the investor will not receive par at maturity but will receive an
amount equivalent to the relevant recovery rate. In exchange for taking on
this added risk, the investor is compensated by virtue of the credit-linked
note having a higher coupon relative to a bond without the embedded deriv-
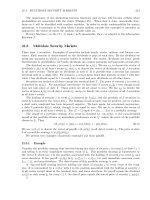
ative. Figure 3.5 shows how a credit-linked note can be created.
A credit-linked note is an example of a credit absorbing vehicle, and an
investor in this product accepts exposure to any adverse move in credit stand-
ing. As a result of taking on this added risk, the investor is paid a higher
coupon relative to what would be offered on a comparable security profile
without the embedded credit risk.
In addition to these issuer-specific types of credit derivative products,
other credit derivatives are broader in scope and have important implica-
tions for product correlations and market liquidity. For example, a simple
interest rate swap can be thought of as a credit derivative vehicle. With an
interest rate swap, an investor typically provides one type of cash flow in
exchange for receiving some other type of cash flow. A common swap
involves an investor exchanging a cash flow every six months that’s linked
Credit 101
Investors SPV
SPV: Special purpose vehicle
Libor + spread
Libor + spread
Libor
Collateral securities
Note proceeds
Note proceeds
Total return on
reference pool
Sponsoring entity &
reference pool
FIGURE 3.5 Schematic of a credit-linked note.
03_200306_CH03/Beaumont 8/15/03 12:42 PM Page 101
TLFeBOOK
to a long-dated risk-free reference rate of interest (e.g., a five-year Treasury
bond yield) in exchange for receiving a cash flow linked to a floating rate
of interest (e.g., six-month Libor). In practice, the two parties to a swap typ-
ically net the relevant cash flows such that only one payment actually is
made. Thus, if investors believe that credit spreads may widen, an interest
rate swap may be just the ticket. Investors will want to set up the swap such
that they are paying the risk-free rate (the Treasury rate) and receiving the
credit rate (as with Libor).
Accordingly, swap investors will benefit under any one of these five sce-
narios:
1. The level of both the relevant Libor and Treasury rates rise, but Libor
rises by more.
2. The level of both the relevant Libor and Treasury rates fall, but Libor
falls by less.
3. The level of Libor rises while the Treasury rate stays the same.
4. The level of the Treasury falls while Libor stays the same.
5. The level of the Treasury falls while Libor rises.
Examples to correspond to each of these follow:
1. In a bear market environment (rising yields) that is exacerbated by eco-
nomic weakness, as was the case in 1994, yield levels of all bonds will
tend to rise, though the yields on credit-sensitive securities will tend to
rise by more as they are perceived to have less protection for enduring
hardship.
2. In a rallying market (falling yields) for Treasury bonds, non-Treasury
products may lag behind Treasuries in performance. This stickiness of
non-Treasury yields can contribute to a widening of spreads, as during
2002.
3. A unique event unfavorable to banking occurs, as with the news of
Mexico’s near default in August 1982.
4. A unique event favoring Treasuries occurs, as with the surprise news in
1998 that after 29 years of running deficits, the federal government was
finding itself with a budget surplus.
5. Investors rush out of non-Treasury securities and rush into the safety of
Treasury securities. This scenario is sometimes referred to as a flight to
quality, and occurred in August 1998 when Russia defaulted on its sov-
ereign debt.
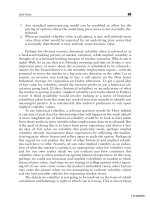
Figure 3.6 presents the basic mechanics of an interest rate swap.
The above-referenced type of interest rate swap (Constant Maturity
Treasury swap, or CMT swap) is a small part of the overall swaps market,
102 PRODUCTS, CASH FLOWS, AND CREDIT
03_200306_CH03/Beaumont 8/15/03 12:42 PM Page 102
TLFeBOOK
with the majority of swaps being fixed versus Libor without reference to
Treasuries. It is this latter type of swap that is most commonly used for credit
purposes.
Often credit spreads widen as yield levels rise. There are at least three
reasons why this could be the case.
1. As yields rise, credit spreads may need to widen so as to keep pace on
a relative basis; a credit spread of 20 basis points (bps) when the rele-
vant Treasury yield is 6 percent amounts to 3.3 percent of the Treasury’s
yield (20bps/600bps), while 20 bps when the relevant Treasury yield is
8 percent amounts to 2.5 percent of the Treasury’s yield.
2. As alluded to above, in times of economic weakness, when all bond
yields have an upward bias, credit-sensitive securities can be especially
vulnerable since they are perceived to be less insulated against the chal-
lenges of adverse times.
3. Demand for credit-sensitive products weakens since they are not
expected to be strong performers, and this slack in the level of interest
depresses price levels (and widens spreads).
A total return swap is another example of a credit swap transaction. A
total return swap exists when an investor swaps the total return profile of one
market index (or subset of a market index) for some other market index (or
subset of a market index). For example, an investor may have a portfolio that
matches the U.S. investment-grade (Baa-rated securities and higher) bond
index of Morgan Stanley. Such a bond index would be expected to have U.S.
Treasuries, mortgage-backed securities (MBS), federal agencies, asset-backed
securities, and investment-grade corporate securities. Investors who are bear-
ish on the near-term outlook for credit may want to enter into a total return
swap where they agree to pay the total return on the corporate (or credit) por-
tion of their portfolios in exchange for receiving the total return of the
Treasury (or noncredit) portion of their portfolios. In short, the portfolio man-
agers are entering into a forward contractual arrangement whereby any pay-
out is based on the performance of underlying spot securities.
Credit 103
Swap provider/seller
Pays a fixed rate
linked to a
Treasury yield
Pays a floating rate
linked to Libor
Purchaser
FIGURE 3.6 Interest rate swap schematic.
03_200306_CH03/Beaumont 8/15/03 12:42 PM Page 103
TLFeBOOK
A credit default swap is still another example of a credit risk transfer
vehicle. A credit default swap can be structured to trade to one or more
underlying spot securities. In brief, if the underlying security (or basket of
securities) goes into default, a payment is made that is typically equal to par
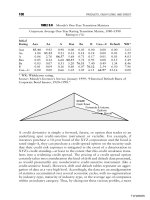
minus any recovery value. Figure 3.7 presents an overview of the cash flows
involved in a common credit default transaction (or financial guarantee).
Parenthetically, there are some investors who view credit default swaps
and total return swaps as being close substitutes for bonds. That is, a swap
is seen as comparable to buying a generic coupon-bearing bond and funding
it at Libor on a rolling basis. The strategy can be summarized as follows:
Fixed-coupon par bond = Par swap + 3- (or 6-) month Libor cash
investment.
At the end of the first quarterly (or semiannual) period, the floating part
of the swap is again worth par and pays interest at the rate of Libor refer-
enced at the start of the swap. This is precisely the case with the cash Libor
investment; the cash investment precisely matches the floating part of the
swap at each successive 3- (or 6-) month interval. Thus, the total return of
a swap may be viewed as the return on a portfolio consisting of the swap
and the cash investment in Libor; the return is equivalent to the total return
of the fixed part of the swap considered to be economically equivalent to a
bond.
There are many diverse considerations embedded within a credit deriv-
ative, not the least of which involve important legal and tax matters. From
a legal perspective, an obvious though long-elusive requirement was for a
clear and unambiguous definition of precisely when and how a default event
is to be defined. The resolution of this particular issue was significantly aided
with standardized documentation from the International Swaps and
Derivatives Association (ISDA). In 1999 the ISDA presented a set of defin-
itions that could be used in whole or in part by parties desiring to enter into
complex credit-based transactions. However, even though the acceptance and
104 PRODUCTS, CASH FLOWS, AND CREDIT
Swap provider/seller
Financial guarantor
Premium payments
Reference credit
Credit event payments
Purchaser
FIGURE 3.7 Financial guarantee schematic.
03_200306_CH03/Beaumont 8/15/03 12:42 PM Page 104
TLFeBOOK
use of common terms and definitions is a large step in the right direction,
different interpretations of those terms and definitions when viewed by var-
ious legal entities are likely. When interpretations are given, they often reflect
the particular orientation and biases of the legal framework within the
national boundaries of where the opinions are being rendered.
For example, in Western Europe, France is generally regarded as a
debtor-friendly nation, while the United Kingdom is widely seen as a credi-
tor-friendly country. Germany is sometimes viewed as being somewhere in
the middle of France and the U.K. Thus, while the euro and other shared gov-
ernmental policies within the European Community have gone a long way
toward creating a single common approach to business practices, this is far
from having been fully achieved. Presumably one way that this process of a
more homogeneous legal infrastructure can be achieved is through the
European courts. Court decisions made at the national level can be appealed
to a higher European level (if not with original jurisdiction residing within
certain designated European courts at the outset), and over time an accu-
mulated framework of legal opinions on credit and related matters should
trickle back down to the national level to guide interpretations on a coun-
try-by-country basis. This being said, as is often the experience in the United
States, it is common to have participants in a default situation sit down and
attempt to arrive at a particular solution among themselves. Again, and per-
haps especially in this type of setting, which is somewhat distanced from more
formal and constraining requirements of a judicially rooted approach, local
customs and biases can play a more dominant role. Chapter 6 provides more
detail on tax and legal implications for credit derivatives.
Finally, a popular instrument among credit derivatives is the synthetic
CDO. CDO stands for collateralized debt obligation, and it is typically struc-
tured as a portfolio of spot securities with high credit risk. The securities
generally include a mix of loans and bonds. A portfolio comprised pre-
dominantly of loans may be called a CLO, and a portfolio comprised pre-
dominantly of bonds may be called a CBO. Generally speaking, when a
CDO, CLO, or CBO is structured, it is segmented into various tranches with
varying risk profiles. The tranches typically are differentiated by the prior-
ity given to the payout of cash flows, and the higher the priority of a given
class, the higher the credit rating it receives. It is not unusual for a CDO to
have tranches rated from triple A down to single B or lower. These instru-
ments are comprised of spot securities. A synthetic CDO necessarily involves
an underlying CDO of spot securities, though it is also comprised of a credit-
linked note and a credit default swap. Figure 3.8 presents a schematic
overview of a synthetic CDO.
With a synthetic CLO, the issuer (commonly a bank) does not physically
take loans off its books, but rather transfers the credit risk embedded within
the loans by issuing a credit-linked note. The bank retains underlying spot
Credit 105
03_200306_CH03/Beaumont 8/15/03 12:42 PM Page 105
TLFeBOOK
assets as loans. Since the credit risk in the loans is transferred to a special-
purpose vehicle (SPV), a company specifically established to facilitate the cre-
ation of the CLO, it is the SPV that then transfers the credit risk to investors
who are willing to take on the risk for the right price. As a result of having
successfully transferred the credit risk off its books in this synthetic fashion,
the bank is not required to hold as much capital in reserve. This freed-up cap-
ital can be directed in support of other business activities.
When the SPV sells the credit-linked notes, the proceeds of the sale do
not revert back to the bank but are invested in low-risk securities (i.e., triple-
A rated instruments). This conservative investment strategy is used to help
ensure that repayment of principal is made in full to the holders of the credit-
linked notes. The SPV originates a credit default swap, with the issuing bank
as a counterparty. The bank pays a credit default swap insurance premium
to the SPV under terms of the swap arrangement. Should a default occur
with any of the loans at the originating bank, the bank would seek an insur-
ance payment from the SPV. If this happens, investors in the SPV would suf-
fer some type of loss. Just how much of a loss is experienced depends on the
depth and breadth of default(s) actually experienced. If no default event
occurs, investors in the SPV will receive gross returns equal to the triple-A
rated investments and the default swap premium.
Aside from differences in how synthetic and nonsynthetic CDOs can be
created, synthetic CDOs are not subject to the same legal and regulatory
requirements as regular CDOs. For example, on the legal front, requirements
106 PRODUCTS, CASH FLOWS, AND CREDIT
CDO swap counterparty
CDO:
SPV:
CDS:
Collateralized debt obligation
Special-purpose vehicle
Credit default swap
Reference portfolio
Originating bank
CDS protection
payments
Protection payments/interest
(Bank affiliate)
Swap premium Proceeds
Proceeds
Notes
SPV
CDO
Note
Investors
Super
senior
CDS
Collateral
FIGURE 3.8 Schematic of a synthetic balance sheet structure.
03_200306_CH03/Beaumont 8/15/03 12:42 PM Page 106
TLFeBOOK
with matters like making notice to obligors are less an issue since the issuer
is retaining a synthetic CDO’s underlying securities. On the regulatory
front, and as already alluded to above, it has been held that for purposes of
risk-based capital, an issuer of a synthetic CDO may treat the cash proceeds
from the sale of credit-linked notes as cash that is designated as collateral.
This then permits the reference assets
—
the loans carried on the books of the
issuing bank
—
to be eligible for a zero percent risk classification to the extent
that there is full collateralization. This treatment may be applied even when
the cash collateral is transferred to the general operating funds of the bank
and not deposited in a segregated account.
Table 3.7 shows credit derivatives in the context of their relationship to
underlying securities. As shown, cost, the desired credit exposure or trans-
Credit 107
TABLE 3.7 Credit Derivative Profiles
Credit Derivative Underlying Spot Pros/Cons
Credit put/call options Single reference Offers a tailor-made hedge,
and forwards security though may be expensive owing
to its unique characteristics as
created by buyer and seller
Credit default swap Usually a portfolio Typically created with unique
of securities securities as defined by buyer
and seller, so may be more
expensive than a total rate of
return swap
Total rate of Index (portfolio) Generally seen as less of a
return swap of securities commodity than credit-linked
notes, and may be more
expensive as a result
Credit-linked notes Single reference Often a more commoditized
security or portfolio product relative to individual
of securities options and forwards, so may
not be as expensive
Synthetic CDO Portfolio of Blend of a CDO, credit-linked
securities note, and credit default swap in
terms of cost, and may offer
issuer certain legal and
regulatory advantages
Interest rate swap Reference credit Perhaps the least expensive of
rate (typically a Libor credit derivatives, but also
rate) relative to a non- considerably less targeted to a
credit-sensitive rate single issuer or issuer-type
(typically a Treasury
or sovereign rate)
03_200306_CH03/Beaumont 8/15/03 12:42 PM Page 107
TLFeBOOK
fer of credit exposure, and various legal and regulatory considerations all
can come into play in differing ways with these products. Chapter 6 pre-
sents more detail pertaining to the particular tax and legal issues involved.
The following chapters make reference to these products, and highlight
ways in which other security types may be considered to be credit deriva-
tives even if they are not conventionally thought of as such.
CHAPTER SUMMARY
This chapter examined how credit permeates all aspects of the financial mar-
kets; issuers, counterparties, and the unique packaging of various financial
products are all of relevance to investors concerned about managing their
overall credit exposures. While rating agencies can rate companies and their
financial products, there are limitations to what rating agencies or anyone
else can see and judge. Cash flows can be used to redistribute credit risk. Cash
flows cannot eliminate credit risk, but they can help to channel it in innov-
ative ways. And finally, a variety of innovations are constantly evolving in
response to investors’ needs for creating and transferring credit exposures.
As perhaps more of a conceptual way of summarizing the first three
chapters, please refer to Figure 3.9. As shown, there can be creative ways
108 PRODUCTS, CASH FLOWS, AND CREDIT
O
Product: Ginnie Mae pass-
through bond
Cash flows: Collateralized spot
Credit: Guaranteed by U.S.
government (triple-A)
Product: Preferred stock
Cash flows: Spot
Credit: Single-A rated
Dividing point
between equity
and bond; as we
move farther from
the origin, the
seniority of the
security
increases
Credit
Product
Cash flow
Spot
AAA
A
BB
Equity
Bond
FIGURE 3.9 Conceptualizing risk relative to various cash flows and products.
03_200306_CH03/Beaumont 8/15/03 12:42 PM Page 108
TLFeBOOK
of linking the first three triangles of products, cash flows, and credit.
Consider how other products might be placed in such a three-dimensional
context, not only as an academic exercise to reinforce an understanding of
financial interrelationships, but also as a practical matter for how portfo-
lios are constructed and managed.
Chapter 5 explores how credit and other risks can be quantified and
managed.
Credit 109
03_200306_CH03/Beaumont 8/15/03 12:42 PM Page 109
TLFeBOOK
03_200306_CH03/Beaumont 8/15/03 12:42 PM Page 110
TLFeBOOK
PART
TWO
Financial Engineering,
Risk Management, and
Market Environment
04_200306_CH04/Beaumont 8/15/03 12:48 PM Page 111
TLFeBOOK
04_200306_CH04/Beaumont 8/15/03 12:48 PM Page 112
TLFeBOOK
Financial Engineering
113
CHAPTER
4
Product
creation
Portfolio
construction
Strategy development
Strategy development
This chapter shows how combining different legs of the triangles presented
in Chapters 1, 2, and 3 can facilitate the process of product creation, port-
folio construction, and strategy development.
This section presents three strategies: a basis trade from the bond market,
a securities lending trade from the equity market, and a volatility trade from
the currencies market.
Generally speaking, a basis trade (see Figure 4.1) is said to exist when
one security type is purchased and a different security type is sold against
it. Assume that an investor goes long spot and simultaneously sells a for-
ward or futures contract against the long position. For a forward contract,
this may be mathematically expressed as
Basis trade = S Ϫ F.
04_200306_CH04/Beaumont 8/15/03 12:48 PM Page 113
TLFeBOOK
Since we know that F ϭ S ϩ SRT for an underlying spot with no cash
flows, we can rewrite the above with simple substitution as
Basis trade = S Ϫ S Ϫ SRT.
The two spot terms cancel since one is a plus and the other is a minus,
and we are left with
Basis trade = Ϫ SRT.
The minus sign in front of our SRT term simply reminds us that in this
instance of going long the basis, we become short SRT (cost of carry). When
we are short anything
—
an equity, a bond, or a bar of gold
—
we want the
price of what we have shorted to go down. In this way the trade will be prof-
itable.
Since basis refers to those instances where one security type (e.g., spot)
is somehow paired off against another security type (e.g., futures), basis risk
is said to be the risk of trading two (or more) different security types within
a single strategy. The basis risk with the basis trade above is that prior to expi-
ration of the futures contract, the value of SRT can move higher or lower.
Again, since we want SRT to go lower, if it moves higher anytime prior to
expiration of the futures contract (as with a higher level of spot), this may be
of concern. However, if we are indifferent to market changes in the intervening
time between trade date and expiration, then our basis risk is not as relevant
as it would be for an investor with a shorter-term investment horizon.
If we know nothing else about SRT, we know that T (time) can go only
toward zero. That is, as we move closer and closer to the expiration date,
the value of T gets less and less. If we start the trade with 90 days to matu-
rity, for example, after 30 days T will be 60/360, not 90/360. And at expi-
ration, T is 0/360, or simply zero. Thus, it appears that we are virtually
assured of earning whatever the value is of SRT at the time we go long the
basis
—
that is, as long as we hold our basis trade to expiration.
114 FINANCIAL ENGINEERING, RISK MANAGEMENT, AND MARKET ENVIRONMENT
Spot
Forwards
or future
= Basis trade
Bond
Bond
SellBuy
FIGURE 4.1 Combining spot and futures to create a basis trade.
04_200306_CH04/Beaumont 8/15/03 12:48 PM Page 114
TLFeBOOK
Chapter 2 discussed how futures differ from forwards in that the latter
involve a marking-to-market as well as margin accounts. To take this a step
further, futures contract specifications can differ from one contract to
another as well. For example, in the simple case of gold, gold is a stan-
dardized homogeneous product, and there is a lot of it around. Accordingly,
when investors go long a gold futures contract and take delivery at expira-
tion, they are reasonably assured of exactly what they will be receiving.
In the world of bond futures, things are a little different. While gold is
homogeneous, bonds are not. Coupons and maturity dates differ across secu-
rities, outstanding supplies of bonds are uneven, and bond issuers embody
varying credit exposures. Accordingly, even for a benchmark Treasury bond
futures contract like the Chicago Board of Trade’s (CBOT’s) 10-year
Treasury bond future, there is some uncertainty associated with the deliv-
ery process for trades that actually go to that point. Namely, the CBOT deliv-
ery process allows an investor who is short a futures contract to decide
exactly which spot Treasury securities to deliver. However, the decision
process is narrowed down by two considerations:
1. The bonds that are eligible for delivery are limited to a predetermined
basket of securities to pick from.
2. There tends to be an economic incentive for delivering one or two spe-
cific bonds among the several that are eligible for delivery. In fact, the
most economical bond to deliver has a special name, and it is cheapest-
to-deliver (CTD).
1
This ability to make a choice of which security to
deliver has an associated value, and it is one of three different delivery
options embedded in a CBOT bond futures contract. When a basis trade
is held to the expiration of the futures contract and there is no change
in CTD, we would expect the total return on the trade to be equivalent
to cost-of-carry adjusted for the delivery options. Specifically, with a
basis trade involving a coupon-bearing bond and a bond future, we have
S
d
Ϫ F
d
ϫ CF,
where
S
d
ϭ P
d
(dirty price at time of trade)
F
d
ϭ S(1 ϩ T(R Ϫ Y
c
)) ϩ A
f
Ϫ O
d
.
Financial Engineering 115
1
The formula to calculate which security is cheapest-to-deliver is nothing more than
a basis trade expressed as an annualized total return; that is, ((F Ϫ S)/S)ϫ360/T,
where F is calculated with the relevant conversion factor and T is time in days from
trade date to expiration of the futures contract. The bond that generates the lowest
rate of return is CTD.
04_200306_CH04/Beaumont 8/15/03 12:48 PM Page 115
TLFeBOOK
With CFϭ1, the basis trade is
S
d
Ϫ (S(1 ϩ T(R Ϫ Y
c
)) ϩ A
f
Ϫ O
d
),
ϭϪS
d
T(R Ϫ Y
c
) Ϫ A
f
ϩ O
d
.
With our basis trade now equal to Ϫ S
d
T(R Ϫ Y
c
) Ϫ A
f
ϩ O
d
instead of
simply ϪSRT, we have a more complex situation to evaluate. The overall
value of the basis trade greatly depends on the relative values of R and Y
c
,
as shown in Table 4.1.
Even though the forward accrued interest term (ϪA
f
) and delivery
options term (O
d
) are unambiguous in terms of their respective values (where
A
f
is either negative or zero, and O
d
is either positive or zero), the overall
situation remains complex owing to the uncertainty of how all relevant vari-
ables ultimately interrelate with one another. For example, even if Ϫ S
d
T(R
Ϫ Y
c
) results in a negative value, its negative value combined with ϪA
f
may
or may not be enough to outweigh the positive value of O
d
. However, hav-
ing said all this, we can make some observations regarding potential values
as they march toward expiration. Quite simply, if Tϭ0, as at the expiration
of the basis trade, both O
d
and S
d
T(R Ϫ Y
c
) are zero as well. Accordingly,
at expiration, a basis trade will always end up with a maximum possible
return of S
d
T(R Ϫ Y
c
). This return will be modified (if by much at all) by
the value of A
f
.
Thus, if going long the bond basis results in a negative price value (as
is the result in the base case of no cash flows where carry is ϪSRT), a strat-
egy of going long the basis results in a short position in carry. Being short
carry generates a positive return as carry goes to zero. Conversely, if going
long the basis results in a price value that is positive (as may be the case with
a bond basis strategy where cash flows are now generated), then going long
the basis results in a long position in carry. In this instance being long carry
will generate a positive return as long as carry grows larger. Table 4.2 sum-
marizes these different profiles.
As a guide to thinking about potential returns with a basis trade strat-
egy, consider the following. For the base case of a basis trade involving an
underlying spot without cash flows (as with gold), and where we are going
long the basis (long S and short F), we end up with ϪSRT (negative carry).
116 FINANCIAL ENGINEERING, RISK MANAGEMENT, AND MARKET ENVIRONMENT
TABLE 4.1 Cost-of-Carry Value for Different Assumptions of R Relative to Y
c
R Ͼ Y
c
R Ͻ Y
c
R ϭ Y
c
Ϫ S
d
T(R Ϫ Y
c
) Ͻ 0 Ϫ S
d
T(R Ϫ Y
c
) Ͼ 0 Ϫ S
d
T(R Ϫ Y
c
) ϭ 0
Negative value Positive value Zero value
04_200306_CH04/Beaumont 8/15/03 12:48 PM Page 116
TLFeBOOK
Figure 4.2 presents three scenarios for the value of carry as time to expira-
tion approaches. As shown, if S and R are unchanged over the investment
horizon, then carry shrinks in a linear fashion as time slowly erodes. By con-
trast, if S and R decline over time, then negative carry becomes even more
negative, though is eventually forced to zero at expiration. And if S and R
increase over time, then negative carry becomes less negative, though once
again it inevitably goes to zero.
If we now expand the base case of a basis trade to involve a cash
flow–paying product type, such as a coupon-bearing bond, let us assume we
have a normal or upward–sloping yield curve and positive carry. Figure 4.3
presents three scenarios for the value of carry as expiration nears. Again,
carry is Ϫ S
d
T(R Ϫ Y
c
) ϪA
f.
Overall we have a curious situation where our basis investor is looking
for one part of the strategy to shrink in value (the carry that she is short)
while at the same time being long something within the same strategy (the
delivery options). However, as time passes both carry and the delivery
options will shrink to zero because both are a function of time
—
that is, unless
the delivery options take on intrinsic value.
If the intrinsic value of the delivery options is zero over the life of the
strategy, then the return of the basis trade will simply be equal to the full value
of the carry at the time the trade was originated. If intrinsic value is not zero,
then the exercise of the delivery options will depend on the relationship
Financial Engineering 117
TABLE 4.2 Buying/Selling the Basis to Be Short Carry under Various Scenarios
ϪSRT Ϫ S
d
T(R Ϫ Y
c
) ϪA
f
ϩ O
d
Ͻ 0 Ϫ S
d
T(R Ϫ Y
c
) Ϫ A
f
ϩ O
d
Ͼ 0
Buy the basis Buy the basis Sell the basis
to be short carry to be short carry to be short carry
Value of ϪSRT
Trade date Expiration date
O
OO
Ϫ
SRT
with increasing values for
S
and
R
Ϫ
SRT
with values unchanged for
S
and
R
Ϫ
SRT
with decreasing values for
S
and
R
FIGURE 4.2 Three scenarios for the value of carry.
04_200306_CH04/Beaumont 8/15/03 12:48 PM Page 117
TLFeBOOK
between intrinsic value and the accrued value of carry. In other words, if exer-
cising a delivery option means that the basis trade will cease to exist, then
any carry value remaining in the basis trade is forfeited.
Figure 4.4 presents the relationship between the value of carry and the
value of the delivery options as expiration approaches.
As long as S, R, Y
c
, and are virtually unchanged over the life of the
basis trade, then the value of carry will decline in a relatively linear fashion,
as depicted. By contrast, the time decay pattern of O
d
(as with options gen-
erally) is more curvilinear, as discussed in Chapter 5.
Of all the options said to be embedded in Treasury futures, the three most
commonly cited are the quality option, the wildcard option, and the timing
or cost-of-carry option. Regarding the quality option and the 10-year
Treasury futures contract, any Treasury maturing in not less than 6
1
/
2
years
or more than 10 years from the date of delivery may be delivered into a long
contract. Although only one deliverable bond is generally CTD at any one
time, the CTD may change several times between a given trade date and deliv-
ery date. Unique profit opportunities are associated with each change in CTD,
and investors are free to switch into more attractive cash/future combinations
over time. The transitory behavior of the CTD has value to the holder of a
short futures position, and the quality option quantifies this value.
As to the wildcard option, on each day between the first business day of
the delivery month and the seventh business day before the end of the delivery
month, the holder of a short bond futures position has until 9
P
.
M
. Eastern
Standard Time (EST) to notify the exchange of an intention to deliver.
“Delivery” means that deliverable securities are provided in exchange for a cash
payment. The investor who is short the futures contract sells the deliverable
securities, and the investor who is long the futures contract buys those securi-
ties. To determine how much ought to be paid for the delivered securities, an
invoice price is set at 3
P
.
M
. EST. The invoice price is calculated from the future’s
settlement price at 3
P
.
M
. EST on the day that a delivery notice is given. The
118 FINANCIAL ENGINEERING, RISK MANAGEMENT, AND MARKET ENVIRONMENT
Value of –SRT
Trade date Expiration date
O
OO
–S
d
and
R
unchanged,
Y
c
increasing
–S
d
, R,
and
Y
c
unchanged
–S
d
and
R
unchanged,
Y
c
decreasing
FIGURE 4.3 Three scenarios for the value of carry (expanded case).
04_200306_CH04/Beaumont 8/15/03 12:48 PM Page 118
TLFeBOOK
cash market does not close until 5
P
.
M
. EST, so there is a two-hour window of
opportunity when an investor holding a short future may profit from a decline
in the cash market. In actuality, the market often does not really close at 5
P
.
M
.,
remaining open for as long as there is a trader willing to make a market. Indeed,
even if one is hard pressed to find a market maker in the United States after
5
P
.
M
., it may not be difficult to find a market maker in Tokyo where the
trading day is just getting under way. The wildcard option thus values the
opportunity to profit from different trading hours for cash and futures.
Finally, the timing or cost-of-carry option attempts to quantify the opti-
mal time to make delivery. If there is a positive cost-of-carry, then there is an
incentive to put off delivery until the last possible delivery date. “Cost-of-carry”
means the difference between the return earned on a cash security and the cost
to finance that cash security in the repo market. If that difference is positive,
then there is a positive cost-of-carry. Cost-of-carry is usually positive when the
yield curve has a normal or positive shape. Conversely, if there is a negative
cost-of-carry, then there is an incentive to make delivery on the first possible
delivery date. Negative cost-of-carry exists if there is a negative difference
between the return earned on a cash security and the cost to finance that cash
Financial Engineering 119
0
OO
Value of carry
Value of
carry
Total return
Time
Date of
contract
expiration
Date of
initial trade
This line represents the total return profile for the carry component of
the basis trade as time approaches zero (date of contract expiration),
and the threshold return that
O
d
must rise above in order to have a
motive to exercise
O
d
prior to expiration of the basis trade
The value of carry and
total return profiles are
shown with opposite
slopes because as carry's
value declines, the return
on the basis trade
increases. This is because
an investor is short carry
in a basis trade.
These profiles are shown
as being linear, consistent
with the assumption that
S
d
,
R
,
Y
c
, and are
unchanged over time.
If the delivery options do not take on intrinsic value over the life of the basis
trade, then the value of
O
d
will trend steadily toward zero along with carry.
However, if the delivery options take on intrinsic value (as via the quality option),
then the option may be exercised prior to the expiration of the basis trade.
FIGURE 4.4 Values of carry (ϪSRT) and total return of carry as time approaches zero.
04_200306_CH04/Beaumont 8/15/03 12:48 PM Page 119
TLFeBOOK
security in the repo market. Cost-of-carry is usually negative when the yield
curve has a negative or inverted shape. In sum, the cost-of-carry option may
be viewed as an option on the slope of the yield curve. The timing option has
its greatest value when the yield curve has a normal shape and the option is
priced to the latest possible delivery date during the delivery month.
2
The various delivery options generally, including the yield shift option
or a new-auction option, can prove elusive to value and manage as some are
mutually exclusive and others are interdependent. Other texts go into
exhaustive detail; here it is sufficient to note that a short position in a futures
contract avails an investor with multiple choices that have value.
Again, the value for the basis prior to expiration is less than what it
would be at expiration since the delivery options would have no intrinsic
value. This is because the positive value of O
d
serves to minimize the nega-
tive value of carry. When O
d
has a value greater than zero (as is certainly
the case prior to expiration of the futures contract), the price of the futures
contract will be below the forward price of the CTD (since a forward does
not embody O
d
). For this reason many investors will refer to how futures
trade cheap to spot (trade at a price below spot owing to the delivery options
in the futures). While this is true by definition, it is not intended to refer to
relative value; the cheapness of futures to spot does not imply that the futures
investor is getting some kind of bargain, but rather that bond futures are
built differently from bond forwards and spot.
The following figures show potential scenarios for the value of O
d
over
time as well as the relationship of O
d
to carry in a total return context. O
d
is a function of all the usual variables associated with an option: S, R, T, K,
and V. Figure 4.5 presents the scenario where S, R, and V are unchanged as
time goes to zero.
Figure 4.6 shows the total return relationship between O
d
and cost-of-
carry (ϪSRT). Since an investor is short both O
d
and carry, these contribute
to the total return in a positive way as time passes.
In sum, and as illustrated in Figure 4.7, prior to expiration a basis trade
includes elements of spot, futures, and options. The maximum profit of the
strategy if held to expiration will be the carry’s initial value, and it may be more
120 FINANCIAL ENGINEERING, RISK MANAGEMENT, AND MARKET ENVIRONMENT
2
Recall that in Chapter 2 we stated that options are unique relative to spot and
forwards and futures since options embody the right (not the obligation) to do
something; to exercise or not to exercise. In the context of the delivery options
described here, the choices listed (what to deliver, when to deliver, and how to
deliver) all have some kind of value prior to expiration. The values may be derived
with traditional option pricing formulas or other methods. In sum, the term
“delivery options” is intended to be descriptive both as verb (as in “to choose
between delivering early or late in the delivery cycle”) and as noun (as in “the
calculated option price relevant for an expected CTD”).
04_200306_CH04/Beaumont 8/15/03 12:48 PM Page 120
TLFeBOOK
than that depending on the values of the various delivery options (and notably
if there were a beneficial change in CTD
3
). As shown, a relatively straight-
forward strategy like a basis trade can combine all three of the fundamental
cash flow elements. The triangle helps to show where key inter-relationships
begin and end.
Financial Engineering 121
OO
Value of
Time
Date of
contract
expiration
Date of
initial trade
O
d
FIGURE 4.5 Delivery option value over time.
OO
Total return
Time
Date of
contract
expiration
Date of
initial trade
Cost-of-carry plus
O
d
Cost-of-carry (–SRT)
contribution
O
d
contribution
FIGURE 4.6 Total return relationship between O
d
and cost-of-carry.
3
A beneficial change in CTD via the quality option is simply this: If a new bond
should happen to become CTD over the life of a futures contract, it could be
profitable to change the S portion of the basis trade to a new underlying S.
Deciding whether this would be profitable requires performing what-if calculations
on the basket of bonds eligible to be switched with the spot that is currently used
in the given basis trade.
04_200306_CH04/Beaumont 8/15/03 12:48 PM Page 121
TLFeBOOK
Securities lending (see Figure 4.8) consists of four steps, which are pre-
sented in the context of a gold transaction.
1. One investor (Investor A) pays the prevailing spot price for an ounce of gold.
2. Investor A immediately lends her gold for a prespecified amount of time
to Investor B in exchange for a loan of cash.
3. Investor A invests her loan of cash in a risk-free product (e.g., a
Treasury bill).
4. When a prespecified amount of time has passed (perhaps a month),
Investor A returns the loan of cash to Investor B, and Investor B returns
the loan of gold to Investor A.
In sum, Investor A is happy because she lent something (the gold) and
in exchange received a cash loan that she used to earn interest in a safe invest-
ment that otherwise would have just sat in her portfolio. Investor B, per-
haps a trading desk at an investment bank that specializes in these types of
transactions, is happy because of a satisfied need to borrow something
needed (gold) in exchange for a temporary loan (of cash). We can only pre-
sume that both Investor A and B were happy with the overall terms of the
loan transaction (namely the cash amounts paid and received); otherwise the
fundamental laws of economics suggest that the transaction would not have
been consummated in the first place.
122 FINANCIAL ENGINEERING, RISK MANAGEMENT, AND MARKET ENVIRONMENT
Spot
Options
Futures
S
If
V
is zero, then the basis trade value becomes its
carry value. Zero volatility implies zero uncertainty
and, hence, no value in choosing something that is
already known, as with what to deliver or when to
deliver it; in short, all options within the delivery
options package are worthless.
When
T
equals zero, as at the
expiration of the trade, then profit is
the full value of carry that was
originally shorted (assuming no
beneficial change in CTD and,
hence, no intrinsic value with
O
d
—
only time value, which is worthless
at expiration).
When
R
equals zero, then the
value of carry is zero (noting that
A
f
may be zero or negative), and
O
d
remains alive until expiration of
the strategy. The profit of the
strategy depends on
O
d
’s value
when the trade was first initiated.
F
ϭ
S
d
ϩ
S
d
T(R
Ϫ
Y
c
)
Ϫ
A
f
O
d
is a function of
S
,
T
,
R
,
K
, and
Bond Basis ϭ Ϫ
S
d
T
(
R
Ϫ
Y
c
) Ϫ
A
f
Ϫ
O
d
FIGURE 4.7 Bond basis.
04_200306_CH04/Beaumont 8/15/03 12:48 PM Page 122
TLFeBOOK
At this point readers may be asking what the real difference is between
a regular buy/sell transaction and the cash-and-carry trade just described.
After all, isn’t there one investor providing a security in exchange for cash
and another investor taking the security in exchange for cash? Yes. However,
a key difference is the mind-set of the two investors at the start of the trans-
action. Namely, both investors agree at the outset that the cash and securi-
ties involved are to be returned at some prespecified date in the future. There
also may be important differences in the tax treatment of a buy/sell versus
a lend/borrow strategy. This type of borrowing and lending of securities and
cash is commonplace, and is generally called securities lending. In the bond
market, it is often referred to as engaging in a repurchase agreement (or repo,
or reverse repo), as is discussed further in the next section.
Readers may have already surmised that a reverse repo (sometimes called
a cash-and-carry trade) is really a variation of a forward transaction; it is a
forward loan transaction where assets consisting of cash and securities guar-
antee the loan. Figure 4.9 illustrates this.
Why might investors be motivated to engage in a securities lending trans-
action as opposed to a simple forward transaction? From the perspective of
the investor lending the equity (or gold, or bond, or whatever), the differ-
ence between securities lending rate and the risk-free rate may be a favor-
able one. That is, the rate of return on the safe investment that is made with
the loan of money (in exchange for the loan of equity) could be advanta-
geous. And from the perspective of the investor borrowing the equity, the
ability to show the equity in a portfolio (if even for just a short period of
time) allows him or her to show a position in the security that suits a par-
ticular strategy or objective.
Earlier in this chapter it was said that a bond future’s CTD is determined
by the lowest total return (which, incidentally, happens to be the same cal-
culation for a total return for a basis trade). This total return value is some-
times called an implied repo rate (or implied securities lending rate), and it
is applicable for basis trades on bonds and equities or any other security type.
The reason is that the incentive for investors doing a basis trade rather than
a securities lending trade may be the simple difference between how they are
compensated for doing one trade over the other. Accordingly, an implied
Financial Engineering 123
Spot
Forward = Securities lending
Gold
Cash
LoanBorrow
FIGURE 4.8 Use of spot and forward to create a securities lending strategy.
04_200306_CH04/Beaumont 8/15/03 12:48 PM Page 123
TLFeBOOK
securities lending rate might be more appropriately called a breakeven secu-
rities lending rate for the simple reason that if the true securities lending rate
were ever less than the breakeven securities lending rate, it would be desir-
able for investors to execute this arbitrage strategy:
Ⅲ Buy the spot security underlying the futures contract.
Ⅲ Go short an equal face amount of the futures contract.
Ⅲ Finance the spot security in the securities lending market.
Since the spot security can be financed at the lending rate for less than the
implied lending rate, the return earned on this strategy is an arbitraged profit,
and the profit is equal to the difference in the true and implied lending rates.
Since cost-of-carry can be positive, zero, or even negative, a product that
pays a dividend or a coupon will exhibit positive carry whenever the cur-
rent yield of the product is above its financing rate. With bonds, this is typ-
ically the case when the yield curve has a positive or upward-sloping shape,
as it usually does.
Repeating the formula for a call option, we have
O
c
ϭ F Ϫ K ϩ V.
If investors believe volatility will soon move much higher than anyone
expects, they may want to create a strategy that isolates volatility and ben-
efits from its anticipated change as suggested by Figure 4.10. Why isolate
volatility? Because our investors are not interested in F (or even X, but X is
124 FINANCIAL ENGINEERING, RISK MANAGEMENT, AND MARKET ENVIRONMENT
OO
Investor A agrees to accept a
security from Investor B in 3
months, and at the 3-month
forward price agreed at trade
date.
Investor A provides Investor B
with the forward price of the
security in exchange for the
security.
Investor A lends Investor B the
security that is to be returned in
3 months. In exchange,
Investor B agrees to lend
Investor A cash over the 3-
month period. The amount of
the cash lent is equal to the
security’s spot price.
Investor B returns Investor
A’s security, and Investor A
returns Investor B’s loan
plus interest. The dollar
amount of the interest is
equal to the difference
between the security’s spot
and forward prices of 3
months earlier.
Assets in support
of the loan
The forward loan
Trade date 3 months later
FIGURE 4.9 Reverse repo as a variation of a forward transaction.
04_200306_CH04/Beaumont 8/15/03 12:48 PM Page 124
TLFeBOOK