STUDY GUIDE FOR COME INTO MY TRADING ROOM phần 10 pdf
Bạn đang xem bản rút gọn của tài liệu. Xem và tải ngay bản đầy đủ của tài liệu tại đây (243.44 KB, 29 trang )
moving averages are rising at the right edge—bullish. MACD-Histogram
and MACD-lines are also rising, confirming the bullish power.
Entry Ratings
W
EEKLY CHART
A—Bullish divergence of MACD-Histogram: 1 point
B—Bullish divergence of MACD-lines: 1 point
C—Price below the EMA, in the undervalued zone: 1 point
D—Breakout: 1 point
D
AILY CHART
A—Bullish upswing of Force Index: 1 point
B—Rising MACD-Histogram and MACD-lines: 1 point
C—Rising 13-day and 22-day EMAs: 1 point
D
ECISION
Go long KROL, with a stop at the upper edge of the gap and observe
money management rules: 3 points.
Alternatively, wait to buy when a daily low touches the fast EMA, and
adjust buy orders daily: 3 points.
The reason we may consider buying KROL this high is that the market
underwent a sudden and massive fundamental change.
P
ASS POINT 7
ANSWERS 173
B
C
A
Chart A3-b
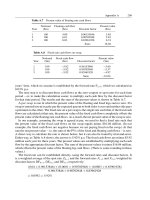
Trade 3: Kroll Inc KROL—Exit Answer
174 CASE STUDIES
The first selling opportunity in KROL comes in the area A, where the
stock penetrates its channel, while Force Index traces a bearish diver-
gence. There is a great reentry opportunity in area B, when KROL
returns to its fast EMA. We need to calculate this EMA daily, estimate its
value for tomorrow, and put our buy order in that area.
The rally in area C offers us a choice—take profits above the enve-
lope or continue to hold because peak C of Force Index is even higher
than peak A. When bulls grow stronger as prices rise, they tell us that
higher prices are likely ahead.
The pullback to the EMA in area D presents another good opportu-
nity to reestablish long positions or to add to existing ones. The rally in
area E creates the best exit opportunity for longs—bearish divergence
C-E of Force Index shows that bulls are running out of steam, while the
failure of prices to reach their upper channel line confirms this message.
MACD-Histogram also traces a bearish divergence, in tandem with
Force Index. It is the end of the game for the bulls, the bells are ringing,
warning you that the uptrend is ready to reverse.
entry
long
ABC DE F G
Chart A3-c
The sharp drop in area F must hit any sensible stop-loss or protect-
profit order. Both EMAs turn down in area G, screaming to sell. But this
exit is strictly for the beginners who goofed and missed much more
profitable earlier exits.
Exit Ratings
D
AILY CHART A-3C
Sell longs in area A: 3 points
Hold longs in area A: 3 points
Add to longs in area B: 3 points
Sell longs in area C: 3 points
Hold longs in area C: 3 points
Add to longs in area D: 3 points
Sell longs in area E: 5 points
Sell longs in area F: 1 point
Sell longs in area G: 1 point
P
ASS POINT 13
ANSWERS 175
Trade 4: Imclone Systems IMCL—Entry Answer
IMCL: A Steady Trend Against a Pervasive Enemy
176 CASE STUDIES
A key principle of the Triple Screen trading system is to make strategic
decisions on long-term charts, and then turn to short-term charts for tac-
tical decisions about entries and exits. The weekly chart of IMCL shows
a series of slow and steady swings, each lasting several months. If we
can get in gear with an upswing, we should trade from the long side as
long as it continues. If we get in gear with a downswing, we can con-
tinue shorting for as long as that downmove stays in force.
At the right edge of the weekly chart, in area A, both weekly EMAs
have turned up, giving buy signals. At the same time, MACD-Histogram
has ticked up, reinforcing the bullish message (this is an Impulse System
buy—both the EMA and MACD-Histogram point higher).
IMCL has been stuck in a flat trading range for the past two months.
The bottoms of MACD-Histogram have become shallow, showing that
bears are becoming weaker. Bulls, at the same time, have maintained
their strength—the rallies of MACD-Histogram above its centerline have
been rising to the same level during those two months. As prices push
higher, toward overhead resistance near the right edge, Force Index
A
Chart A4-a
rises to a new multimonth high, confirming bullish strength. At the same
time, prices punch up through the resistance, closing above that level.
This breakout turns resistance into support, which is likely to create a
bottom under any decline.
Entry Ratings
W
EEKLY CHART
A—An uptick of MACD-Histogram: 1 point
A—An uptick of both moving averages: 1 point
D
AILY CHART
A—Bullish upswing of MACD-Histogram: 1 point
B—New high of Force Index: 1 point
C—Upside breakout through overhead resistance: 1 point
D
ECISION
Go long IMCL, with a stop below the previous day’s low, and observe
money management rules: 3 points.
Alternatively, wait to buy when the low of a daily bar touches the fast
EMA; keep adjusting buy orders daily: 3 points.
P
ASS POINT 6
ANSWERS 177
A
B
C
Chart A4-b
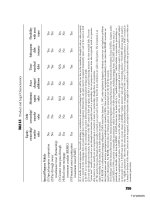
Trade 4: Imclone Systems IMCL—Exit Answer
178 CASE STUDIES
IMCL offers a profit-taking opportunity at point A, just two days after the
entry. Prices blow outside of their channel, marking an overbought con-
dition, a selling opportunity. A decline that follows takes IMCL down
into the “sweet zone”—the value area between the fast and the slow
EMAs.
There is a window in September—a blank spot following the sus-
pension of trading after the terrorist acts of September 11. Most stocks
sank after the markets reopened, but not IMCL. Two days later Force
Index rallies to a fantastic peak, indicating a great buildup of buying
pressure. When a stock bucks the trend of the market, it sends a strong
message that it really wants to go its way, no matter what.
There is a decision to be made in area C—to take profits above the
envelope or to continue to hold. The great height of peak C of Force
Index indicates that higher prices are likely ahead because bulls grow
stronger as prices rise.
If you sell, IMCL provides a new buying opportunity in area D, where
it declines below its fast EMA, and an even better opportunity in area E.
The volatility decreases, and prices stay for a few days in that value
zone between the two EMAs, before embarking on a new rally.
entry
long
AB C D EF GHI
Chart A4-c
That rally, and the following one, starting from the bottom F, are
decidedly anemic affairs. IMCL is still trending higher, but losing its old
vigor. When the rally H approaches the upper channel line, it offers
a chance to take profits. There is one final good exit, in area I, where a
bearish divergence of Force Index is shouting to sell.
Exit Ratings
D
AILY CHART A-4C
Sell longs in area A: 3 points
Hold longs in area A: 3 points
Add to longs in area B: 3 points
Sell longs in area C: 3 points
Add to longs in area D: 3 points
Add to longs in area E: 3 points
Add to longs in area F: 1 point
Add to longs in area G: 1 point
Sell longs in area H: 3 points
Sell longs in area I: 3 points
P
ASS POINT 14
ANSWERS 179
Trade 5: Wheat—Entry Answer
Wheat—Everybody Eats It
180 CASE STUDIES
Commodities are the essential building blocks of the economy. Nobody
really needs a share of amazon.com—it may be a nice speculation, but
if AMZN disappears, somebody else will sell books and we’ll find some-
thing else to trade. On the other hand, we could not live our normal
lives without wheat, cotton, sugar, or other commodities.
Since commodity contracts expire every few months, we need to use
perpetual or continuous contracts to analyze long-term weekly charts.
Those are mathematical constructs that combine the nearby actual
contracts in a seamless transition. We use real contracts to study the
daily charts.
At the right edge of the weekly chart, wheat appears to be at the tail
end of a multiyear bear market—it is the cheapest it has been in more
than a decade. Both EMAs are declining, but MACD-Histogram is flash-
ing the only signal that can override the message of the EMAs—a bull-
ish divergence between the indicator and price. There is also a bullish
divergence by MACD-lines, rarely seen on the weekly charts.
At the right edge of the daily chart, wheat has just penetrated a his-
toric low, set a week ago, earlier in September. Wheat failed to follow
A
B
C
Chart A5-a
through on that downside breakout and ticked up instead. Both MACD-
Histogram and MACD-lines, as well as Force Index, have traced bullish
divergences—higher indicator bottoms at a time when prices traced a
deeper bottom. This is an excellent buying opportunity, with a tight stop
immediately below the latest lows.
Entry Ratings
W
EEKLY CHART
A—Bullish divergence of MACD-Histogram: 1 point
B—Bullish divergence of MACD-lines: 1 point
C—Price below value, below both moving averages: 1 point
D
AILY CHART
A—Bullish divergence of MACD-Histogram: 1 point
A—Bullish divergence of MACD-lines: 1 point
B—Bullish divergence of Force Index: 1 point
C—False downside breakout: 1 point
D
ECISION
Go long wheat, with a stop below the current week’s low, and ob-
serve money management rules: 3 points.
P
ASS POINT 7
ANSWERS 181
C
A
B
Chart A5-b
Trade 5: Wheat—Exit Answer
182 CASE STUDIES
Wheat slowly gathers steam, as it starts rallying from its multiyear low.
Its daily ranges are narrow and prices do not outrun the EMAs very far.
Slow rallies tend to persist longer than wild affairs. Still, it would be
tempting to take profits in area A, after wheat manages to put some air
between itself and its moving averages.
Area B offers a good opportunity to reestablish longs or to add to the
existing ones when wheat pokes into the value zone between the two
EMAs. A conscientious trader calculates his EMAs daily, projects them
one day ahead, and places his entry orders accordingly.
After touching its EMAs in area B, wheat explodes into area C, where
it offers a perfect profit-taking opportunity. Prices blow out of their
channel into overvalued territory, accompanied by a bearish divergence
of Force Index, which shows that prices are rising only out of inertia,
as bulls have less force.
Prices sink back to their EMAs in area D, tempting traders to re-
position long; only instead of rallying they continue to sink, hitting stops.
In area E both EMAs turn down, canceling the buy signal altogether.
This is the end of the bullish campaign in wheat for the time being.
entry
long
ABC D E
Chart A5-c
Nobody can know the future with certainty. All we can do is play the
probabilities, buy at the rising EMA, and take profits in the vicinity of
the upper channel line, all the while protecting our positions with stops.
We may move stops only in the direction of the trade, never against it.
Exit Ratings
D
AILY CHART A-5C
Sell longs in area A: 3 points
Add to longs in area B: 3 points
Sell longs in area C: 5 points
Add to longs in area D: 3 points
Cancel buy orders and liquidate any remaining longs in area E: 3 points
P
ASS POINT 9
ANSWERS 183
Trade 6: Vimpel Communications VIP—Entry Answer
VIP—Rubles to Dollars
184 CASE STUDIES
We can apply technical analysis to markets in all countries because of the
essential similarity of human beings. The veneer of civilization gives us
different appearances, but underneath we are all wired the same way.
When people feel stressed, their behavior patterns are remarkably similar
across cultural divides. Technical analysis picks up the behavior of peo-
ple under stress. If you had not known that VIP was a Russian stock, you
would have analyzed it in the same way as any other stock on your list.
VIP had its IPO in the high 20’s and then twice stabbed at the 60 level
before sinking in the 2000–2001 bear market. Once it slid below 20,
several technical patterns began to emerge, which eventually coalesced
into a trading signal at the right edge of the chart.
MACD-Histogram has traced a long-term bullish divergence A, fol-
lowed by a bullish divergence B of MACD-lines. Prices have traced a
“saucer bottom” that held all the declines, and a flat top that knocked
back rallies. Finally, at point D, prices broke through that resistance.
EMAs, MACD-Histogram, and MACD-lines turned higher at that point.
At the right edge of the daily chart, VIP has broken above its August
peak and is holding that level, refusing to decline. The breakout was
B
A
D
C
Chart A6-a
confirmed by peak A in Force Index whose highest reading in several
months called for higher prices ahead. Can we call the pattern of
MACD-Histogram a bearish divergence? No, because it never declined
below the centerline between the two peaks—it is merely a broad, pow-
erful top. At point B both EMAs are rising, confirming the power of bulls.
Entry Ratings
W
EEKLY CHART
A—Bullish divergence of MACD-Histogram: 1 point
B—Bullish divergence of MACD-lines: 1 point
C—Saucer bottom: 1 point
D—Upside breakout, confirmed by uptrending EMAs, MACD-
Histogram, and MACD-lines: 1 point
D
AILY CHART
A—Record peak of Force Index: 1 point
B—Rising EMAs: 1 point
D
ECISION
Go long VIP at the fast EMA, with a stop below the week’s low, and
observe money management rules: 3 points.
P
ASS POINT 6
ANSWERS 185
AB
Chart A6-b
Trade 6: Vimpel Communications VIP—Exit Answer
186 CASE STUDIES
VIP starts rising slowly, retreating to its EMA and giving traders a chance
to get long near value. It gathers steam and hits its upper channel line
in area A, where Force Index rises to a new multimonth high. That is a
sign of the great force of bulls, pointing to the likelihood of higher
prices ahead. That peak makes it very tempting to hold through what-
ever decline may lay ahead. Still, there is no harm in selling and look-
ing to reposition long when the stock sinks back near value in the area
of its fast EMA.
In area B, VIP declines into “the sweet zone” between the two EMAs;
its daily ranges shrink, as lower prices do not attract traders’ attention.
Prices pop up in area C, then retreat without reaching the upper chan-
nel line. The next rally, in area D, provides a superb selling opportunity.
Prices reach the upper channel line, an overvalued area. At the same
time, Force Index, which had been calling for higher and higher prices,
traces a bearish divergence C-D. It shows that bulls are running out of
steam, and the rally is close to its top.
Prices stab below the slow EMA and offer another buying oppor-
tunity in area E before embarking on a new upleg of rally. One of the
entry
long
A
BC DE
Chart A6-c
key differences between professionals and amateurs is that the pros
recognize signals early, while they are still a bit fuzzy and indistinct. An
amateur keeps waiting for clear and certain signals. By the time those
emerge, a trade is ripe for a reversal.
There are two main types of risk—money risk and information risk.
An amateur is quick to accept money risks as he enters well-established
trends where stops are far away, but the trend is pretty clear and the
information risk is low. Professionals, on the other hand, are much more
at ease with the information risk, acting in the atmosphere of uncer-
tainty, as long as their money risks are low.
Exit Ratings
D
AILY CHART A-6C
Sell longs in area A: 3 points
Add to longs in area B: 3 points
Sell longs in area C: 3 points
Sell longs in area D: 5 points
Buy longs in area E: 3 points
P
ASS POINT 9
ANSWERS 187
Trade 7: International Business Machines IBM—Entry Answer
IBM
—Steady Green from Big Blue
188 CASE STUDIES
Even a quick glance at this chart reveals that IBM has spent the past
several years in a broad trading range. Whenever it declines below
90, it is time to look for a bottom, and whenever it rallies towards 120,
it is time to look for a top.
At the right edge of the chart, in area A, IBM has recoiled from sup-
port and is headed higher. This rally is confirmed by the uptick of
weekly MACD-Histogram. Note that there is no bullish divergence,
simply an upside reversal of prices and the indicator. The fast EMA has
already turned up, confirming the rally and giving an Impulse buy sig-
nal, while the slower EMA has gone flat, a normal behavior at an early
stage of a rally.
The daily chart of IBM shows increased volatility following the
September interruption of trading on the NYSE. By the end of that
month, Force Index traces a bullish divergence A—a more shallow
bottom of the indicator during a deeper price bottom. The new high of
Force Index in area B calls for higher prices ahead; this message is con-
firmed by the uptrend of MACD in area C. The uptrend is further
A
Chart A7-a
confirmed when both EMAs turn up at the right edge of the chart in area
D. The low of the last daily bar still touches both EMAs, a value area.
Entry Ratings
W
EEKLY CHART
A—Bullish uptrend of MACD-Histogram: 1 point
A—Uptrend confirmed by the rising fast EMA: 1 point
D
AILY CHART
A—Bullish divergence of Force Index: 1 point
B—Record peak of Force Index: 1 point
C—Uptrend of MACD: 1 point
D—Rising EMAs: 1 point
D
ECISION
Go long IBM near the fast EMA, with a stop below the week’s low,
and observe money management rules: 3 points.
P
ASS POINT 6
ANSWERS 189
B
D
A
C
Chart A7-b
Trade 7: International Business Machines IBM—Exit Answer
190 CASE STUDIES
IBM is a typical blue chip, moving slowly and steadily, with none of the
wild gyrations seen in so many “cats and dogs.” The slope of the slow
22-day EMA tracks the trend, while the faster 13-day EMA identifies value
levels for entries.
At point A, IBM rises near its upper channel line, offering the first of
many selling opportunities. Two days later it backs down, touching the
fast EMA. This pullback to value provides an excellent opportunity to
hop aboard if you missed the first buy signal. Professional traders who
have plenty of experience carrying large positions often use such pull-
backs for pyramiding. They keep adding to their original positions,
building them to a larger size, until they get an extra-strong exit signal,
at which point they sell the whole lot.
The rally in area C provides another opportunity to take profits, as
prices touch their upper channel line, an overvalued area. That rally is
followed by a decline back to the EMA in area D, offering yet another
opportunity to go long. This is the beauty of trading swings in blue
chips. All you need to do is find a few stocks that exhibit regular swings,
fine-tune your EMAs and channels, and start buying value and selling
overvalued levels or shorting value and covering undervalued levels.
entry
long
AB C D E F G
Chart A7-c
IBM rises into area E but fails to reach its upper channel line, a sign
of lessening bullish power. If you miss this signal to sell, IBM rings a
loud bell a few days later in area F. Another rally fails to reach the upper
channel line, signifying weakness. At the same time, Force Index traces
a bearish divergence E-F, calling for more weakness ahead. This is the
type of strong sell signal that professionals await before banging out of
their entire positions.
IBM offers yet another opportunity to get long, in area G, near the
EMA, but it is very questionable whether we should take that signal.
The trend is still rising, but going long so soon after a bearish divergence
is seldom a good idea because more weakness can be expected. From
that point onward, IBM goes flat, tying up a trader’s capital and, more
perniciously, his attention, which could be more profitably invested in
other stocks.
Exit Ratings
D
AILY CHART A-7C
Sell longs in area A: 3 points
Add to longs in area B: 3 points
Sell longs in area C: 3 points
Add to longs in area D: 3 points
Sell longs in area E: 3 points
Sell longs in area F: 5 points
Add to longs in area G: 1 point
P
ASS POINT 11
ANSWERS 191
Trade 8: Biovail Corporation BVF—Entry Answer
BVF—Bull Market Punctuated by Sharp Breaks
192 CASE STUDIES
This chart shows a private bull market in BVF. The stock is moving from
the lower left to the upper right corner of the chart while most other
stocks are in the midst of a broad bear market. This uptrend is occa-
sionally penetrated by sharp downdrafts, which do enough damage in
a few weeks to wipe out the gains of several months.
To a beginner who comes late to the bullish party, each of those
downdrafts can spell disaster. A pro, familiar with the past, is more
likely to view those declines as buying opportunities. He is also likely
to be extra careful with stops, protecting himself from sudden down-
moves.
At the right edge of the chart, in area A, BVF has recovered from its
post-September 11 dip. It has cleaned out weak bulls and is ready to
resume its uptrend. The upmove is confirmed by an uptick of weekly
MACD-Histogram, and an upturn of both weekly EMAs.
The daily chart of BVF shows increased downward volatility after the
September 11 trading halt. The stock takes out its July low, but there is
no follow-through to that breakout, which is a bullish sign. Within a
A
Chart A8-a
week, an even stronger bullish sign appears—a positive divergence of
Force Index. It makes a more shallow second low, even as prices con-
tinue to pound their lows, below 39. The rally following the decline is
very sharp, turning up both EMAs at the right edge of the chart—another
bullish sign.
Entry Ratings
W
EEKLY CHART
A—Uptick of MACD-Histogram: 1 point
A—Uptrend confirmed by the rising EMAs: 1 point
D
AILY CHART
A—Bullish divergence of Force Index: 1 point
B—Rising EMAs: 1 point
D
ECISION
Go long BVF near the fast EMA, with a stop below the week’s low,
and observe money management rules: 3 points.
P
ASS POINT 5
ANSWERS 193
A
B
Chart A8-b
Trade 8: Biovail Corporation BVF—Exit Answer
194 CASE STUDIES
BVF shoots out of the gate in September and runs until it reaches the
upper channel line, the profit-taking area, while Force Index traces a
bearish divergence in area A. Notice a less distinct divergence a few
days earlier. When a beginning trader faces such a pattern, he is better
off taking profits early, while a more experienced trader may elect to
hold. An important early step in a trader’s development is learning to take
profits without kicking himself for having left some money on the table.
Learning to hold for a maximum gain is a skill that is best learned later.
Biovail sinks below its slow EMA in area B, offering an opportunity
to get long below value. The stock rallies again in area C, and even
though that rally never reaches the upper channel line, an extremely
high peak of Force Index reveals the power of bulls and calls for higher
prices ahead. If you took profits in area C, fine; if you decided to hold,
even better, because such extreme peaks of Force Index show that bulls
are very strong and higher prices are likely ahead.
BVF sinks below its EMAs in area D—notice its repetitive behavior in
penetrating the EMA. Once you recognize such a pattern, put your buy
entry
long
ABCD EFG
Chart A8-c
order as many points below the EMA as the average depth of past
penetrations.
Biovail rallies again in areas E, F, and G. None of those rallies reach
the upper channel line, reflecting the weakness of bulls. At the same
time, Force Index starts tracing lower and lower peaks. Those bearish
divergences indicate that the top is near. Look back at the record peak
of Force Index in area C—it reflected great power of the bulls and called
for higher rallies ahead. That forecast has now been fulfilled, and in
areas F and G Force Index is giving an opposite message—that the top
is at hand. Good technical indicators work like headlights on a car.
They do not show you the entire way home, but light up enough of the
distance ahead so that if you travel at a reasonable speed, you can
anticipate the next turn in the road.
Exit Ratings
D
AILY CHART A-8C
Sell longs in area A: 5 points
Add to longs in area B: 3 points
Sell longs in area C: 3 points
Add to longs in area D: 3 points
Sell longs in area E: 3 points
Sell longs in area F: 5 points
Add to longs in area G: 3 points
P
ASS POINT 13
ANSWERS 195
THE ROAD AHEAD
Y
ou can learn to trade. To begin, you need some basic skills—dis-
cipline, risk tolerance, and facility with numbers. You need knowl-
edge, which can be acquired through dedicated study. By working
through the Study Guide you have proven that you have what it takes
to grow into a successful trader.
Now is the time to put your time and energy into setting up
your trading operation. Design a record-keeping system, establish
money management rules, and write your trading plan. This calls
for a lot of work, but many of us find trading a fantastically inter-
esting challenge. The rewards, if you do it right, are nothing to sneeze
at either.
I enjoyed creating these exercises. People who came to my Traders’
Camps were the first to learn my methods, take the tests, and comment
on them. I also want to thank two people who put their own projects
aside to help me prepare this book. Fred Schutzman, a technical analyst
and money manager in New York, is an old and loyal friend who took
every test in this book, graded his performance, and then pointed out
several questions and answers that had to be rephrased, rearranged, or
clarified. When it comes to analysis and trading, no imperfection can
slip by Fred! My oldest daughter Miriam, a journalist and a graduate
student in Paris, went through my English with a red pen. English is my
third language, and the little girl, who is actually no longer so little,
is now fixing the English for the guy who used to read The Little Engine
That Could to her at bedtime.
You have worked through this book, but closing it does not mean
having to say good-bye. If I continue to run my Traders’ Camps, you
197
![the official chfi study guide for computer hacking forensics investigators [exam 312-49]](https://media.store123doc.com/images/document/14/rc/qf/medium_qfh1395724342.jpg)