Statistics for Environmental Engineers Second Edition phần 7 ppsx
Bạn đang xem bản rút gọn của tài liệu. Xem và tải ngay bản đầy đủ của tài liệu tại đây (1.77 MB, 46 trang )
© 2002 By CRC Press LLC
The regression is not strictly valid because both BOD and COD are subject to considerable measure-
ment error. The regression correctly indicates the strength of a linear relation between BOD and COD,
but any statements about probabilities on confidence intervals and prediction would be wrong.
Spearman Rank-Order Correlation
Sometimes, data can be expressed only as ranks. There is no numerical scale to express one’s degree of
disgust to odor. Taste, appearance, and satisfaction cannot be measured numerically. Still, there are situations
when we must interpret nonnumeric information available about odor, taste, appearance, or satisfaction.
The challenge is to relate these intangible and incommensurate factors to other factors that can be measured,
such as amount of chlorine added to drinking water for disinfection, or the amount of a masking agent
used for odor control, or degree of waste treatment in a pulp mill.
The Spearman rank correlation method is a nonparametric method that can be used when one or both
of the variables to be correlated are expressed in terms of rank order rather than in quantitative units
(Miller and Miller, 1984; Siegel and Castallan, 1988). If one of the variables is numeric, it will be
converted to ranks. The ranks are simply “A is better than B, B is better than D, etc.” There is no attempt
to say that A is twice as good as B. The ranks therefore are not scores, as if one were asked to rate the
taste of water on a scale of 1 to 10.
Suppose that we have rankings on n samples of wastewater for odor [x
1
, x
2
,…, x
n
] and color [y
1
, y
2
,…, y
n
].
If odor and color are perfectly correlated, the ranks would agree perfectly with x
i
= y
i
for all i. The
difference between each pair of x,y rankings will be zero: d
i
= x
i
− y
i
= 0. If, on the other hand, sample
8 has rank x
i
= 10 and rank y
i
= 14, the difference in ranks is d
8
= x
8
− y
8
= 10 − 14 = −4. Therefore, it
seems logical to use the differences in rankings as a measure of disparity between the two variables.
The magnitude of the discrepancies is an index of disparity, but we cannot simply sum the difference
because the positives would cancel out the negatives. This problem is eliminated if is used instead of d
i
.
If we had two series of values for x and y and did not know they were ranks, we would calculate
, where x
i
is replaced by and y
i
by The sums are over the n observed values.
TABLE 31.1
Ninety Paired Measurements of Effluent Five-Day BOD and Effluent COD
Concentrations
COD BOD COD BOD COD BOD COD BOD COD BOD
9.1 4.5 6.0 3.6 7.6 4.4 11.2 3.8 16.5 7.5
5.7 3.3 4.5 5.0 8.1 5.9 10.1 5.9 13.6 3.4
15.8 7.2 4.7 4.1 7.3 4.9 17.5 8.2 12.0 3.1
7.6 4.0 4.3 6.7 8.5 4.9 16.0 8.3 11.6 3.9
6.5 5.1 9.7 5.0 8.6 5.5 11.2 6.9 12.5 5.1
5.9 3.0 5.8 5.0 7.8 3.5 9.6 5.1 12.0 4.6
10.9 5.0 6.3 3.8 7.2 4.3 6.4 3.4 20.7 4.6
9.9 4.3 8.8 6.1 8.5 3.8 10.3 4.1 28.6 15.3
8.3 4.7 5.7 4.1 7.0 3.1 11.2 4.4 2.2 2.7
8.1 4.2 6.3 4.2 22.8 14.2 7.9 4.9 14.6 6.0
12.4 4.6 9.7 4.3 5.0 4.8 13.1 6.4 15.2 4.8
12.1 4.8 15.4 4.0 3.7 4.4 8.7 6.3 12.8 5.6
10.2 4.7 12.0 3.7 6.2 3.9 22.7 7.9 19.8 6.3
12.6 4.4 7.9 5.4 7.1 4.5 9.2 5.2 9.5 5.4
10.1 4.1 6.4 4.2 5.9 3.8 5.7 4.0 27.5 5.7
9.4 5.2 5.7 3.9 7.5 5.9 17.2 3.7 20.5 5.6
8.1 4.9 8.0 5.7 10.0 5.2 10.7 3.1 19.1 4.1
15.7 9.8 11.1 5.4 2.8 3.1 9.5 3.7 21.3 5.1
Note: Concentrations are expressed as mg/L.
d
i
2
r
∑x
i
y
i
∑x
i
2
∑y
i
2
= x
i
x– y
i
y– .
L1592_Frame_C31 Page 283 Tuesday, December 18, 2001 2:50 PM
© 2002 By CRC Press LLC
Knowing that the data are rankings, we can simplify this using which gives
and:
The above equation can be used even when there are tied ranks. If there are no ties, then
and:
The subscript S indicates the Spearman rank-order correlation coefficient. Like the Pearson product-
moment correlation coefficient, r
S
can vary between −1 and +1.
Case Study: Taste and Odor
Drinking water is treated with seven concentrations of a chemical to improve taste and reduce odor. The
taste and odor resulting from the seven treatments could not be measured quantitatively, but consumers
could express their opinions by ranking them. The consumer ranking produced the following data, where
rank 1 is the most acceptable and rank 7 is the least acceptable.
The chemical concentrations are converted into rank values by assigning the lowest (0.9 mg/L) rank 1
and the highest (4.7 mg/L) rank 7. The table below shows the ranks and the calculated differences. A
perfect correlation would have identical ranks for the taste and the chemical added, and all differences
would be zero. Here we see that the differences are small, which means the correlation is strong.
The Spearman rank correlation coefficient is:
From Table 31.2, when n = 7, r
s
must exceed 0.786 if the null hypothesis of “no correlation” is to be
rejected at 95% confidence level. Here we conclude there is a correlation and that the water is better
when less chemical is added.
Comments
Correlation coefficients are a familiar way of characterizing the association between two variables.
Correlation is valid when both variables have random measurement errors. There is no need to think of
one variable as x and the other as y, or of one as predictor and the other predicted. The two variables
stand equal and this helps remind us that correlation and causation are not equivalent concepts.
Water Sample A B C D E F G
Taste and odor ranking 1234567
Chemical added (mg/L) 0.9 2.8 1.7 2.9 3.5 3.3 4.7
Water Sample A B C D E F G
Taste ranking 1 2 3 4 5 6 7
Chemical added 1 3 2 4 6 5 7
Difference, d
i
0 −11 0−11 0
d
i
2
x
i
y
i
–()
2
= ,
x
i
y
i
1
2
x
i
2
y
i
2
d
i
2
–+()=
r
S
∑ x
i
2
y
i
2
d
i
2
–+()
2 ∑x
i
2
∑y
i
2
∑x
i
2
∑y
i
2
∑d
i
2
–+
2 ∑x
i
2
∑y
i
2
==
∑x
i
2
∑y
i
2
==
nn
2
1–()/12
r
S
1
6∑d
i
2
nn
2
1–()
–=
r
s
1
6∑ 1–()
2
1
2
1
2
1–()
2
+++
77
2
1–()
– 1
24
336
– 0.93===
L1592_Frame_C31 Page 284 Tuesday, December 18, 2001 2:50 PM
© 2002 By CRC Press LLC
Familiarity sometimes leads to misuse so we remind ourselves that:
1. The correlation coefficient is a valid indicator of association between variables only when that
association is linear. If two variables are functionally related according to y = a + bx + cx
2
, the
computed value of the correlation coefficient is not likely to approach ±1 even if the experimental
errors are vanishingly small. A scatterplot of the data will reveal whether a low value of r results
from large random scatter in the data, or from a nonlinear relationship between the variables.
2. Correlation, no matter how strong, does not prove causation. Evidence of causation comes
from knowledge of the underlying mechanistic behavior of the system. These mechanisms
are best discovered by doing experiments that have a sound statistical design, and not from
doing correlation (or regression) on data from unplanned experiments.
Ordinary linear regression is similar to correlation in that there are two variables involved and the
relation between them is to be investigated. In regression, the two variables of interest are assigned
particular roles. One (x) is treated as the independent (predictor) variable and the other ( y) is the dependent
(predicted) variable. Regression analysis assumes that only y is affected by measurement error, while x
is considered to be controlled or measured without error. Regression of x on y is not strictly valid when
there are errors in both variables (although it is often done). The results are useful when the errors in x
are small relative to the errors in y. As a rule-of-thumb, “small” means s
x
< 1/3s
y
. When the errors in x
are large relative to those in y, statements about probabilities of confidence intervals on regression
coefficients will be wrong. There are special regression methods to deal with the errors-in-variables
problem (Mandel, 1964; Fuller, 1987; Helsel and Hirsch, 1992).
References
Chatfield, C. (1983). Statistics for Technology, 3rd ed., London, Chapman & Hall.
Folks, J. L. (1981). Ideas of Statistics, New York, John Wiley.
Fuller, W. A. (1987). Measurement Error Models, New York, Wiley.
Helsel, D. R. and R. M. Hirsch (1992). Studies in Environmental Science 49: Statistical Models in Water
Resources, Amsterdam, Elsevier.
Mandel, J. (1964). The Statistical Analysis of Experimental Data, New York, Interscience Publishers.
Miller, J. C. and J. N. Miller (1984). Statistics for Analytical Chemistry, Chichester, England, Ellis Horwood
Ltd.
Siegel, S. and N. J. Castallan (1988). Nonparametric Statistics for the Behavioral Sciences, 2nd ed., New York,
McGraw-Hill.
TABLE 31.2
The Spearman Rank Correlation Coefficient Critical Values for 95% Confidence
n One-Tailed Test Two-Tailed Test n One-Tailed Test Two-Tailed Test
5 0.900 1.000 13 0.483 0.560
6 0.829 0.886 14 0.464 0.538
7 0.714 0.786 15 0.446 0.521
8 0.643 0.738 16 0.429 0.503
9 0.600 0.700 17 0.414 0.488
10 0.564 0.649 18 0.401 0.472
11 0.536 0.618 19 0.391 0.460
12 0.504 0.587 20 0.380 0.447
L1592_Frame_C31 Page 285 Tuesday, December 18, 2001 2:50 PM
© 2002 By CRC Press LLC
Exercises
31.1 BOD/COD Correlation. The table gives n = 24 paired measurements of effluent BOD
5
and
COD. Interpret the data using graphs and correlation.
32.2 Heavy Metals. The data below are 21 observations on influent and effluent lead (Pb), nickel
(Ni), and zinc (Zn) at a wastewater treatment plant. Examine the data for correlations.
31.3 Influent Loadings. The data below are monthly average influent loadings (lb/day) for the
Madison, WI, wastewater treatment plant in the years 1999 and 2000. Evaluate the correlation
between BOD and total suspended solids (TSS).
COD (mg/L) 4.5 4.7 4.2 9.7 5.8 6.3 8.8 5.7 6.3 9.7 15.4 12.0
BOD (mg/L) 5.0 4.1 6.7 5.0 5.0 3.8 6.1 4.1 4.2 4.3 4.0 3.7
COD (mg/L) 8.0 11.1 7.6 8.1 7.3 8.5 8.6 7.8 7.2 7.9 6.4 5.7
BOD (mg/L) 5.7 5.4 4.4 5.9 4.9 4.9 5.5 3.5 4.3 5.4 4.2 3.9
Inf. Pb Eff. Pb Inf. Ni Eff. Ni Inf. Zn Eff. Zn
18 3 33 25 194 96
3 1 47 41 291 81
4 1 26 8 234 63
24 21 33 27 225 65
35 34 23 10 160 31
31 2 28 16 223 41
32 4 36 19 206 40
14 6 41 43 135 47
40 6 47 18 329 72
27 9 42 16 221 72
8 6 13 14 235 68
14 7 21 3 241 54
7 20 13 13 207 41
19 9 24 15 464 67
17 10 24 27 393 49
19 4 24 25 238 53
24 7 49 13 181 54
28 5 42 17 389 54
25 4 48 25 267 91
23 8 69 21 215 83
30 6 32 63 239 61
1999 BOD TSS 2000 BOD TSS
Jan 68341 70506 Jan 74237 77018
Feb 74079 72140 Feb 79884 83716
Mar 70185 67380 Mar 75395 77861
Apr 76514 78533 Apr 74362 76132
May 71019 68696 May 74906 81796
Jun 70342 73006 Jun 71035 84288
Jul 69160 73271 Jul 76591 82738
Aug 72799 73684 Aug 78417 85008
Sep 69912 71629 Sep 76859 74226
Oct 71734 66930 Oct 78826 83275
Nov 73614 70222 Nov 73718 73783
Dec 75573 76709 Dec 73825 78242
L1592_Frame_C31 Page 286 Tuesday, December 18, 2001 2:50 PM
© 2002 By CRC Press LLC
31.4 Rounding. Express the data in Exercise 31.3 as thousands, rounded to one decimal place, and
recalculate the correlation; that is, the Jan. 1999 BOD becomes 68.3.
31.5 Coliforms. Total coliform (TC), fecal coliform (FC), and chlorine residual (Cl
2
Res.) were
measured in a wastewater effluent. Plot the data and evaluate the relationships among the
three variables.
31.6 AA Lab. A university laboratory contains seven atomic absorption spectrophotometers (A–G).
Research students rate the instruments in this order of preference: B, G, A, D, C, F, E. The
research supervisors rate the instruments G, D, B, E, A, C, F. Are the opinions of the students
and supervisors correlated?
31.7 Pump Maintenance. Two expert treatment plant operators (judges 1 and 2) were asked to rank
eight pumps in terms of ease of maintenance. Their rankings are given below. Find the
coefficient of rank correlation to assess how well the judges agree in their evaluations.
Cl
2
Res.
(mg/L) ln(TC) ln(FC)
Cl
2
Res.
(mg/L) ln(TC) ln(FC)
Cl
2
Res.
(mg/L) ln(TC) ln(FC)
2.40 4.93 1.61 1.80 5.48 1.61 1.90 4.38 1.61
1.90 2.71 1.61 2.90 1.61 1.61 2.60 1.61 1.61
1.00 7.94 1.61 2.80 1.61 1.61 3.30 1.61 1.61
0.07 16.71 12.61 2.90 1.61 1.61 2.00 3.00 1.61
0.03 16.52 14.08 3.90 1.61 1.61 2.70 3.00 1.61
0.14 10.93 5.83 2.30 2.71 1.61 2.70 1.61 1.61
3.00 4.61 1.61 0.40 8.70 1.61 2.80 1.61 1.61
5.00 3.69 1.61 3.70 1.61 1.61 1.70 2.30 1.61
5.00 3.69 1.61 0.90 2.30 1.61 0.90 5.30 2.30
2.30 6.65 1.61 0.90 5.27 1.61 0.50 8.29 1.61
3.10 4.61 4.32 3.00 2.71 1.61 3.10 1.61 1.61
1.20 6.15 1.61 1.00 4.17 1.61 0.03 16.52 13.82
1.80 2.30 1.61 1.80 3.40 1.61 2.90 5.30 1.61
0.03 16.91 14.04 3.30 1.61 1.61 2.20 1.61 1.61
2.50 5.30 1.61 3.90 5.25 1.61 0.60 7.17 2.30
2.80 4.09 1.61 2.30 1.61 1.61 1.40 5.70 2.30
3.20 4.01 1.61 3.00 4.09 1.61 2.80 4.50 1.61
1.60 3.00 1.61 1.70 3.00 1.61 1.50 5.83 2.30
2.30 2.30 1.61 2.80 3.40 1.61 1.30 5.99 1.61
2.50 2.30 1.61 3.10 1.61 3.00 2.40 7.48 1.61
Judge 1 52814637
Judge 2 45732816
L1592_Frame_C31 Page 287 Tuesday, December 18, 2001 2:50 PM
© 2002 By CRC Press LLC
32
Serial Correlation
KEY WORDS
ACF, autocorrelation, autocorrelation coefficient, BOD, confidence interval, correlation,
correlation coefficient, covariance, independence, lag, sample size, sampling frequency, serial correlation,
serial dependence, variance.
When data are collected sequentially, there is a tendency for observations taken close together (in time
or space) to be more alike than those taken farther apart. Stream temperatures, for example, may show
great variation over a year, while temperatures one hour apart are nearly the same. Some automated
monitoring equipment make measurements so frequently that adjacent values are practically identical.
This tendency for neighboring observations to be related is
serial correlation
or
autocorrelation
. One
measure of the serial dependence is the
autocorrelation coefficient
, which is similar to the Pearson corre-
lation coefficient discussed in Chapter 31. Chapter 51 will deal with autocorrelation in the context of
time series modeling.
Case Study: Serial Dependence of BOD Data
A total of 120 biochemical oxygen demand (BOD) measurements were made at two-hour intervals to
study treatment plant dynamics. The data are listed in Table 32.1 and plotted in Figure 32.1. As one
would expect, measurements taken 24 h apart (12 sampling intervals) are similar. The task is to examine
this daily cycle and the assess the strength of the correlation between BOD values separated by one, up
to at least twelve, sampling intervals.
Correlation and Autocorrelation Coefficients
Correlation between two variables
x
and
y
is estimated by the sample correlation coefficient:
where and are the sample means. The
correlation coefficient
(
r
) is a dimensionless number that can
range from
−
1 to
+
1.
Serial correlation
, or
autocorrelation
, is the correlation of a variable with itself. If sufficient data are
available, serial dependence can be evaluated by plotting each observation
y
t
against the immediately
preceding one,
y
t
−
1
. (Plotting
y
t
vs.
y
t
+
1
is equivalent to plotting
y
t
vs.
y
t
−
1
.) Similar plots can be made
for observations two units apart (
y
t
vs.
y
t
−
2
), three units apart, etc.
If measurements were made daily, a plot of
y
t
vs.
y
t
−
7
might indicate serial dependence in the form of
a weekly cycle. If
y
represented monthly averages,
y
t
vs.
y
t
−
12
might reveal an annual cycle. The distance
between the observations that are examined for correlation is called the
lag
. The convention is to measure
lag as the number of intervals between observations and not as real time elapsed. Of course, knowing
the time between observations allows us to convert between real time and lag time.
r
∑ x
i
x–()y
i
y–()
∑ x
i
x–()
2
∑ y
i
y–()
2
=
x y
L1592_frame_C32 Page 289 Tuesday, December 18, 2001 2:50 PM
© 2002 By CRC Press LLC
The correlation coefficients of the lagged observations are called autocorrelation coefficients, denoted
as
ρ
k
. These are estimated by the
lag k sample autocorrelation coefficient
as:
Usually the autocorrelation coefficients are calculated for
k
=
1 up to perhaps
n
/
4, where
n
is the length
of the time series. A series of
n
≥
50 is needed to get reliable estimates. This set of coefficients
(
r
k
) is
called the
autocorrelation function
(
ACF
). It is common to graph
r
k
as a function of lag
k
. Notice that
the correlation of
y
t
with
y
t
is
r
0
=
1. In general,
−
1
<
r
k
<
+
1.
If the data vary about a fixed level, the
r
k
die away to small values after a few lags. The approximate
95% confidence interval for
r
k
is
±
1.96
/
. The confidence interval will be
±
0.28 for
n
=
50, or less for
longer series. Any
r
k
smaller than this is attributed to random variation and is disregarded.
If the
r
k
do not die away, the time series has a persistent trend (upward or downward), or the series
slowly drifts up and down. These kinds of time series are fairly common. The shape of the autocorrelation
function is used to identify the form of the time series model that describes the data. This will be
considered in Chapter 51.
Case Study Solution
Figure 32.2 shows plots of BOD at time
t
, denoted as BOD
t
, against the BOD at 1, 3, 6, and 12 sampling
intervals earlier. The sampling interval is 2 h so the time intervals between these observations are 2, 6,
12, and 24 h.
TABLE 32.1
120 BOD Observations Made at 2-h Intervals
Sampling Interval
Day123456789101112
1 200 122 153 176 129 168 165 119 113 110 113 98
2 180 122 156 185 163 177 194 149 119 135 113 129
3 160 105 127 162 132 184 169 160 115 105 102 114
4 112 148 217 193 208 196 114 138 118 126 112 117
5 180 160 151 88 118 129 124 115 132 190 198 112
6 132 99 117 164 141 186 137 134 120 144 114 101
7 140 120 182 198 171 170 155 165 131 126 104 86
8 114 83 107 162 140 159 143 129 117 114 123 102
9 144 143 140 179 174 164 188 107 140 132 107 119
10 156 116 179 189 204 171 141 123 117 98 98 108
Note:
Time runs left to right.
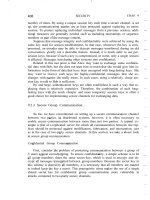
FIGURE 32.1
A record of influent BOD data sampled at 2-h intervals.
BOD (mg/L)
Hours
50
100
150
200
250
240216192168144120967248240
r
k
∑ y
t
y–()y
t−k
y–()
∑ y
t
y–()
2
=
n
L1592_frame_C32 Page 290 Tuesday, December 18, 2001 2:50 PM
© 2002 By CRC Press LLC
The sample autocorrelation coefficients are given on each plot. There is a strong correlation at lag
1(2 h). This is clear in the plot of BOD
t
vs BOD
t
−
1
, and also by the large autocorrelation coefficient
(
r
1
=
0.49). The graph and the autocorrelation coefficient (
r
3
=
−
0.03) show no relation between observations
at lag 3(6 h apart). At lag 6(12 h), the autocorrelation is strong and negative (
r
6
= −
0.42). The negative
correlation indicates that observations taken 12 h apart tend to be opposite in magnitude, one being
high and one being low. Samples taken 24 h apart are positively correlated (
r
12
=
0.25). The positive
correlation shows that when one observation is high, the observation 24 h ahead (or 24 h behind) is also
high. Conversely, if the observation is low, the observation 24 h distant is also low.
Figure 32.3 shows the
autocorrelation function
for observations that are from lag 1 to lag 24 (2 to 48
h apart). The approximate 95% confidence interval is
±
1.96
=
± 0.18. The correlations for the first
12 lags show a definite diurnal pattern. The correlations for lags 13 to 24 repeat the pattern of the first
12, but less strongly because the observations are farther apart. Lag 13 is the correlation of observations
26 h apart. It should be similar to the lag 1 correlation of samples 2 h apart, but less strong because of
the greater time interval between the samples. The lag 24 and lag 12 correlations are similar, but the
lag 24 correlation is weaker. This system behavior makes physical sense because many factors (e.g.,
weather, daily work patterns) change from day to day, thus gradually reducing the strength of the system
memory.
FIGURE 32.2 Plots of BOD at time t, denoted as BOD
t
, against the BOD at lags of 1, 3, 6, and 12 sampling intervals,
denoted as BOD
t–1
, BOD
t−3
, BOD
t−6
, and BOD
t−12
. The observations are 2 h apart, so the time intervals between these
observations are 2, 6, 12, and 24 h apart, respectively.
FIGURE 32.3 The autocorrelation coefficients for lags k = 1 − 24 h. Each observation is 2 h apart so the lag 12 autocor-
relation indicates a 24-h cycle.
BOD
t - 6
BOD
t - 1
BOD
t - 12
BOD
t - 3
BOD
t
BOD
t
50
100
150
200
250
50
100
150
200
250
r
12
= -0.42
r
1
= -0.49
r
24
= -0.25
r
6
= -0.03
25020015010050 25020015010050
50
100
150
200
250
50
100
150
200
250
1
–1
0
Sampling interval is 2 hours
Lag
Autocorrelation
coeffiecient
1 6 12 18 24
120
L1592_frame_C32 Page 291 Tuesday, December 18, 2001 2:50 PM
© 2002 By CRC Press LLC
Implications for Sampling Frequency
The sample mean of autocorrelated data is unaffected by autocorrelation. It is still an unbiased
estimator of the true mean. This is not true of the variance of y or the sample mean as calculated by:
With autocorrelation, is the purely random variation plus a component due to drift about the mean
(or perhaps a cyclic pattern).
The estimate of the variance of that accounts for autocorrelation is:
If the observations are independent, then all r
k
are zero and this becomes the usual expression
for the variance of the sample mean. If the r
k
are positive (>0), which is common for environmental
data, the variance is inflated. This means that n correlated observations will not give as much information
as n independent observations (Gilbert, 1987).
Assuming the data vary about a fixed mean level, the number of observations required to estimate
with maximum error E and (1 −
α
)100% confidence is approximately:
The lag at which r
k
becomes negligible identifies the time between samples at which observations become
independent. If we sample at that interval, or at a greater interval, the sample size needed to estimate
the mean is reduced to n = (z
α
/2
σ
/E )
2
.
If there is a regular cycle, sample at half the period of the cycle. For a 24-h cycle, sample every 12 h.
If you sample more often, select multiples of the period (e.g., 6 h, 3 h).
Comments
Undetected serial correlation, which is a distinct possibility in small samples (n < 50), can be very
upsetting to statistical conclusions, especially to conclusions based on t-tests and F-tests. This is why
randomization is so important in designed experiments. The t-test is based on an assumption that the
observations are normally distributed, random, and independent. Lack of independence (serial correla-
tion) will bias the estimate of the variance and invalidate the t-test. A sample of n = 20 autocorrelated
observations may contain no more information than ten independent observations. Thus, using n = 20
makes the test appear to be more sensitive than it is. With moderate autocorrelation and moderate sample
sizes, what you think is a 95% confidence interval may be in fact a 75% confidence interval. Box et al.
(1978) present a convincing example. Montgomery and Loftis (1987) show how much autocorrelation
can distort the error rate.
Linear regression also assumes that the residuals are independent. If serial correlation exists, but we
are unaware and proceed as though it is absent, all statements about probabilities (hypothesis tests,
confidence intervals, etc.) may be wrong. This is illustrated in Chapter 41. Chapter 54 on intervention
analysis discusses this problem in the context of assessing the shift in the level of a time series related
to an intentional intervention in the system.
(y)
y,
s
y
2
∑ y
t
y–()
2
n 1–
and s
y
2
s
y
2
/n==
s
y
2
y
s
y
2
s
y
2
n
2s
y
2
n
2
n 1–()r
k
k=1
n−1
∑
+=
s
y
2
s
y
2
/n,=
y
n
z
α
/2
σ
E
2
12 r
k
k=1
n−1
∑
+
=
L1592_frame_C32 Page 292 Tuesday, December 18, 2001 2:50 PM
© 2002 By CRC Press LLC
References
Box, G. E. P., W. G. Hunter, and J. S. Hunter (1978). Statistics for Experimenters: An Introduction to Design,
Data Analysis, and Model Building, New York, Wiley Interscience.
Box, G. E. P., G. M. Jenkins, and G. C. Reinsel (1994). Time Series Analysis, Forecasting and Control, 3rd
ed., Englewood Cliffs, NJ, Prentice-Hall.
Cryer, J. D. (1986). Time Series Analysis, Boston, MA, Duxbury Press.
Gilbert, R. O. (1987). Statistical Methods for Environmental Pollution Monitoring, New York, Van Nostrand
Reinhold.
Montgomery, R. H. and J. C. Loftis, Jr. (1987). “Applicability of the t-Test for Detecting Trends in Water
Quality Variables,” Water Res. Bull., 23, 653–662.
Exercises
32.1 Arsenic in Sludge. Below are annual average arsenic concentrations in municipal sewage
sludge, measured in units of milligrams (mg) As per kilogram (kg) dry solids. Time runs
from left to right, starting with 1979 (9.4 mg/kg) and ending with 2000 (4.8 mg/kg). Calculate
the lag 1 autocorrelation coefficient and prepare a scatterplot to explain what this coefficient
means.
9.4 9.7 4.9 8.0 7.8 8.0 6.4 5.9 3.7 9.9 4.2
7.0 4.8 3.7 4.3 4.8 4.6 4.5 8.2 6.5 5.8 4.8
32.2 Diurnal Variation. The 70 BOD values given below were measured at 2-h intervals (time runs
from left to right). (a) Calculate and plot the autocorrelation function. (b) Calculate the
approximate 95% confidence interval for the autocorrelation coefficients. (c) If you were to
redo this study, what sampling interval would you use?
32.3 Effluent TSS. Determine the autocorrelation structure of the effluent total suspended solids
(TSS) data in Exercise 3.4.
189 118 157 183 138 177 171 119 118 128 132 135 166 113 171 194 166
179 177 163 117 126 118 122 169 116 123 163 144 184 174 169 118 122
112 121 121 162 189 184 194 174 128 166 139 136 139 129 188 181 181
143 132 148 147 136 140 166 197 130 141 112 126 160 154 192 153 150
133 150
L1592_frame_C32 Page 293 Tuesday, December 18, 2001 2:50 PM
© 2002 By CRC Press LLC
33
The Method of Least Squares
KEY WORDS
confidence interval, critical sum of squares, dependent variable, empirical model,
experimental error, independent variable, joint confidence region, least squares, linear model, linear
least squares, mechanistic model, nonlinear model, nonlinear least squares, normal equation, parameter
estimation, precision, regression, regressor, residual, residual sum of squares.
One of the most common problems in statistics is to fit an equation to some data. The problem might
be as simple as fitting a straight-line calibration curve where the independent variable is the known
concentration of a standard solution and the dependent variable is the observed response of an instrument.
Or it might be to fit an unsteady-state nonlinear model, for example, to describe the addition of oxygen
to wastewater with a particular kind of aeration device where the independent variables are water depth,
air flow rate, mixing intensity, and temperature.
The equation may be an
empirical model
(simply descriptive) or
mechanistic model
(based on fun-
damental science). A
response variable
or
dependent variable
(
y
) has been measured at several settings
of one or more
independent variables
(
x
), also called
input variables, regressors
, or
predictor variables
.
Regression
is the process of fitting an equation to the data. Sometimes, regression is called
curve fitting
or
parameter estimation
.
The purpose of this chapter is to explain that certain basic ideas apply to fitting both linear and
nonlinear models. Nonlinear regression is neither conceptually different nor more difficult than linear
regression. Later chapters will provide specific examples of linear and nonlinear regression. Many books
have been written on regression analysis and introductory statistics textbooks explain the method.
Because this information is widely known and readily available, some equations are given in this chapter
without much explanation or derivation. The reader who wants more details should refer to books listed
at the end of the chapter.
Linear and Nonlinear Models
The fitted model may be a simple function with one independent variable, or it may have many
independent variables with higher-order and nonlinear terms, as in the examples given below.
Linear models
Nonlinear models
To maintain the distinction between linear and nonlinear we use a different symbol to denote the
parameters. In the general linear model,
η
=
f
(
x
,
β
),
x
is a vector of independent variables and
β
are
parameters that will be estimated by regression analysis. The estimated values of the parameters
β
1
,
β
2
,…
will be denoted by
b
1
,
b
2
,…. Likewise, a general nonlinear model is
η
=
f
(
x
,
θ
) where
θ
is a vector of
parameters, the estimates of which are denoted by
k
1
,
k
2
,….
The terms
linear
and
nonlinear
refer to the parameters in the model and not to the independent
variables. Once the experiment or survey has been completed, the numerical values of the dependent
ηβ
0
β
1
x
β
2
x
2
++=
ηβ
0
β
1
x
1
β
2
x
2
β
2
x
1
x
2
+++=
η
θ
1
1 exp
θ
2
x–()–
=
η
exp
θ
x
1
–()1 x
2
–()
θ
2
=
L1592_frame_C33 Page 295 Tuesday, December 18, 2001 2:51 PM
© 2002 By CRC Press LLC
and independent variables are known. It is the parameters, the
β
’s and
θ
’s, that are unknown and must
be computed. The model
y
=
β
x
2
is nonlinear in
x
; but once the known value of
x
2
is provided, we have
an equation that is linear in the parameter
β
. This is a linear model and it can be fitted by linear regression.
In contrast, the model
y
=
x
θ
is nonlinear in
θ
, and
θ
must be estimated by nonlinear regression (or we
must transform the model to make it linear).
It is usually assumed that a well-conducted experiment produces values of
x
i
that are essentially
without error, while the observations of
y
i
are affected by random error. Under this assumption, the
y
i
observed for the
i
th experimental run is the sum of the true underlying value of the response (
η
i
) and a
residual error (
e
i
):
Suppose that we know, or tentatively propose, the linear model
η
=
β
0
+
β
1
x
. The observed responses
to which the model will be fitted are:
which has residuals:
Similarly, if one proposed the nonlinear model
η
=
θ
1
exp(
−
θ
2
x
), the observed response is:
y
i
=
θ
1
exp(
−
θ
2
x
i
)
+
e
i
with residuals:
e
i
=
y
i
−
θ
1
exp(
−
θ
2
x
i
)
The relation of the residuals to the data and the fitted model is shown in Figure 33.1. The lines represent
the model functions evaluated at particular numerical values of the parameters. The residual
is the vertical distance from the observation to the value on the line that is calculated from the model.
The residuals can be positive or negative.
The position of the line obviously will depend upon the particular values that are used for
β
0
and
β
1
in the linear model and for
θ
1
and
θ
2
in the nonlinear model. The regression problem is to select the
values for these parameters that best fit the available observations. “Best” is measured in terms of making
the residuals small according to a least squares criterion that will be explained in a moment.
If the model is correct, the residual
e
i
=
y
i
−
η
i
will be nothing more than random measurement error. If
the model is incorrect, e
i
will reflect lack-of-fit due to all terms that are needed but missing from the model
specification. This means that, after we have fitted a model, the residuals contain diagnostic information.
FIGURE 33.1 Definition of residual error for a linear model and a nonlinear model.
y
i
η
i
e
i
+= i 1, 2,…, n=
y
i
β
0
β
1
x
i
e
i
++=
e
i
y
i
β
0
–
β
1
x
i
–=
e
i
y
i
η
i
–=()
Linear model
y
= β
0
+ β
1
x
Nonlinear model
y
= θ
0
[ 1-
exp(
θ
1
x
)]
y
i
y
i
e
i
e
i
x
i
x
i
L1592_frame_C33 Page 296 Tuesday, December 18, 2001 2:51 PM
© 2002 By CRC Press LLC
Residuals that are normally and independently distributed with constant variance over the range of values
studied are persuasive evidence that the proposed model adequately fits the data. If the residuals show
some pattern, the pattern will suggest how the model should be modified to improve the fit. One way to
check the adequacy of the model is to check the properties of the residuals of the fitted model by plotting
them against the predicted values and against the independent variables.
The Method of Least Squares
The best estimates of the model parameters are those that minimize the sum of the squared residuals:
The minimum sum of squares is called the residual sum of squares . This approach to estimating
the parameters is known as the method of least squares. The method applies equally to linear and
nonlinear models. The difference between linear and nonlinear regression lies in how the least squares
parameter estimates are calculated. The essential difference is shown by example.
Each term in the summation is the difference between the observed y
i
and the
η
computed from the
model at the corresponding values of the independent variables x
i
. If the residuals are normally and
independently distributed with constant variance, the parameter estimates are unbiased and have mini-
mum variance.
For models that are linear in the parameters, there is a simple algebraic solution for the least squares
parameter estimates. Suppose that we wish to estimate
β
in the model . The sum of squares
function is:
The parameter value that minimizes S is the least squares estimate of the true value of
β
. This estimate
is denoted by b. We can solve the sum of squares function for this estimate by setting the derivative
with respect to
β
equal to zero and solving for b:
This equation is called the normal equation. Note that this equation is linear with respect to b. The
algebraic solution is:
Because x
i
and y
i
are known once the experiment is complete, this equation provides a generalized method
for direct and exact calculation of the least squares parameter estimate. (Warning: This is not the equation
for estimating the slope in a two-parameter model.)
If the linear model has two (or more) parameters to be estimated, there will be two (or more) normal
equations. Each normal equation will be linear with respect to the parameters to be estimated and
therefore an algebraic solution is possible. As the number of parameters increases, an algebraic solution
is still possible, but it is tedious and the linear regression calculations are done using linear algebra (i.e.,
matrix operations). The matrix formulation was given in Chapter 30.
Unlike linear models, no unique algebraic solution of the normal equations exists for nonlinear models.
For example, if the method of least squares requires that we find the value of
θ
that
minimizes S:
Se
i
()
2
y
i
η
i
–()
2
i=1
n
∑
=
i=1
n
∑
=
S
R
()
e
i
()
ηβ
x=
S
β
() y
i
β
x
i
–()
2
y
i
2
2
β
x
i
y
i
–
β
2
x
i
2
+()
∑
=
∑
=
b()
dS
β
()
d
β
02 bx
i
2
x
i
y
i
–()
∑
==
b
∑x
i
y
i
∑x
i
2
=
η
exp
θ
x–(),=
S
θ
() y
i
exp
θ
x
i
–()–()
2
y
i
2
2y
i
exp −θx
i
()– exp
θ
x
i
–()()
2
+[]
∑
=
∑
=
L1592_frame_C33 Page 297 Tuesday, December 18, 2001 2:51 PM
© 2002 By CRC Press LLC
The least squares estimate of
θ
still satisfies
∂
S/
∂θ
= 0, but the resulting derivative does not have an
algebraic solution. The value of
θ
that minimizes S is found by iterative numerical search.
Examples
The similarities and differences of linear and nonlinear regression will be shown with side-by-side
examples using the data in Table 33.1. Assume there are theoretical reasons why a linear model
(
η
i
=
β
x
i
) fitted to the data in Figure 33.2 should go through the origin, and an exponential decay
model (
η
i
= exp( −
θ
x
i
)) should have y = 1 at t = 0. The models and their sum of squares functions are:
For the linear model, the sum of squares function expanded in terms of the observed data and
the parameter
β
is:
TABLE 33.1
Example Data and the Sum of Squares Calculations for a One-Parameter Linear
Model and a One-Parameter Nonlinear Model
Linear Model:
ηη
ηη
==
==
ββ
ββ
x Nonlinear Model:
ηη
ηη
i
==
==
exp(−
θθ
θθ
x
i
)
x
i
y
obs,i
y
calc,i
e
i
(e
i
)
2
x
i
y
obs,i
y
calc,i
e
i
(e
i
)
2
Trial value: b = 0.115 Trial value: k = 0.32
2 0.150 0.230 −0.080 0.0064 2 0.620 0.527 0.093 0.0086
4 0.461 0.460 0.001 0.0000 4 0.510 0.278 0.232 0.0538
6 0.559 0.690 −0.131 0.0172 6 0.260 0.147 0.113 0.0129
10 1.045 1.150 −0.105 0.0110 10 0.180 0.041 0.139 0.0194
14 1.364 1.610 −0.246 0.0605 14 0.025 0.011 0.014 0.0002
19 1.919 2.185 −0.266 0.0708 19 0.041 0.002 0.039 0.0015
Sum of squares = 0.1659 Sum of squares = 0.0963
Trial value: b = 0.1 (optimal) Trial value: k = 0.2 (optimal)
2 0.150 0.200 −0.050 0.0025 2 0.620 0.670 −0.050 0.0025
4 0.461 0.400 0.061 0.0037 4 0.510 0.449 0.061 0.0037
6 0.559 0.600 −0.041 0.0017 6 0.260 0.301 −0.041 0.0017
10 1.045 1.000 0.045 0.0020 10 0.180 0.135 0.045 0.0020
14 1.364 1.400 −0.036 0.0013 14 0.025 0.061 −0.036 0.0013
19 1.919 1.900 0.019 0.0004 19 0.041 0.022 0.019 0.0003
Minimum sum of squares = 0.0116 Minimum sum of squares = 0.0115
FIGURE 33.2 Plots of data to be fitted to linear (left) and nonlinear (right) models and the curves generated from the
initial parameter estimates of b = 0.115 and k = 0.32 and the minimum least squares values (b = 0.1 and k = 0.2).
20100
0
1
2
x
y
20151050
0.0
0.5
1.0
k
= 0.32
x
slope = 0.1
slope =
0.115
k
= 0.2
y
i
β
x
i
e
i
+= min S
β
() y
i
β
x
i
–()
2
=
y
i
θ
– x
i
()exp e
i
+= min S
θ
() y
i
exp
θ
x
i
–()–()
2
∑
=
S
β
() 0.15 2
β
–()
2
0.461 4
β
–()
2
0.559 6
β
–()+
2
+=
1.045 10
β
–()
2
1.361 14
β
–()
2
1.919 19
β
–()
2
+++
L1592_frame_C33 Page 298 Tuesday, December 18, 2001 2:51 PM
© 2002 By CRC Press LLC
For the nonlinear model it is:
An algebraic solution exists for the linear model, but to show the essential similarity between linear
and nonlinear parameter estimation, the least squares parameter estimates of both models will be
determined by a straightforward numerical search of the sum of squares functions. We simply plot S
over a range of values of
β
, and do the same for S over a range of
θ
.
Two iterations of this calculation are shown in Table 33.1. The top part of the table shows the trial
calculations for initial parameter estimates of b = 0.115 and k = 0.32. One clue that these are poor
estimates is that the residuals are not random; too many of the linear model regression residuals are
negative and all the nonlinear model residuals are positive. The bottom part of the table is for b = 0.1
and k = 0.2, the parameter values that give the minimum sum of squares.
Figure 33.3 shows the smooth sum of squares curves obtained by following this approach. The minimum
sum of squares — the minimum point on the curve — is called the residual sum of squares and the
corresponding parameter values are called the least squares estimates. The least squares estimate of
β
is b = 0.1. The least squares estimate of
θ
is k = 0.2. The fitted models are = 0.1x and = exp( −0.2x).
is the predicted value of the model using the least squares parameter estimate.
The sum of squares function of a linear model is always symmetric. For a univariate model it will be
a parabola. The curve in Figure 33.3a is a parabola. The sum of squares function for nonlinear models
is not symmetric, as can be seen in Figure 33.3b.
When a model has two parameters, the sum of squares function can be drawn as a surface in three
dimensions, or as a contour map in two dimensions. For a two-parameter linear model, the surface will
be a parabaloid and the contour map of S will be concentric ellipses. For nonlinear models, the sum of
squares surface is not defined by any regular geometric function and it may have very interesting contours.
The Precision of Estimates of a Linear Model
Calculating the “best” values of the parameters is only part of the job. The precision of the parameter
estimates needs to be understood. Figure 33.3 is the basis for showing the confidence interval of the
example one-parameter models.
For the one-parameter linear model through the origin, the variance of b is:
FIGURE 33.3 The values of the sum of squares plotted as a function of the trial parameter values. The least squares
estimates are b = 0.1 and k = 0.2. The sum of squares function is symmetric (parabolic) for the linear model (left) and
asymmetric for the nonlinear model (right).
β
b
=0.1
0.110.100.09
0.0
0.1
0.2
0.3
θ
k
= 0.2
0.30.20.1
Sum of Squares
Linear Model Nonlinear Model
S
θ
() 0.62 e
2
θ
–
–()
2
0.51 e
4
θ
–
–()
2
0.26 e
6
θ
–()
2
++=
0.18 e
10
θ
–
–()
2
0.025 e
14
θ
–
–()
2
0.041 e
19
θ
–
–()
2
++ +
β
()
θ
()
y
ˆ
y
ˆ
y
ˆ
Var b()
σ
2
∑x
i
2
=
L1592_frame_C33 Page 299 Tuesday, December 18, 2001 2:51 PM
© 2002 By CRC Press LLC
The summation is over all squares of the settings of the independent variable x.
σ
2
is the experimental
error variance. (Warning: This equation does not give the variance for the slope of a two-parameter
linear model.)
Ideally,
σ
2
would be estimated from independent replicate experiments at some settings of the x
variable. There are no replicate measurements in our example, so another approach is used. The residual
sum of squares can be used to estimate
σ
2
if one is willing to assume that the model is correct. In this
case, the residuals are random errors and the average of these residuals squared is an estimate of the
error variance
σ
2
. Thus,
σ
2
may be estimated by dividing the residual sum of squares by its degrees
of freedom where n is the number of observations and p is the number of estimated
parameters.
In this example, S
R
= 0.0116, p = 1 parameter, n = 6,
ν
= 6 – 1 = 5 degrees of freedom, and the
estimate of the experimental error variance is:
The estimated variance of b is:
and the standard error of b is:
The (1–
α
)100% confidence limits for the true value
β
are:
For
α
= 0.05,
ν
= 5, we find , and the 95% confidence limits are 0.1 ± 2.571(0.0018) =
0.1 ± 0.0046.
Figure 33.4a expands the scale of Figure 33.3a to show more clearly the confidence interval computed
from the t statistic. The sum of squares function and the confidence interval computed using the t statistic
are both symmetric about the minimum of the curve. The upper and lower bounds of the confidence
interval define two intersections with the sum of squares curve. The sum of squares at these two points
is identical because of the symmetry that always exists for a linear model. This level of the sum of squares
function is the critical sum of squares, S
c
. All values of
β
that give S < S
c
fall within the 95% confidence
interval.
Here we used the easily calculated confidence interval to define the critical sum of squares. Usually
the procedure is reversed, with the critical sum of squares being used to determine the boundary of
the confidence region for two or more parameters. Chapters 34 and 35 explain how this is done. The
F statistic is used instead of the t statistic.
FIGURE 33.4 Sum of squares functions from Figure 33.3 replotted on a larger scale to show the confidence intervals of
β
for the linear model (left) and
θ
for the nonlinear model (right).
S
R
()
ν
np–=(),
s
2
S
R
np–
0.0116
5
0.00232== =
Var b()
s
2
∑x
i
2
0.00232
713
0.0000033== =
SE b() Var b() 0.0000032 0.0018== =
bt
ν
,
α
ր 2
SE b()±
t
5,0.025
2.571=
0.2250.2000.175
0.00
0.01
0.02
0.03
0.1050.1000.095
S
= 0.0175
c
0.095
0.105
0.178
0.224
β
θ
Linear Model Nonlinear Model
Sum of Squares
0.00
0.05
0.10
S
= 0.027
c
L1592_frame_C33 Page 300 Tuesday, December 18, 2001 2:51 PM
© 2002 By CRC Press LLC
The Precision of Estimates of a Nonlinear Model
The sum of squares function for the nonlinear model (Figure 33.3) is not symmetrical about the least
squares parameter estimate. As a result, the confidence interval for the parameter
θ
is not symmetric.
This is shown in Figure 33.4, where the confidence interval is 0.20 – 0.022 to 0.20 + 0.024, or [0.178,
0.224].
The asymmetry near the minimum is very modest in this example, and a symmetric linear approxi-
mation of the confidence interval would not be misleading. This usually is not the case when two or
more parameters are estimated. Nevertheless, many computer programs do report confidence intervals
for nonlinear models that are based on symmetric linear approximations. These intervals are useful as
long as one understands what they are.
This asymmetry is one difference between the linear and nonlinear parameter estimation problems.
The essential similarity, however, is that we can still define a critical sum of squares and it will still be
true that all parameter values giving S ≤ S
c
fall within the confidence interval. Chapter 35 explains how
the critical sum of squares is determined from the minimum sum of squares and an estimate of the
experimental error variance.
Comments
The method of least squares is used in the analysis of data from planned experiments and in the analysis
of data from unplanned happenings. For the least squares parameter estimates to be unbiased, the residual
errors (e = y −
η
) must be random and independent with constant variance. It is the tacit assumption
that these requirements are satisfied for unplanned data that produce a great deal of trouble (Box, 1966).
Whether the data are planned or unplanned, the residual (e) includes the effect of latent variables (lurking
variables) which we know nothing about.
There are many conceptual similarities between linear least squares regression and nonlinear regres-
sion. In both, the parameters are estimated by minimizing the sum of squares function, which was
illustrated in this chapter using one-parameter models. The basic concepts extend to models with more
parameters.
For linear models, just as there is an exact solution for the parameter estimates, there is an exact solution
for the 100(1 –
α
)% confidence interval. In the case of linear models, the linear algebra used to compute
the parameter estimates is so efficient that the work effort is not noticeably different to estimate one or
ten parameters.
For nonlinear models, the sum of squares surface can have some interesting shapes, but the precision
of the estimated parameters is still evaluated by attempting to visualize the sum of squares surface,
preferably by making contour maps and tracing approximate joint confidence regions on this surface.
Evaluating the precision of parameter estimates in multiparameter models is discussed in Chapters 34
and 35. If there are two or more parameters, the sum of squares function defines a surface. A joint
confidence region for the parameters can be constructed by tracing along this surface at the critical sum
of squares level. If the model is linear, the joint confidence regions are still based on parabolic geometry.
For two parameters, a contour map of the joint confidence region will be described by ellipses. In higher
dimensions, it is described by ellipsoids.
References
Box, G. E. P. (1966). “The Use and Abuse of Regression,” Technometrics, 8, 625–629.
Chatterjee, S. and B. Price (1977). Regression Analysis by Example, New York, John Wiley.
Draper, N. R. and H. Smith, (1998). Applied Regression Analysis, 3rd ed., New York, John Wiley.
Meyers, R. H. (1986). Classical and Modern Regression with Applications, Boston, MA, Duxbury Press.
L1592_frame_C33 Page 301 Tuesday, December 18, 2001 2:51 PM
© 2002 By CRC Press LLC
Mosteller, F. and J. W. Tukey (1977). Data Analysis and Regression: A Second Course in Statistics, Reading,
MA, Addison-Wesley Publishing Co.
Neter, J., W. Wasserman, and M. H. Kutner (1983). Applied Regression Models, Homewood, IL, Richard D.
Irwin Co.
Rawlings, J. O. (1988). Applied Regression Analysis: A Research Tool, Pacific Grove, CA, Wadsworth and
Brooks/Cole.
Exercises
33.1 Model Structure. Are the following models linear or nonlinear in the parameters?
(a)
(b)
(c)
(d)
(e)
(f)
(g)
(h)
(i)
(j)
33.2 Fitting Models. Using the data below, determine the least squares estimates of
β
and
θ
by
plotting the sum of squares for these models: and .
33.3 Normal Equations. Derive the two normal equations to obtain the least squares estimates of
the parameters in y =
β
0
+
β
1
x. Solve the simultaneous equations to get expressions for b
0
and b
1
, which estimate the parameters
β
0
and
β
1
.
xy
1
y
2
2 2.8 0.44
4 6.2 0.71
6 10.4 0.81
8 17.7 0.93
ηβ
0
β
1
x
2
+=
ηβ
0
β
1
2
x
+=
ηβ
0
β
1
x
β
2
x
2
β
3
x
3
β
4
x 60–
++ + +=
η
β
0
x
β
1
x+
=
ηβ
0
1
β
1
x
1
+()1
β
2
x
2
+()=
ηβ
0
β
1
x
1
β
2
x
2
β
3
x
3
β
12
x
1
x
2
β
13
x
1
x
3
β
23
x
2
x
3
β
123
x
1
x
2
x
3
++++ + + +=
ηβ
0
1exp
β
1
x–()–[]=
ηβ
0
1
β
1
exp x–()–[]=
ln
η
()
β
0
β
1
x+=
1
η
β
0
β
1
x
+=
η
1
β
x
2
=
η
2
1exp
θ
x–()–=
L1592_frame_C33 Page 302 Tuesday, December 18, 2001 2:51 PM
© 2002 By CRC Press LLC
34
Precision of Parameter Estimates in Linear Models
KEY WORDS
confidence interval, critical sum of squares, joint confidence region, least squares, linear
regression, mean residual sum of squares, nonlinear regression, parameter correlation, parameter estima-
tion, precision, prediction interval, residual sum of squares, straight line.
Calculating the best values of the parameters is only half the job of fitting and evaluating a model. The
precision of these estimates must be known and understood. The precision of estimated parameters in
a linear or nonlinear model is indicated by the size of their
joint confidence region
. Joint indicates that
all the parameters in the model are considered simultaneously.
The Concept of a Joint Confidence Region
When we fit a model, such as
η
=
β
0
+
β
1
x
or
η
=
θ
1
[1
−
exp(
−
θ
2
x
)], the regression procedure delivers
a set of parameter values. If a different sample of data were collected using the same settings of
x
,
different
y
values would result and different parameter values would be estimated. If this were repeated
with many data sets, many pairs of parameter estimates would be produced. If these pairs of parameter
estimates were plotted as
x
and
y
on Cartesian coordinates, they would cluster about some central point
that would be very near the true parameter values. Most of the pairs would be near this central value,
but some could fall a considerable distance away. This happens because of random variation in the
y
measurements.
The data (if they are useful for model building) will restrict the plausible parameter values to lie within
a certain region. The intercept and slope of a straight line, for example, must be within certain limits or
the line will not pass through the data, let alone fit it reasonably well. Furthermore, if the slope is
decreased somewhat in an effort to better fit the data, inevitably the intercept will increase slightly to
preserve a good fit of the line. Thus, low values of slope paired with high values of intercept are plausible,
but high slopes paired with high intercepts are not. This relationship between the parameter values is
called
parameter correlation
. It may be strong or weak, depending primarily on the settings of the
x
variables at which experimental trials are run.
Figure 34.1 shows some joint confidence regions that might be observed for a two-parameter model.
Panels (a) and (b) show typical elliptical confidence regions of linear models; (c) and (d) are for nonlinear
models that may have confidence regions of irregular shape. A small joint confidence region indicates
precise parameter estimates. The orientation and shape of the confidence region are also important. It
may show that one parameter is estimated precisely while another is only known roughly, as in (b) where
β
2
is estimated more precisely than
β
1
. In general, the size of the confidence region decreases as the
number of observations increases, but it also depends on the actual choice of levels at which measure-
ments are made. This is especially important for nonlinear models. The elongated region in (d) could
result from placing the experimental runs in locations that are not informative.
The
critical sum of squares
value that bounds the (1
−
α
)100% joint confidence region is:
S
c
S
R
S
R
p
np–
F
p,n− p,
α
+ S
R
1
p
np–
F
p,n− p,
α
+
==
L1592_frame_C34 Page 303 Tuesday, December 18, 2001 2:52 PM
© 2002 By CRC Press LLC
where
p
is the number of parameters estimated,
n
is the number of observations, and
F
p
,
n
−
p
,
α
is the upper
α
percent value of the
F
distribution with
p
and
n
–
p
degrees of freedom, and
S
R
is the residual sum
of squares. Here
S
R
/
(
n
−
p
) is used to estimate
σ
2
. If there were replicate observations, an independent
estimate of
σ
2
could be calculated.
This defines an exact (1
−
α
)100% confidence region for a linear model; it is only approximate for
nonlinear models. This is discussed in Chapter 35.
Theory: A Linear Model
Standard statistics texts all give a thorough explanation of linear regression, including a discussion of
how the precision of the estimated parameters is determined. We review these ideas in the context of a
straight-line model
y
=
β
0
+
β
1
x
+
e
. Assuming the errors (
e
) are normally distributed with mean zero
and constant variance, the best parameter estimates are obtained by the method of least squares. The
parameters
β
0
and
β
1
are estimated by
b
0
and
b
1
:
The true response (
η
) estimated from a measured value of
x
0
is
=
b
0
−
b
1
x
0
.
The statistics
b
0
,
b
1
, and are normally distributed random variables with means equal to
β
0
,
β
1
, and
η
, respectively, and variances:
FIGURE 34.1
Examples of joint confidence regions for two parameter models. The elliptical regions (a) and (b) are typical
of linear models. The irregular shapes of (c) and (d) might be observed for nonlinear models.
(a)
(b)
(c )
(d )
β
1
2
β
β
1
θ
θ
θ
1
1
2
b
0
yb
1
x–=
b
1
∑ x
i
x–()y
i
y–()
∑ x
i
x–()
2
=
y
ˆ
y
ˆ
Var b
0
()
1
n
x
2
∑ x
i
x–()
2
+
σ
2
=
Var b
1
()
1
∑ x
i
x–()
2
σ
2
=
Var y
ˆ
0
()
1
n
x
0
x–()
2
∑ x
i
x–()
2
+
σ
2
=
L1592_frame_C34 Page 304 Tuesday, December 18, 2001 2:52 PM
© 2002 By CRC Press LLC
The value of
σ
2
is typically unknown and must be estimated from the data; replicate measurements will
provide an estimate. If there is no replication,
σ
2
is estimated by the mean residual sum of squares (s
2
)
which has
ν
= n − 2 degrees of freedom (two degrees of freedom are lost by estimating the two parameters
β
0
and
β
1
):
The (1 –
α
)100% confidence intervals for
β
0
and
β
1
are given by:
These interval estimates suggest that the joint confidence region is rectangular, but this is not so. The
joint confidence region is elliptical. The exact solution for the (1 −
α
)100% joint confidence region for
β
0
and
β
1
is enclosed by the ellipse given by:
where F
2,n−2,
α
is the tabulated value of the F statistic with 2 and n − 2 degrees of freedom.
The confidence interval for the mean response (
η
0
) at a particular value x
0
is:
The prediction interval for the future single observation ( = b
0
+ b
1
x
f
) to be recorded at a setting x
f
is:
Note that this prediction interval is larger than the confidence interval for the mean response (
η
0
) because
the prediction error includes the error in estimating the mean response plus measurement error in y. This
introduces the additional “1” under the square root sign.
Case Study: A Linear Model
Data from calibration of an HPLC instrument and the fitted model are shown in Table 34.1 and in
Figure 34.2. The results of fitting the model y =
β
0
+
β
1
x + e are shown in Table 34.2. The fitted equation:
s
2
∑ y
i
y
ˆ
–()
2
n 2–
S
R
n 2–
==
b
0
t
υ
,
α
/2
s
1
n
+
x
2
∑ x
i
x–()
2
±
b
1
t
υ
,
α
/2
s
1
∑ x
i
x–()
2
±
nb
0
β
0
–()
2
2
x
i
∑
b
0
β
0
–()b
1
β
1
–()
x
i
2
∑
b
1
β
1
–()
2
++2s
2
F
2,n−2,
α
=
b
0
b
1
x
0
+()t
υ
,
α
/2
s
1
n
x
0
x–()
2
∑ x
i
x–()
2
+±
y
ˆ
f
b
0
b
1
x
f
+()t
υ
,
α
/2
s 1
1
n
x
f
x–()
2
∑ x
i
x–()
2
++±
y
ˆ
b
0
b
1
x+ 0.566 139.759x+==
L1592_frame_C34 Page 305 Tuesday, December 18, 2001 2:52 PM
© 2002 By CRC Press LLC
is shown with the data in Figure 34.2. Also shown are the 95% confidence bounds for the mean and
future values.
An estimate of the variance of the measured values is needed to make any statements about the
precision of the estimated parameters, or to compute confidence intervals for the line. Because there is
no true replication in this experiment, the mean residual sum of squares is used as an estimate of the
variance
σ
2
. The mean residual sum of squares is the residual sum of squares divided by the degrees of
freedom (s
2
= = 1.194), which is estimated with
ν
= 15 − 2 = 13 degrees of freedom. Using this
value, the estimated variances of the parameters are:
Var (b
0
) = 0.2237 and Var (b
1
) = 8.346
TABLE 34.1
HPLC Calibration Data (in run order from left to right)
Dye Conc. 0.18 0.35 0.055 0.022 0.29 0.15 0.044 0.028
HPLC Peak Area 26.666 50.651 9.628 4.634 40.206 21.369 5.948 4.245
Dye Conc. 0.044 0.073 0.13 0.088 0.26 0.16 0.10
HPLC Peak Area 4.786 11.321 18.456 12.865 35.186 24.245 14.175
Source: Bailey, C. J., E. A. Cox, and J. A. Springer (1978). J. Assoc. Off. Anal. Chem., 61, 1404–1414.
TABLE 34.2
Results of the Linear Regression Analysis
Standard P
Variable Coefficient Error t (2-tail)
Constant 0.566 0.473 1.196 0.252
x 139.759 2.889 48.38 0.000
Analysis of Variance
Sum of Degrees of Mean
Source Squares Freedom Square F-Ratio P
Regression 2794.309 1 2794.309 2340 0.000000
Residual 15.523 13 1.194
FIGURE 34.2 Fitted calibration line with 95% confidence bounds for the mean and future values.
Dye Concentration
0 0.1 0.2 0.3 0.4
HPLC Peak Area
50
40
30
20
10
0
Fitted model
y = 0.556 + 139.759x
95% confidence
interval for the
mean response
95% confidence
interval for
future values
15.523
13
L1592_frame_C34 Page 306 Tuesday, December 18, 2001 2:52 PM
© 2002 By CRC Press LLC
The appropriate value of the t statistic for estimation of the 95% confidence intervals of the parameters
is t
ν
=13,
α
/2=0.025
= 2.16. The individual confidence intervals estimates are:
β
0
= 0.566 ± 1.023 or −0.457 <
β
0
< 1.589
β
1
= 139.759 ± 6.242 or 133.52 <
β
1
< 146.00
The joint confidence interval for the parameter estimates is given by the shaded area in Figure 34.2.
Notice that it is elliptical and not rectangular, as suggested by the individual interval estimates. It is
bounded by the contour with sum of squares value:
The equation of this ellipse, based on n = 15, b
0
= 0.566, b
1
= 139.759, s
2
= 1.194, F
2,13,0.05
= 3.8056,
∑ x
i
= 1.974, ∑ , is:
This simplifies to:
The confidence interval for the mean response
η
0
at a single chosen value of x
0
= 0.2 is:
The interval 27.774 to 29.262 can be said with 95% confidence to contain
η
when x
0
= 0.2.
The prediction interval for a future single observation recorded at a chosen value (i.e., x
f
= 0.2) is:
It can be stated with 95% confidence that the interval 26.043 to 30.993 will contain the future single
observation recorded at x
f
= 0.2.
Comments
Exact joint confidence regions can be developed for linear models but they are not produced automatically
by most statistical software. The usual output is interval estimates as shown in Figure 34.3. These do
help interpret the precision of the estimated parameters as long as we remember the ellipse is probably
tilted.
Chapters 35 to 40 have more to say about regression and linear models.
S
c
15.523 1
2
13
3.81()+
24.62==
x
i
2
0.40284=
15 0.566
β
0
–()
2
+2 1.974()0.566
β
0
–()139.759
β
1
–()+0.40284()139.759
β
0
–()
2
= 2 1.194()3.8056()
15
β
0
2
568.75
β
0
3.95
β
0
β
1
281.75
β
1
0.403
β
0
2
8176.52++–+– 0=
0.566 139.759 0.2()2.16 1.093()
1
15
0.2 0.1316–()
2
0.1431
+±+ 28.518 0.744±=
0.566 139.759 0.2()2.16 1.093()1
1
15
0.2 0.1316–()
2
0.1431
++±+ 28.518 2.475±=
L1592_frame_C34 Page 307 Tuesday, December 18, 2001 2:52 PM
© 2002 By CRC Press LLC
References
Bailey, C. J., E. A. Cox, and J. A. Springer (1978). “High Pressure Liquid Chromatographic Determination
of the Immediate/Side Reaction Products in FD&C Red No. 2 and FD&C Yellow No. 5: Statistical
Analysis of Instrument Response,” J. Assoc. Off. Anal. Chem., 61, 1404–1414.
Draper, N. R. and H. Smith (1998). Applied Regression Analysis, 3rd ed., New York, John Wiley.
Exercises
34.1 Nonpoint Pollution. The percentage of water collected by a water and sediment sampler was
measured over a range of flows. The data are below. (a) Estimate the parameters in a linear
model to fit the data. (b) Calculate the variance and 95% confidence interval of each parameter.
(c) Find a 95% confidence interval for the mean response at flow = 32 gpm. (d) Find a 95%
prediction interval for a measured value of percentage of water collected at 32 gpm.
34.2 Calibration. Fit the linear (straight line) calibration curve for the following data and evaluate
the precision of the estimate slope and intercept. Assume constant variance over the range of
the standard concentrations. Plot the 95% joint confidence region for the parameters.
34.3 Reaeration Coefficient. The reaeration coefficient (k
2
) depends on water temperature. The
model is k
2
(T ) =
θ
1
, where T is temperature and
θ
1
and
θ
2
are parameters. Taking
logarithms of both sides gives a linear model: ln[k
2
(T )] = ln[
θ
1
] + (T − 20) ln
θ
2
. Estimate
θ
1
and
θ
2
. Plot the 95% joint confidence region. Find 95% prediction intervals for a measured
value of k
2
at temperatures of 8.5 and 22°C.
FIGURE 34.3 Contour map of the mean sum of squares surface. The rectangle is bounded by the marginal confidence
limits of the parameters considered individually. The shaded area is the 95% joint confidence region for the two parameters
and is enclosed by the contour S
c
= 15.523[1 + (2/13)(3.81)] = 24.62.
Percentage 2.65 3.12 3.05 2.86 2.72 2.70 3.04 2.83 2.84 2.49 2.60 3.19 2.54
Flow (gpm) 52.1 19.2 4.8 4.9 35.2 44.4 13.2 25.8 17.6 47.4 35.7 13.9 41.4
Source: Dressing, S. et al. (1987). J. Envir. Qual., 16, 59–64.
Standard Conc. 0.00 0.01 0.100 0.200 0.500
Absorbance 0.000 0.004 0.041 0.082 0.196
2.0
1.5
1.0
0.5
0
-0.5
-1.0
130 140 150
1
b
b
2
Interval estimates
of the confidence
region
95% joint
confidence region
θ
2
T −20
L1592_frame_C34 Page 308 Tuesday, December 18, 2001 2:52 PM
© 2002 By CRC Press LLC
34.4 Diesel Fuel Partitioning. The data below describe organic chemicals that are found in diesel
fuel and that are soluble in water. Fit a linear model that relates partition coefficient (K) and
the aqueous solubility (S) of these chemicals. It is most convenient to work with the logarithms
of K and S.
34.5 Background Lead. Use the following data to estimate the background concentration of lead
in the wastewater effluent to which the indicated spike amounts of lead were added. What
is the confidence interval for the background concentration?
Temp. (°°
°°
C) 5.27 5.19 5.19 9.95 9.95 9.99 15.06 15.06 15.04
k
2
0.5109 0.4973 0.4972 0.5544 0.5496 0.5424 0.6257 0.6082 0.6304
Temp. (°°
°°
C) 20.36 20.08 20.1 25.06 25.06 24.85 29.87 29.88 29.66
k
2
0.6974 0.7096 0.7143 0.7876 0.7796 0.8064 0.8918 0.8830 0.8989
Source: Tennessee Valley Authority (1962). Prediction of Stream Reaeration Rates, Chattanooga, TN.
Compound log(K) log(S)
Naphthalene 3.67 −3.05
1-Methyl-naphthalene 4.47 −3.72
2-Methyl-naphthalene 4.31 −3.62
Acenaphthene 4.35 −3.98
Fluorene 4.45 −4.03
Phenanthrene 4.60 −4.50
Anthracene 5.15 −4.49
Fluoranthene 5.32 −5.19
Source: Lee, L. S. et al. (1992). Envir. Sci.
Technol., 26, 2104–2110.
Pb Added (
µµ
µµ
g/L) Five Replicate Measurements of Pb (
µµ
µµ
g/L)
0 1.8 1.2 1.3 1.4 1.7
1.25 1.7 1.9 1.7 2.7 2.0
2.5 3.3 2.4 2.7 3.2 3.3
5.0 5.6 5.6 5.6 5.4 6.2
10.0 11.9 10.3 9.3 12.0 9.8
L1592_frame_C34 Page 309 Tuesday, December 18, 2001 2:52 PM