Báo cáo y học: "Validation of a new transpulmonary thermodilution system to assess global enddiastolic volume and extravascular lung wate" pptx
Bạn đang xem bản rút gọn của tài liệu. Xem và tải ngay bản đầy đủ của tài liệu tại đây (444.85 KB, 8 trang )
RESEARC H Open Access
Validation of a new transpulmonary
thermodilution system to assess global end-
diastolic volume and extravascular lung water
Karim Bendjelid
1*
, Raphael Giraud
1
, Nils Siegenthaler
1
, Frederic Michard
2
Abstract
Introduction: A new system has been developed to assess global end-diastolic volume (GEDV), a volumetric
marker of cardiac preload, and extravascular lung water (EVLW) from a transpulmonary thermodilution curve. Our
goal was to compare this new system with the system currently in clinical use.
Methods: Eleven anesthetized and mechanically ventilated pigs were instrumented with a central venous catheter
and a right (PulsioCath; Pulsion, Munich, Germany) and a left (VolumeView
™; Edwards Lifesciences, Irvine, CA, USA)
thermistor-tipped femoral arterial catheter. The right femoral catheter was used to me asure GEDV and EVLW using
the PiCCO
2
™ (Pulsion) method (GEDV
1
and EVLW
1
, respectively). The left femoral catheter was used to measure the
same parameters using the new VolumeView
™ (Edwards Lifesciences) method (GEDV
2
and EVLW
2
, respectively).
Measurements were made during inotropic stimulation (dobutamine), during hypovolemia (bleeding), during
hypervolemia (fluid overload), and after inducing acute lung injury (intravenous oleic acid).
Results: One hundred and thirty-seven paired measurements were analyzed. GEDV
1
and GEDV
2
ranged from 701
to 1,629 ml and from 774 to 1,645 ml, respectively. GEDV
1
and GEDV
2
were closely correlated (r
2
= 0.79), with
mean bias of -11 ± 80 ml and percentage error of 14%. EVLW
1
and EVLW2 ranged from 507 to 2,379 ml and from
495 to 2,222 ml, respectively. EVLW
1
and EVLW
2
were closely correlated (r
2
= 0.97), with mean bias of -5 ± 72 ml
and percentage error of 15%.
Conclusions: In animals, and over a very wide range of values, a goo d agreement was found between the new
VolumeView
™ system and the PiCCO™ system to assess GEDV and EVLW.
Introduction
Transpulmonary thermodilution (TPTD) is increasingly
used for hemodynamic evaluations in critically ill
patients [1-4]. After injection of a cold i ndicator in the
superior vena cava, TPTD allows the computation of
cardiac output (CO) from a TPTD curve recorded by a
thermistor-tipped femoral arterial catheter [4]. Addi-
tional physiological parameters can be derived from the
dilution curve, such as global end diastolic volume
(GEDV), a volumetric marker of cardiac preload [5-7],
and extravascular lung water (EVLW) [7-10].
The TPTD metho d currently in clinical use and
implemented in the PiCCO
™ system (Pulsion Medical
Systems, Munich, Germany) is based on mathematical
models described in the 1950 s [ 11,12]. A new and origi-
nal method has recently been developed to derive GEDV
and EVLW from a TPTD curve (VolumeView
™ ;
Edwards Lifesciences, Irvine, CA, U SA). The aim of the
present a nimal study was to compare the new Volume-
View
™ system with the PiCCO™ system, over a wide
range up to extreme pathophysiological conditions.
Materials and methods
The study was approved for the use of swine by the
Institutional Animal Care and Use Committee at the
Edwards Lifesciences Biological Resource Center, and all
experimentation was done in accordance with the Guide
* Correspondence:
1
Department of APSI, Geneva University Hospitals, 4 rue Gabrielle- Perret-
Gentil, Genève 14-1211, Switzerland
Full list of author information is available at the end of the article
Bendjelid et al. Critical Care 2010, 14:R209
/>© 2010 Engvall et al.; licensee BioMed Central Ltd. This is an open access article distributed under the terms of the Creative Commons
Attribution License (<url>htt p://creativecommons.org/licenses/by/2.0</url>), which permits unrestricted use, distribution, and
reproduction in any medium, provided the original work is properly cited.
for the Care and Use of Laboratory Animals (1996;
ILAR, NAP, Washington, DC, USA).
Eleven anesthetized a nd mechanically ventilated pigs
(90 to 110 kg) were studied. Animals were premedicated
with intramuscular midazolam (0.5 mg/kg) and atropine
(0.5 mg) and were anesthetized with an injection of pro-
pofol (1 mg/kg) followed by continuous infusion of pro-
pofol (150 μg/kg/min) and sufentanil (2.5 μg/kg/h).
After tracheal intubation, pigs were mechanically v enti-
lated in a volume-controlled mode with a FiO
2
of 50%,
a respiratory rate between 12 and 16 breaths/minute (to
maintain an end-expiratory partial pressure o f carbon
dioxide within the normal range), a positive end-expira-
tory pressure of 0 cmH
2
O and a tidal volume of 10 ml/
kg.
All animals were instrumented with a right (Pulsio-
Cath
™ ; Pulsion Medical Systems) and a left (Volume-
View
™ ; Edwards Lifesciences) 5F thermistor-tipped
femoral arterial catheter. The correct position of femoral
catheters was confirmed by radioscopy (Figure 1).
All a nimals were also instrumented with a pulmonary
artery catheter (CCComboV
™ , 7.5F; Edwards Life-
sciences) inserted through the right jugular vein and
with a central venous catheter in the left jugular vein
(Figure 1). The pulmonary artery catheter was used for
continuous monitoring of CO (Vi gilance II; Edwards
Lifesciences) and pulmonary arterial pressures during
the e xperimental protocol. The central venous catheter
was used for cold indicator injections and for central
venous pressure monitoring. Pulmonary artery pres-
sures, c ontinuous CO and central venous pressure data
were used to guide therapy at various stages (as
described below) but were not recorded nor analyzed.
The current transpulmonary thermodilution system
The right femoral catheter was connected to a PiCCO
2
™
monitor (Pulsion Medical Systems) and used to measure
CO (CO
1
), GEDV (GEDV
1
) and EVLW (EVLW
1
)using
the following equations [1,7,9,10]:
CO AU
C
1
=−
()
VT Tk
ib i
where V
i
is the injectate volume, T
b
is blood tempera-
ture, T
i
is injectate temperature, k is a constant propor-
tional to the specific w eights and specific heat of blood
and injectate, and AUC is the area under the TPTD
curve.
GEDV CO MTt DS
t
11
=× −
()
where MTt is the mean transit time of the cold indica-
tor and DSt is the exponential downslope time (Figure 1).
E
VLW CO MTt GEDV
11 1
125=×
()
−×
()
.
The new transpulmonary thermodilution system
The l eft femoral catheter was connected to the
EV1000
™ monitor (Edwards Lifesciences) and used to
measure CO (CO
2
), GEDV (GEDV
2
)andEVLW
(EVLW
2
). CO was derived from the dilution curve using
the same Stewart Hamilton equation:
CO AUC
2
=−
()
VT T
ib i
GEDV, however, was derived from a different equation
as follows:
GEDV CO MTt f S S
22
21=××
()
where S1 and S2 are respectively the maximum
ascending and descending slopes of the thermodilution
curve (Figure 1) and f is a proprietary function.
Finally, EVLW was assessed using the equation:
E
VLW CO DSt GEDV
22 2
025=×
()
−×
()
.
The same cold saline bolus injected through the cen-
tral venous catheter was used to compute simulta-
neouslythetwotranspulmonarycurves:onewiththe
right femoral catheter PiCCO
2
™ (Pulsion Medical
Systems), the other with the left femoral catheter
(EV1000
™; Edwards Lifesciences) . The average of three
bolus measurements was considered for analysis and is
reported in Results.
Experimental protocol
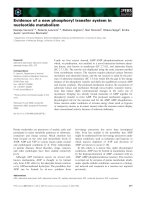
The experimental proto col is summar ized in Figure 2.
Measurements were performed: at baseline; during
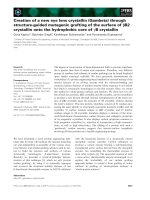
Figure 1 Transpulmonary thermodilution curve. The assessment
of global end-diastolic volume (GEDV) by the PiCCO
™ system is
based on the mean transit time (MTt) and exponential downslope
time (DSt), while the assessment of GEDV by the new
VolumeView
™ method is based on MTt, maximum ascending slope
(S1) and maximum descending slope (S2).
Bendjelid et al. Critical Care 2010, 14:R209
/>Page 2 of 8
dobutamine infusion (DOBU, starting at 7.5 μg/kg/min-
ute and titrated to induce a 30 to 50% increase in con-
tinuous CO); 5 minutes after stopping dobutamine
infusion; after inducing hypovolemia (HYPO, controlled
hemorrhage to decrease mean arterial pressure (MAP)
around 50 mmHg); after blood restitution and fluid load-
ing (2/3 blood + 1/3 serum saline); and after f luid over-
loading (HYPER, 75% serum saline + 25% gelatin in order
to increase MAP up to 130 mmHg and/or central venous
pressure up to 20 mmHg). At each stage, a 10-minute sta-
bilization period was obse rved before doing the measure-
ments. Fi nally, additional measurements were performed
after inducing acute lung injury (ALI) by injecting intrave-
nously oleic acid (O1383, 100 mg/kg/hour).
At this stage, several m easurements were performed
successively in order to capture high EVLW values.
Oleic acid-ind uced pulmonary edema was confirmed by
the occurrence of arterial hypoxemia (drop in PaO
2
/
FiO
2
and SaO
2
), a drop in the compliance of the respira-
tory system (inc rease in airway pressures while the tidal
volume was maintained constant or even decreased) and
lung infiltrates on chest X-ray scan ( Figure 1). At this
point, FiO
2
and the positive end-expiratory pressure
were respectively increased up to 100% and 15 cmH
2
O
when necessary to maintain SaO
2
> 90%. Oleic acid may
induceadramaticincreaseinpulmonaryarterypres-
sures and a decrease in CO (right ventricular failure).
Phenylephrine and dobutamine were therefore also
administered when necessary to maintain MAP >50
mmHg and continuous CO >5 l/minute as long as pos-
sible. When it was no longer possible to maintain SaO
2
> 90% and MAP >50 mmHg, data co llection was
stopped and animals were sacrificed (with pentobar bital
and phenytoin).
Statistical analysis
Results are expressed as the mean ± standard deviation
(SD), unless specified otherwise. Percentage errors for
CO, GEDV and EVLW comparisons were calculated as
twice the SD of the bia s over the average CO, GEDV or
EVLW value, respectively [13].Allbias,SDs,limitsof
agreement (2SD) and percentage errors reported in the
manuscript have been corrected for multiple measure-
ments according to the method proposed by Bland and
Altman [14].
Reproducibility of TPTD measurements was assessed
by calculating the standard deviation/mean ratio of tri-
plicate measurements and is expressed as a percentage.
The effect of each intervention ( DOBU, HYPO, HYPER,
ALI) versus the previous stage was assessed using a
parametric test (paired t test) or nonparametr ic test
(paired Wilcoxon test) when appropriate. Values
obtained using both methods were also compared at
each stage using unpaired tests (parametric or nonpara-
metric as appropriate).
Several measurements were performed at the latest
stage (ALI) in order to capture high EVLW values. At
this stage, only measurements corresponding to the
maximum EVLW
1
(the reference method in the present
study) have been selected for comparisons with EVLW
2
.
For the linear regression analysis, however, all measure-
ments were taken into account. P < 0.05 was considered
statistically significant.
Results
A total of 137 paired measurements were available for
comparisons. Sixty-six paired measurements were col-
lected from stages 1 to 6 (6 stages × 11 pigs) and 71
additional paired measurements (6.5 ± 2.1 per pig) were
collected at the final lung injury stage. No data were dis-
carded. The reproducibility of hemodynamic parameters
is reported in Table 1.
Overall, CO
1
and CO
2
ranged from 3.1 to 15.4 l/min-
ute and from 3.4 to 15.1 l/minute, respectively. CO
1
and
CO
2
were closely correlated (r
2
= 0.99), with mean bias
(± SD) of 0.20 ± 0.30 l/minute and percentage error of
7% (Figure 3). GEDV
1
and GEDV
2
ranged from 701 to
Intubation
Equipment
(catheter and probes)
Stabilisation period
1. Baseline 1
2. Dobutamine
3. Baseline 2
4. Hypovolemia
5. Baseline 3
6. Hypervolemia
7. Acute Lung Injury
*
Euthanasia
Haemorrhage
Volume loading
Oleic acid IV
Preparation
Volume restitution
Figure 2 Flow chart of the experimental protocol. *Multiple
measurements. IV, intravenous.
Bendjelid et al. Critical Care 2010, 14:R209
/>Page 3 of 8
1,629 ml and from 774 to 1,645 ml. GEDV
1
and GEDV
2
were closely correlated (r
2
= 0.79), w ith mean bias of
-11 ± 80 ml and percentage error of 14% (Figure 4).
EVLW
1
and EVLW
2
ranged from 507 to 2,379 ml and
from 495 to 2,222 ml. EVLW
1
and EVLW
2
were closely
correl ated (r
2
= 0.97), with mean bias of -5 ± 72 ml and
percentage error of 15% (Figure 5).
Changes in CO
2
,GEDV
2
,andEVLW
2
were closely
correlated with changes in CO
1
,GEDV
1
, and EVLW
1
,
respectively (Figure 6).
The effects of each intervention are s ummarized in
Table 2. Inotropic stimulation (DOB U) was achieved by
administering an average 23 μg/kg/minute dose of dobu-
tamine, hypovolemia (HYPO) by an average 1.2 l con-
trolled hemorrhage, and hypervolemia (HYPER) by the
average infusion of 4.5 l serum saline and 1.5 l gelatin.
Both GEDV
1
and GEDV
2
decreased significantly during
bleeding and increased significantly after blood restitu-
tion and fluid loading (Table 2). EVLW
1
and EVLW
2
increased slightly but significantly during fluid overload
and dramatically (+110%) during ALI (Table 2). At each
stage, values measured with the new VolumeView
™ and
with the current PiCCO
™ method were comparable
(Table 2).
Discussion
In animals, and over a wide range of values , the present
study demonstrates that GEDV and EVLW derived from
the new VolumeView
™ met hod and from the current
PiCCO
™ method are interchangeable.
Both methods derive CO from the TPTD curve using
the Stewart-Hamilton principles and the same equation
[4]so,notsurprisingly,theagreementwasextremely
good with a percentage error of 7%, far below the clini-
cally acceptable threshold value of 30% proposed by
Critchley and Critchley [13].
In contrast, GEDV was derived from two different
equations. The PiCCO
™ equation is based on time char-
acteristics of the TPTD curve (mean transit time of the
cold indicator and exponential downslope time) while
the new VolumeView
™ equation additionally relies on
the ascending and descending slopes of the dilution
curve (Figure 1). The present results show that both
methods are interchangeable to assess GEDV even when
significant changes in cardiac preload are induced by
bleeding and fluid loading. They also confirm that
GEDV is not affected by dobutamine-induced changes
in CO, and hence that there is no mathematical
Table 1 Reproducibility of transpulmonary
thermodilution measurements
PiCCO™ method VolumeView™ method
Cardiac output (%) 6.3 ± 5.1 5.7 ± 4.9
Global end-diastolic
volume (%)
6.8 ± 5.3 6.9 ± 5.0
Extravascular lung
water (%)
5.5 ± 4.0 5.7 ± 4.2
Data presented as mean ± standard deviation.
468101214
4
6
8
10
12
14
468101214
-1.0
-0.5
0.0
0.5
1.0
CO
1
(l/min) Average CO
1
&CO
2
(l/min)
C
O
2
(l/min) CO
2
Ͳ CO
1
(l/min)
+2S
D
Ͳ2SD
Bias
r
2
=0.99
y=1.03x–0.02
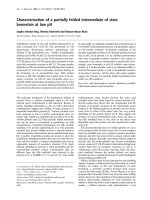
Figure 3 Cardiac output comparison. Left: correlation between cardiac output (CO) measured by the PiCCO™ system (CO
1
)andthe
VolumeView™ system (CO
2
). Right: Bland-Altman representation depicting the agreement between both methods. SD, standard deviation.
Bendjelid et al. Critical Care 2010, 14:R209
/>Page 4 of 8
coupling between both parameters [3,5]. The GEDV has
been shown to be a reliable indicator of cardi ac preload
[5], varying in the same direction as echocardiographic
preload indices [6]. A goal-directed strategy based on
the optimization of GEDV has been shown to be useful
to improve the postoperative outcome of cardiac surgi-
cal patients [15].
Both methods were also interchangeabl e fo r the
assessment of EVLW; not only during slight modifica-
tions induced by fluid overload, b ut also during
800 1000 1200 1400 1600
800
1000
1200
1400
1600
800 1000 1200 1400 1600
-200
-100
0
100
200
GEDV
1
(ml) AverageGEDV
1
&GEDV
2
(ml)
G
EDV
2
(
ml
)
GEDV
2
Ͳ GEDV
1
(
ml
)
+2S
D
Ͳ2SD
Bias
r
2
=0.79
y=0.85x+155
Figure 4 Global end-diastolic volume compar ison. Left: correlation between global end-diastolic volume (GEDV) measured by the PiCCO™
system (GEDV
1
) and the VolumeView™ system (GEDV
2
). Right: Bland-Altman representation depicting the agreement between both methods.
SD, standard deviation.
500 1000 1500 2000
500
1000
1500
2000
500 1000 1500 2000
-200
-100
0
100
200
EVLW
1
(ml) AverageEVLW
1
&EVLW
2
(ml)
E
VLW
2
(
ml
)
EVLW
2
Ͳ EVLW
1
(
ml
)
+2S
D
Ͳ2SD
Bias
r
2
=0.97
y=0.97x+24
Figure 5 Extravascular lung water comparison. Left: correlation between extravascular lung water (EVLW) measured by the PiCCO™ system
(EVLW
1
) and the VolumeView™ system (EVLW
2
). Right: Bland-Altman representation depicting the agreement between both methods. SD,
standard deviation.
Bendjelid et al. Critical Care 2010, 14:R209
/>Page 5 of 8
dramatic increases related to capillary leak as those
observed during the ALI phase (Table 2). Assessing
EVLW may be useful for clinicians treating patients
with ALI or left ven tricular failure [16]. EVLW has been
shown to be more sensitive and specific than chest X-
ray and ALI criteria to diagnose pulmonary edema
[17,18]. EVLW is also a prognostic parameter since it
has repeatedly been shown to be correlated with mortal-
ity in pati ents with ALI as well as in the general inten-
sive care unit population [19-22]. Moreover, it has been
suggested in critically ill pa tients that goal-directed stra-
tegies based on the measurement of EVLW may be
associated with a decrease in the duration of mechanical
ventilation and length of hospital stay [15,23,24].
Surprisingly, EVLW
1
increased slightly but signifi-
cantly during dobutamine infusion and decreased
slightly but significantly during bleeding, while EVLW
2
did not change (Table 2). From a pathophysiological
point of view, no change in lung water is expected dur-
ing inotropic stimulation or hypovolemia, particularly
over such a short period of time [25]. Since our study
was not designed to compare the PiCCO
™ method and
the VolumeView
™ method with a third reference
method (such as gravimetry), however, we cannot draw
any definitive conclusions regarding the superiority of
one method over the other.
Our study also confirms the very good reproducibility
of TPTD measurements. These findi ngs are in line with
-5 0 5
-5
0
5
DeltaCO
2
(l
/
min)
-400 -200 0 200 400
-400
-200
0
200
400
-200 0 200 400 600 800 1000
-200
0
200
400
600
800
1000
DeltaCO
1
(l/min)
DeltaGEDV
2
(ml) DeltaEVLW
2
(ml)
DeltaGEDV
1
(ml) DeltaEVLW
1
(ml)
r
2
=0.98
r
2
=0.80 r
2
=0.89
Figure 6 Correlat ions between changes in hemodynamic parameters between the two measurement methods. Correlations between
changes in cardiac output (CO), changes in global end-diastolic volume (GEDV) and changes in extravascular lung water (EVLW) measured by
the PiCCO
™ system (CO
1
, GEDV
1
and EVLW
1
) and by the VolumeView™ system (CO
2
, GEDV
2
and EVLW
2
).
Table 2 Transpulmonary thermodilution parameters over the study period
BASE1 DOBU BASE2 HYPO BASE3 HYPER ALI
CO
1
(l/min)
7.5 ± 0.9, 7.6
(6.9 to 8.2)
10.8 ± 1.4*, 10.9
(10.0 to 11.5)
7.5 ± 0.7, 7.4
(7.2 to 7.8)
4.7 ± 0.3*, 4.9
(4.5 to 4.9)
7.9 ± 1.2, 7.7
(7.2 to 8.6)
11.7 ± 2.1*, 11.8
(10.1 to 13.1)
6.7 ± 3.3*, 5.2
(4.5 to 8.7)
CO
2
(l/min)
7.6 ± 0.8, 7.9
(7.3 to 8.1)
11.0 ± 1.6*, 11.0
(10.1 to 11.7)
7.6 ± 0.8, 7.3
(7.1 to 8.1)
4.8 ± 0.2*, 4.9
(4.6 to 4.9)
8.0 ± 1.2, 8.0
(7.3 to 8.7)
12.0 ± 2.1*, 11.8
(10.5 to 13.5)
6.9 ± 3.4*, 5.7
(4.6 to 9.0)
GEDV
1
(ml)
1,077 ± 149, 1,116
(953 to 1,171)
1,059 ± 134,
1,001 (958 to
1,167)
1,110 ± 147, 1,139
(990 to 1,230)
925 ± 84*, 943
(885 to 977)
1,173 ± 120, 1,164
(1,102 to 1,240)
1,326 ± 140*, 1,288
(1,245 to 1,440)
1,070 ± 191*, 1,144
(929 to 1,170)
GEDV
2
(ml)
1,052 ± 94, 1,040
(1,009 to 1,076)
1,023 ± 102,
1,038 (942 to
1,056)
1,093 ± 124, 1,117
(1,000 to 1,177)
931 ± 66*, 937
(911 to 978)
1,153 ± 100, 1,157
(1089 to 1,214)
1,299 ± 162*, 1,322
(1,218 to 1,363)
1,089 ± 174*, 1,118
(976 to 1,194)
EVLW
1
(ml)
622 ± 86, 627
(558 to 684)
691 ± 112, 650
(631 to 723)**
653 ± 106, 639
(577 to 692)
609 ± 72*, 597
(549 to 675)
644 ± 82, 638
(563 to 710)
754 ± 117, 804
(654 to 858)**
1,587 ± 380, 1,609
(1,305 to 1,711)**
EVLW
2
(ml)
621 ± 82, 613
(552 to 683)
642 ± 68, 628
(596 to 666)
635 ± 85, 619
(592 to 678)
624 ± 68, 626
(580 to 679)
624 ± 80, 587
(567 to 710)
749 ± 128*, 750
(654 to 823)
1,571 ± 335*, 1,580
(1,374 to 1,752)
Results are expressed as the mean ± standard deviation, median (interquartile range). CO, cardiac output; GEDV, global end-diastolic volume; EVLW, extravascular
lung water; subscript 1, current method (PiCCO
™; Pulsion); subscript 2, new method (VolumeView™; Edwards); BASE, baseline; DOBU, dobutamine infusion;
HYPO, hypovolemia induced by bleeding; HYPER, hypervolemia induced by volume loading; ALI, acute lung injury induced by oleic acid. *P < 0.01 (DOBU vs.
BASE1 or HYPO vs. BASE2 or HYPER vs. BASE3 or ALI vs. HYPER); normal distribution, paired t test. **P < 0.01 (DOBU vs. BASE1 or HYPER vs. BASE3 or ALI vs.
HYPER); abnormal distribution, nonparametric paired Wilcoxon signed-rank test. At each stage, values measured with the new VolumeView
™ and with the
current PiCCO
™ method were comparable.
Bendjelid et al. Critical Care 2010, 14:R209
/>Page 6 of 8
previous studies [5,26] reporting reproducibility of CO,
GEDVandEVLWof4to7%,5to8%and11%,
respectively.
Study limitations
The gravimetric method in animals and the double indi-
cator (cold green dye) dilution method in humans are
considered gold standard methods to quantify EVLW
[9,10]. The goal of the present study was to compare
the new VolumeView
™ system with the TPTD system
currently in clinical use - this is why the PiCCO
™ sys-
tem has bee n selected as the reference method in our
study. A clinical validation is necessary to investigate
whether the new VolumeView
™ system is also compar-
able with the PiCCO
™ system in critically ill patients.
The new VolumeView
™ algorithm was originally devel-
oped to decrease the sensitivity of TPTD to recirculation
and thermal baseline drifts. The present study was not
desi gned to investigate this potential advantage over the
existing TPTD technology, but instead to ensure that
the new VolumeView
™ system and the PiCCO™ system
are interchangeable in clinical-like conditions where CO,
blood volume and lung water vary significantly. Further
studies are therefore required to compare both systems
in situa tions where technical (thermal baseline drift) or
other clinical challenges (for example, valvular regurgita-
tion-induced recirculation) are encountered.
Conclusions
In animals, and over a very wide range of values, the
new TPTD VolumeView
™ system is comparable with
the current PiCCO
™ system to assess CO, GEDV and
EVLW d uring inotropic stimulat ion, acute hemorrhage,
fluid overload and severe acute lung injury.
Key messages
• TPTD is increasingly used for hemodynamic evalua-
tions in critically ill patients.
• The TPTD method currently in clinical use and
implemented in the PiCCO
™ system (Pulsion Medical
Systems) is based on mathematical models described in
the 1950 s.
• A new and original method has recently been devel-
oped to derive GEDV and EVLW from a TPTD curve
(VolumeView
™; Edwards Lifesciences).
• In animals, and over a very wide range of values, the
new transpulmonary thermodilution VolumeView
™ sys-
tem is comparable with the current PiCCO
™ system to
assess CO, GEDV and EVLW during inotropic stimula-
tion, acute hemorrhage, fluid overload and severe acute
lung injury.
Abbreviations
ALI: acute lung injury induced by oleic acid; CO: cardiac output; CO
1
: cardiac
output measured by PiCCO
2
™;CO
2
: cardiac output measured by EV1000;
DOBU: dobutamine infusion; GEDV: global end-diastolic volume; GEDV
1
:
global end-diastolic volume measured by PiCCO
2
™; GEDV
2
: global end-
diastolic volume measured by EV1000; EVLW: extravascular lung water;
EVLW
1
: extravascular lung water measured by PiCCO
2
™; EVLW
2
: extravascular
lung water measured by EV1000; HYPO: hypovolemia induced by bleeding;
HYPER: hypervolemia induced by volume loading; MAP: mean arterial
pressure; SD: standard deviation; TPTD: transpulmonary thermodilution.
Acknowledgements
The present study was funded by Edwards Lifesciences. The study was
designed and conducted, and the results analyzed, under the supervision of
KB, with the support of Kate Willibyro (Edwards, Irvine, CA, USA) for data
collection, Pascal Candolfi (Edwards, Nyon, Switzerland) for statistics, and Dr
Michard (Edwards, Nyon, Switzerland) for design and writing. KB, RG and NS
had full control of the database, which was locked before analysis, were
responsible for interpretation of the results, and made the final decision to
submit the manuscript for publication.
Author details
1
Department of APSI, Geneva University Hospitals, 4 rue Gabrielle- Perret-
Gentil, Genève 14-1211, Switzerland.
2
Department of Critical Care, Edwards
Lifesciences, 70 route de l’Etraz, Nyon 1260, Switzerland.
Authors’ contributions
KB and FM designed the study and wrote the article. KB was responsible for
data collection and data analysis, with the help of RG and NS. All authors
reviewed and approved the final manuscript.
Competing interests
KB received consultant fees from Edwards LifeSciences. FM is a director at
Edwards Lifesciences and is coinventor on transpulmonary thermodilution
patents (US2005267378, US2007282213, WO2009049872). RG and NS have
no potential conflicts of interest to declare.
Received: 26 June 2010 Revised: 8 October 2010
Accepted: 23 November 2010 Published: 23 November 2010
References
1. Michard F, Perel A: Management of circulatory and respiratory failure
using less invasive hemodynamic monitoring. In Yearbook of Intensive
Care and Emergency Medicine. Edited by: Vincent JL. Berlin: Springer;
2003:508-520.
2. Isakow W, Schuster DP: Extravascular lung water measurements and
hemodynamic monitoring in the critically ill: bedside alternatives to the
pulmonary artery catheter. Am J Physiol Lung Cell Mol Physiol 2006, 291:
L1118-L1131.
3. Benington S, Ferris P, Nirmalan M: Emerging trends in minimally invasive
haemodynamic monitoring and optimization of fluid therapy. Eur J
Anaesthesiol 2009, 26:893-905.
4. Reuter DA, Huang C, Edrich T, Shernan SK, Eltzschig HK: Cardiac output
monitoring using indicator-dilution techniques: basics, limits, and
perspectives. Anesth Analg 2010, 110:799-811.
5. Michard F, Alaya S, Zarka V, Bahloul M, Richard C, Teboul JL: Global end-
diastolic volume as an indicator of cardiac preload in patients with
septic shock. Chest 2003, 124:1900-1908.
6. Hofer CK, Furrer L, Matter-Ensner S, Maloigne M, Klaghofer R, Genoni M,
Zollinger A: Volumetric preload measurement by thermodilution: a
comparison with transoesophageal echocardiography. Br J Anaesth 2005,
94:748-755.
7. Sakka SG, Rühl CC, Pfeiffer UJ, Beale R, McLuckie A, Reinhart K, Meier-
Hellmann A: Assessment of cardiac preload and extravascular lung water
by single transpulmonary thermodilution. Intensive Care Med 2000,
26:180-187.
Bendjelid et al. Critical Care 2010, 14:R209
/>Page 7 of 8
8. Michard F, Schachtrupp A, Toens C: Factors influencing the estimation of
extravascular lung water by transpulmonary thermodilution in critically
ill patients. Crit Care Med 2005, 33:1243-1247.
9. Michard F: Bedside assessment of extravascular lung water by dilution
methods: temptations and pitfalls. Crit Care Med 2007, 35:1186-1192.
10. Brown LM, Liu KD, Matthay MA: Measurement of extravascular lung water
using the single indicator method in patients: research and potential
clinical value. Am J Physiol Lung Cell Mol Physiol 2009, 297:L547-L558.
11. Newman EV, Merrell M, Genecin A, Monge C, Milnor WR, McKeever WP: The
dye dilution method for describing the central circulation. An analysis of
factors shaping the time-concentration curves. Circulation 1951,
4:735-746.
12. Meier P, Zierler KL: On the theory of the indicator-dilution method for
measurement of blood flow and volume. J Appl Physiol 1954, 6:731-744.
13. Critchley LA, Critchley JA: A meta-analysis of studies using bias and
precision statistics to compare cardiac output measurement techniques.
J Clin Monit Comput 1999, 15:85-91.
14. Bland JM, Altman DG: Agreement between methods of measurement
with multiple observations per individual. J Biopharm Stat 2007,
17:571-582.
15. Goepfert MSG, Reuter DA, Akyol D, Lamm P, Kilger E, Goetz A: Goal-
directed fluid management reduces vasopressor and catecholamine use
in cardiac surgery patients. Intensive Care Med 2007, 33:96-103.
16. Michard F, Phillips C: Measuring extravascular lung water (and derived
parameters) in patients with acute respiratory distress syndrome: what’s
right, what’s wrong, and what’s ahead? Crit Care Med 2009, 37:2118-2119.
17. Michard F, Zarka V, Alaya S: Better characterization of acute lung injury/
ARDS using lung water. Chest 2004, 125:1166-1167.
18. Martin GS, Eaton S, Mealer M, Moss M: Extravascular lung water in
patients with severe sepsis: a prospective cohort study. Crit Care 2005, 9:
R74-R82.
19. Berkowitz DM, Danai PA, Eaton S, Moss M, Martin GS: Accurate
characterization of extravascular lung water in acute respiratory distress
syndrome. Crit Care Med 2008, 36:1803-1809.
20. Sakka SG, Klein M, Reinhart K, Meier-Hellmann A: Prognostic value of
extravascular lung water in critically ill patients. Chest 2002,
122:2080-2086.
21. Kuzkov VV, Kirov MY, Sovershaev MA, Kuklin VN, Suborov EV, Waerhaug K,
Bjertnaes LJ: Extravascular lung water determined with single
transpulmonary thermodilution correlates with the severity of sepsis-
induced acute lung injury. Crit Care Med 2006, 34:1647-1653.
22. Phillips CR, Chesnutt MS, Smith SM: Extravascular lung water in sepsis-
associated acute respiratory distress syndrome: indexing with predicted
body weight improves correlation with severity of illness and survival.
Crit Care Med 2008, 36:69-73.
23. Mitchell JP, Schuller D, Calandrino FS, Schuster DP: Improved outcome
based on fluid management in critically ill patients requiring pulmonary
artery catheterization. Am Rev Respir Dis 1992, 145:990-998.
24. Eisenberg PR, Hansbrough JR, Anderson D, Schuster DP: A prospective
study of lung water measurements during patient management in an
intensive care unit. Am Rev Respir Dis 1987, 136:662-668.
25. Nirmalan M, Willard TM, Edwards DJ, Little RA, Dark PM: Estimation of
errors in determining intrathoracic blood volume using the single
transpulmonary thermal dilution technique in hypovolemic shock.
Anesthesiology 2005, 103:805-812.
26. Gödje O, Peyerl M, Seebauer T, Dewald O, Reichart B: Reproducibility of
double-indicator dilution measurements of intrathoracic blood
compartments, extravascular lung water, and liver function. Chest 1998,
113:1070-1077.
doi:10.1186/cc9332
Cite this article as: Bendjelid et al.: Validation of a new transpulmonary
thermodilution system to assess global end-diastolic volume and
extravascular lung water. Critical Care 2010 14:R209.
Submit your next manuscript to BioMed Central
and take full advantage of:
• Convenient online submission
• Thorough peer review
• No space constraints or color figure charges
• Immediate publication on acceptance
• Inclusion in PubMed, CAS, Scopus and Google Scholar
• Research which is freely available for redistribution
Submit your manuscript at
www.biomedcentral.com/submit
Bendjelid et al. Critical Care 2010, 14:R209
/>Page 8 of 8