Báo cáo y học: "Risk assessment in the first fifteen minutes: a prospective cohort study of a simple physiological scoring system in the emergency department" ppsx
Bạn đang xem bản rút gọn của tài liệu. Xem và tải ngay bản đầy đủ của tài liệu tại đây (555.88 KB, 9 trang )
RESEARCH Open Access
Risk assessment in the first fifteen minutes: a
prospective cohort study of a simple physiological
scoring system in the emergency department
Tobias M Merz
1*
, Reto Etter
1
, Ludger Mende
1
, Daniel Barthelmes
1
, Jan Wiegand
1
, Luca Martinolli
2
, Jukka Takala
1
Abstract
Introduction: The survival of patients admitted to an emergency department is determined by the severity of
acute illness and the quality of care provided. The high number and the wide spectrum of severity of illness of
admitted patients make an immediate assessment of all patients unrealistic. The aim of this study is to evaluate a
scoring system based on readily available physiological parameters immediately after admission to an emergency
department (ED) for the purpose of identification of at-risk patients.
Methods: This prospective observational cohort study includes 4,388 consecutive adult patients admitted via the
ED of a 960-bed tertiary referral hospital over a period of six months. Occurrence of each of seven potential vital
sign abnormal ities (threat to airway, abnormal respiratory rate, oxygen saturation, systolic blood pressure, heart rate,
low Glasgow Coma Scale and seizures) was collected and added up to generate the vital sign score (VSS). VSS
initial
was defi ned as the VSS in the first 15 minutes after admission, VSS
max
as the maximum VSS throughout the stay in
ED. Occurrence of single vital sign abnormalities in the first 15 minutes and VSS
initial
and VSS
max
were evaluated as
potential predictors of hospital mortality.
Results: Logistic regression analysis identified all evaluated single vital sign abnormalities except seizures and
abnormal respiratory rate to be independent predictors of hospital mortality. Increasing VSS
initial
and VSS
max
were
significantly correlated to hospital mortality (odds ratio (OR) 2.80, 95% confidence interval (CI) 2.50 to 3.14, P <
0.0001 for VSS
initial
; OR 2.36, 95% CI 2.15 to 2.60, P < 0.0001 for VSS
max
). The predictive power of VSS was highest if
collected in the first 15 minutes after ED admission (log rank Chi-square 468.1, P < 0.0001 for VSS
initial
;,log rank Chi
square 361.5, P < 0.0001 for VSS
max
).
Conclusions: Vital sign abnormalities and VSS collected in the first minutes after ED admission can identify patients
at risk of an unfavourable outcome.
Introduction
The survival of patients admitted to an emergency depart-
ment is determined by the severity of acute illness at
admission [1] and the level and quality of care provided
[2,3]. The high numbe r of admissi ons and the wide spec-
trum of severity of illness characteristic of large emergency
departments make immediate assessment of all patients by
an emergency ph ysician unrealistic [4,5]. Var ious scoring
system s have been proposed for identification of patients
at risk of deterioration of vital organ functions in the
emerge ncy department [6-9]. Ideally, t he first health care
provider encountering the patient should be able to recog-
nize the need for urgent attention within minutes of emer-
gency department admission, without laboratory and
radiological examinations or the presence of a specialized
physician. Systematic checks for airway, breathing, circula-
tion and level of consciousness are included in resuscita-
tion and trauma guidelines [10,11], and for assessment of
risk of deterioration of ward patients in medical eme r-
gency team (MET) systems [12-23]. We found in a recent
retrospective study that the MET calling criteria were
highly predictive of hospital outcome in patients admitted
to intensive care from the emergency department [24].
Most emergency departments, including ours, do not
* Correspondence:
1
Department of Intensive Care Medicine, Bern University Hospital and
University of Bern, Freiburgstrasse, 3010 Bern, Switzerland
Full list of author information is available at the end of the article
Merz et al. Critical Care 2011, 15:R25
/>© 2011 Merz et al.; licensee BioMed Central Ltd. This is an open access article distributed under the terms of the Creative Commons
Attribution License ( which permits unrestr icted use, distribution, and reproduction in
any medium, provided the original work is properly cite d.
systematically screen all patients [25]. Even if a scoring
system is used, the general concern about the patient ’s
condition, as perceived by the admitting nursing staff,
serves as a trigger to expedite evaluation by an emergency
physician [26,27].
The time interval until appropriate care is delivered
influences outcome in myocardial infarction, stroke, and
sepsis[28-32].Itisconceivablethatthisisalsothecase
for other groups of critically il l patients. One reason for
delayed and otherwise suboptimal care is the inability to
recognize signs of organ dysfunction early enough to
initiate the necessary therapeutic interventions [13,33,34].
The aim of this prospective observational study was to
assess the incidence of measurable vital sign abnormal-
ities at admission to the emergency department and the
potential impact of these factors on treatment delay and
outcome in a large group of unselect ed patients needing
hospital admission. We hypothesi sed that a scoring sys-
tem based on the established MET criteria might aid in
early recognition of patients at risk of an unf avourable
outcome.
Materials and methods
Setting
The study wa s performed in the Department of Intensive
Care Medicine and the Department of E mergency Medi-
cine of the Bern University Hospital, a 960-bed tertiary
care referral academic medical centre, in Bern, Switzer-
land. The emergency department provides initial evalua-
tion and treatment of all adult patients (age >15 years).
Patients and study design
This prospective cohort study includes all patients
admitted to our hospital via the emergency department
between 11 June 2007, and 11 January 2008. Data were
collected prospectively on study data c ollection forms
during the stay in the emergency department and entered
in a database created for the purpose of the study.
Patients treated on an outpatient basis were not included.
In cases where the data were not duplicated to the study
record form by the clinical staff, the research staff
extracted the data; the data collection sequence and p ro-
cedure by the clinical staff remained the same. Colle cted
data included patient demographics, time of emergency
department admission and discharge, time of first assess-
ment by a physician, and the primary cause of emergency
department admission (respiratory, cardiovascular, neu-
rological, trauma, gastrointestinal or other). The time
span between admission to the emergency department
and discharge was broken down into a series of time per-
iods (0 to 15 minutes, 15 minutes to 1 hour (h), 1 to 2 h,
2 to 4 h, followed by two-hour periods up to 24 h after
emerge ncy department admission) during which the pre-
sence of vital sign abnormality was investigated. Based on
published MET calling criteria [12,23] assessed para-
meters were respiratory rate, oxygen saturation, systolic
blood pressure, heart rate, Glasgow Coma Scale (GCS),
presence of a threatened airway an d occurrence of sei-
zures (Table 1). The available ED monitoring system pro-
vides values for oxygen saturation (pulse oxymetry),
systolic blood pressure (sphygmomanometer), heart rate
(electrocardiogram), and respiratory rate (constant cur-
rent impedance pneumography). Presence of a threa-
tened airway was defined as a necessity for intratracheal
suctioning, insertion of oro - or nasopharyngeal tubes,
intubation, bronchoscopy and occurrence of seizures as
repeated or prolonged (>five minutes) seizures. Occur-
rence of each of the seven potential vital sign abnormal-
ities (VSS criteria) was considered as one VSS point, and
the VSS score was defined as the total sum of all VSS
points in one time period. The original MET calling cri-
teria contain the criterion “concern”,whichwasnot
included in the VSS. “Concern” represents a subjective
rating rather than a measurable parameter and was
shown t o have a low frequency and lack of predictive
value in one retrospective study in emergency patients
[24]. To evaluate associations between VSS scores and
predefined outcome variables, t he follo wing definitions
were used: VSS
initial
denotes the VSS score in the first
15 minutes after admissio n to the emergency department
and VSS
max
denotes the maximum VSS score throughout
the total stay in the emergency department. Hence,
VSS
max
represents the highest sum of VSS criteria occur-
ring simultaneously.
Evaluated predictors and outcome measures
Occurrence of vital sign abnormality at emergency
department admission and during emergency depart-
ment stay as measured by VSS, time delay between
emergency department admission, and first assessment
Table 1 Vital Sign Scoring parameters
Airway
• threatened
airway:
necessity for intratracheal suctioning, insertion
of oro- or nasopharyngeal tubes, intubation,
bronchoscopy
Breathing
• respiratory rate: respiratory rate <6/minute or >36/minute
• oxygen
saturation:
SaO
2
<90% despite supplementary oxygen
Circulation
• systolic blood
pressure:
systolic blood pressure <90 mmHg
• heart rate: heart rate <40/minute or >140/minute
Neurology
• GCS: Glasgow Coma Scale (GCS) score <13
• seizures: repeated or prolonged (>5 minutes) seizures
Vital Sign Scoring parameters were based on medical emergency team calling
criteria, as defined by Buist et al. and Cretikos et al. [12,23].
Merz et al. Critical Care 2011, 15:R25
/>Page 2 of 9
by an em ergency physician, as well as the length of stay
in the emergency department, were evaluated predictors.
The primary outcome measure was hospital mortality;
this information was extracted from the hospital data-
base. Secondary outcome was the combined endpoint
ICU admission or death in ED. The combined endpoint
was chos en to account for the fact tha t dea th occurring
in the ED before discharge to the ICU was proportio-
nately more frequent in patients with high VSS than in
patients with low VSS.
Missing data: In cases where data on vital signs were
not entered in the study data collection forms, these
data were extracted from the ED patient charts or
anaesthesia charts. To analyze potential bias between
patients with missing data and the rest of the cohort,
age, hospital mortality and VSS scores of these patients
were compared with patient s whose complete data were
collected on the study forms.
Ethical approval and patient consent
The study was approved by the Ethical Committee of
the Canton of Bern, and adheres to the tenets of the
Declaration of Helsinki. The need for informed consent
was waived provided that purely observational data were
collected in conjunction with the normal clinical man-
agement. Nevertheless, all patients admitted to the Bern
University Hospital are routinely informed of their right
to specify whether data related to their stay can be used
in observational studies; data of patients who declined
were not included in the study.
Statistical analysis
The data were not normally distributed, and are pre-
sented as median and interquartile ranges. Comparison
of outcome groups defined on the basis of hospital
survival/non-survival was performed using the non-
parametric Mann-Whitney test or the Chi-square test,
as appropriate. Survival in differen t groups, defined by
the primary cause of emergency department admission,
was ana lyzed by applying categorical logistic regression.
The predictive value of VSS
initial
and VSS
max
, in relation
to hospital mortality was assessed by univariate logistic
regression. To assess survival differences throughout the
wholescorerangegroupsstratifiedbyVSSscoreswere
compared pair-wise using Pearson’s Chi square test.
Additionally, Kaplan-Meier survival plots were con-
structed and log rank and Chi-square tests were used to
compare survival in groups stratified by VSS
initial
and
VSS
max
. Subjects were censored at t he time of hospital
discharge. Additionally, receiver operating characteristic
(ROC) c urves were constructed and the area under the
curve (AUC) was calculated to assess the capability of
VSS
inital
to discriminate survivors from non-survivors.
TheprognosticsignificanceofanincreaseoftheVSS
score during the stay in the emergency department was
assessed in a multi variate logistic regression model
including VSS
initial
and the increase in VSS points
(VSS
max
-VSS
initial
) as predictors and hospital mortality
as outcome parameter. Pearson’s Chi-square test was
used to assess the value of single VSS criteria with
regard to hospital mortality. The r esults of the single
Chi-square tests were compared u sing Cramer’s
V ( values ranging from 0 to 1, with 0 = no association
between variables and 1 = complete association of vari-
ables). Forced entry multivariate logistic regression ana-
lysis, with all covariates into the regression model in
one block, was used to identify independent predictors
of mortality. The correlations between VSS
initial
scores,
the delay until the first assessment of an emergency
physician, and length of stay (LOS) in the emergency
depar tment and hospital mortality were assessed in uni-
variate and multivariate logistic regression models, as
indicated. The correlation between VSS
initial
and the
delay until the first assessment of an emergency physi-
cian was assessed using linear regression. In all anal yses
a P-va lue of 0.05 or less was consi dered statistically sig-
nificant. Statistical analyses were performed using the
software packages SPSS version 13.0 (SPSS, Inc., Chi-
cago, IL, USA) and GraphPad Prism version 4.02
(GraphPad Software, San Diego, CA, USA).
Results
Patient characteristics
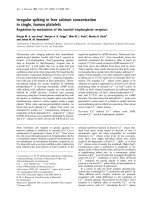
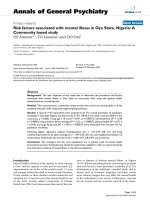
A total of 4,416 emergency hospital admissions through
the emergency department occurred during the s tudy
period. Data on 3,104 patients were collected and entered
into their study forms during their stay in the ED. In
1,284 patients, data had to be extracted from the ED
patient charts. In 28 patients (0.6%), study data on vital
sign abnormality were not available; these patients were
excluded from the analysis. Thus, a total of 4,388 patients
with an overall hospital mortality of 7.2% were s tudied
(Figure 1). Non-survivors were significantly older and
had higher VSS
initial
and VSS
max
scores than surviving
patients. The primary cause of e mergency department
admission was not correlated w ith hospital mortality.
Non-surviving patients had significantly shorter emer-
gency department and hospital le ngth of stay and were
assessed with less time delay by an emergency physician
(Table 2). Table 3 summarizes the number of patients
and hospital mortality per VSS
initial
and VSS
max
scores.
Survival analysis of VSS scoring
VSS
initial
and VSS
max
were both predictors of hospital
survival odds ratio (OR) 2.80, 95% confidence interval
(CI) 2.50 to 3.14, P <0.0001forVSS
initial
; OR 2.36, 95%
CI 2.15 to 2 .60, P < 0.0001 for VSS
max
). The prognostic
accuracy of VSS
initial
in predicting hospital outcome was
Merz et al. Critical Care 2011, 15:R25
/>Page 3 of 9
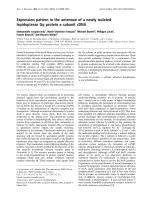
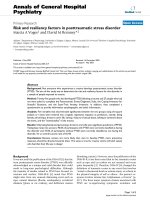
superior to VSS
max
(log rank Chi-square 468.1, P < 0.0001
for VSS
initial
;logrankChisquare361.5,P < 0.0001 for
VSS
max
)(Figures2and3).ForVSS
initial
,survivaldiffer-
ences were significant over the whol e score range except
for VSS
initial
3and4;forVSS
max
thedifferencebetween
scores 1 and 2 was not signif icant (Table 4). Vital sign
instabilities developed or increased in 516 patients while
in the emergency department (VSS
max
> VSS
initial
). These
patients had a higher mortality than patients in whom the
VSS score was highest at admission (OR 1.49, 95% CI 1.09
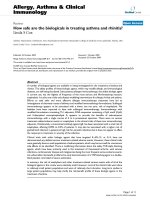
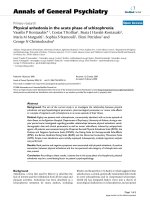
to 2.05, P = 0.015). Figure 4 shows the ROC curve for
VSS
initial
plotting sensitivity versus 1-specificity. The AUC
was 0.72 (95% CI 0.53 to 0.91, P < 0.0001), indicating a
moderately to highly predictive value of VS S
initial
in rela-
tion to hospital mortality.
Secondary endpoint ICU admission or death in ED
VSS
initial
was a significant predictor of the necessity of
ICU admission or death in the ED (OR 3.14, 95% CI
2.80 to 3.52, P < 0.000 1). The se condary endpoint was
reached by 14.9% of patients with a VSS
initial
of 0;
respective percentages for VSS
initial
1to≥4 were 33.7%,
67.7% 75.9% and 100%.
Prognostic significance of single VSS scoring criteria
Univariate analysis revealed that all VSS
initial
criteria
except for seizures were associated with hospital out-
come (Table 5). In the multivariate analysis the VSS cri-
teria GCS, systolic blood pressure and oxygen saturation
were the most significant independent outcome predic-
tors, followed by heart rate and threatened airway. The
criteria respiratory rate a nd seizures were not indepen-
dent predictors of hospital mortality (Table 6).
Correlations between scores, delay to first assessment
and LOS in the emergency department and hospital
mortality
The delay between emergency department admission
and the first assessment by an emergen cy physician was
not a predictor of hospital mortality in a univariate ana-
lysis (OR 0.99, 95% CI 0.94 to 1.04, P =0.69)orafter
correction for vital sign abnormalities at admission
(VSS
initial
) (OR 0.98, 95% CI 0.94 to 1 .04, P = 0.65).
Shorter LOS in the emergency d epartment was asso-
ciated with a higher hospital mortality (OR 0.95, 95% CI
0.92 to 0.98, P < 0.0 001). After correction for vital sign
abnormalities at admission (VSS
initial
), LOS in the
15939 patients assessed in the
emergency department
11523 patients treated ambulatory
28 patients with no vital signs
documentation excluded from
study
Data on 3104 patients
complete on study data
collection forms
Data of 1284 patients prospectively
collected on patient records, vital
signs data extracted to study data
collection forms
4388 patients analyzed
4416 hospital admissions via
emergency department included in
study
Figure 1 Study flow chart. Flow chart of patients included in
study.
Table 2 Patient characteristics in groups stratified by hospital outcome
All patients Hospital survivors Hospital non-survivors P-value
Number of patients 4,388 4,072 316
Age 61.0 (44.3 to 74.1) 60.3 (43.0 to 73.5) 69.6 (57.3 to 79.7) <0.0001
VSS
max
(points; median/IQR) 0 (0 to 1) 0 (0 to 0) 1 (0 to 2) <0.0001
VSS
initial
(points; median/IQR) 0 (0 to 0) 0 (0 to 0) 1 (0 to 2) <0.0001
Primary cause of emergency department admission (% of patients) 0.078
Respiratory 333(7.0) 295 (7.2) 38 (5.7)
Cardiovascular 633 (13.4) 558 (13.7) 75 23.7)
Neurological 895 (18.9) 832 (20.4) 63 (19.9)
Trauma 815 (17.2) 776 (19.1) 39 (12.3)
Gastrointestinal 607(12.8) 570 (14.0) 37 (11.7)
Other 1,105 (23.3) 1,041 (25.6) 64 (20.3)
delay first physician (hours; median/IQR) 0.17 (0.0 to 0.5) 0.17 (0 to 0.51) 0.08 (0 to 0.41) <0.0001
length of emergency department stay (hours; median/IQR) 4.6 (2.8 to 7.3) 4.6 (2.9 to 7.4) 4.1 (1.6 to 6.6) <0.0001
length of hospital stay (days; median/IQR) 6.3 (3.0 to 11.8) 6.5 (3.1 to 11.8) 3.4 (0.7 to 11.4) <0.0001
IQR, interquartile range; VSS, Vital Sign Score.
Merz et al. Critical Care 2011, 15:R25
/>Page 4 of 9
emergency department lost its predictive value for hos-
pital outcome (OR 0.99, 95% CI 0.96 to 1.01, P = 0.25).
Missing data
Patients with complete study form data were s lightly
younger (median age 59.7 vs 60.8, P = 0.009) but had
similar hospital mortality (7.0% vs. 7.3%; P =0.72)as
compared to patients whose data were extracted from
the patient records. There were no significant d iffer-
ences in the distribution of VSS
inital
groups (VSS
inital
0:
85.0% vs. 82.5%; VSS
inital
1: 7.03 vs. 12.54%, VSS
inital
2:
4.57 vs. 3.31%; VSS
inital
3: 1.97 vs. 1.11%; VSS
inital
≥4:
1.40% vs 0.48%; P = 0.29) between the two groups.
Discussion
The main finding of this study was that VSS scores
based on simple criteria to assess vital sign instability
within the first 15 minutes of admission to the emer-
gency department were highly predictive of hospital
mortality and necessity of ICU admission in a general
population o f emergency department patients. The VSS
allows for simple and rapid evaluation of patients imme-
diately after emergency department admission by the
first health care provider looking after the patient. It
may, therefore, facilitate the triage of patients in the
emergency department, help caregivers recognize those
patients requiring the most urgent attention, and help
to avoid delays in implementation of necessary organ
function support and commencement of treatment. The
sum of single vital sign instabilities is sufficient to obtain
the VSS, whereas other reported triage scores [7,35,36]
use weighted assessments of vital function parameters
and require time-consuming calculations and the use of
specific scoring tables. Even if this only takes a few min-
utes, it might preclude the routine use of these scores in
every patient. The prognostic accuracy of the VSS was
best if collected early after admission. Whereas VSS
initial
represents the patient’s condition before the start of
treatment, VSS
max
can represent a high score at ED
admission and decrease thereafter (positive reaction to
resuscitation efforts) or an increase from a lower score
(deterioration despite treatment). These two different
trends in the patient’s condition and reaction to treat-
ment potentially influence the patient’soutcomeand
might explain the difference in the prognostic power of
VSS
initial
and VSS
max
.
Our results emphasize that the presence, onset, or
worsening of vital sign instability in the course of the
emergency admission worsens hospital outcome. Not
just the initial VSS score but its change during the
emergency department stay is relevant: at the s ame
VSS
initial
level, patients with increasing VSS scores had
higher hosp ital mor tality than those with an unchanged
or decreased score in later assessments. We have no
data on whether these patients deteriorated despite
timely treatment or due to treatment delay.
Table 3 Number of patients and hospital mortality in groups stratified by VSS
initial
and VSS
max
scores
VSS
initial
VSS
max
Number of patients (%) Hospital mortality Number of patients (%) Hospital mortality
VSS 0 3,625 (82.6%) 3.9% 3,217 (73.3%) 3.6%
VSS 1 490 (11.2%) 13.9% 577 (13.1%) 11.6%
VSS 2 167 (3.8%) 25.1% 450 (10.3%) 13.1%
VSS 3 58 (1.3%) 43.1% 79 (1.8%) 36.7%
VSS ≥ 4 48 (1.1%) 79.2% 65 (1.5%) 69.2%
VSS, Vital Sign Score.
Figure 2 Hospi tal survival in the st rata of V SS
initial
groups.
Kaplan-Meier plot of hospital survival in the strata of VSS
initial
groups
(log rank Chi-square 468.1, P < 0.0001).
Figure 3 Hospital survival in the strata of VSS
max
groups.
Kaplan-Meier plot of hospital survival in the strata of VSS
max
groups
(log rank Chi square 361.5, P < 0.0001).
Merz et al. Critical Care 2011, 15:R25
/>Page 5 of 9
Despite the various physiological triage systems avail-
able to identify at-risk patients in t he emergency depart-
ment outcome studies applying these triage scoring
systems are scarce and available only in selected sub-
groups of emergency pat ients. The concept of adding up
the VSS criteria applied in t his study is analogous to the
use of the sum o f failing organs f or the calculation of
organ dysfunction scores in intensive care [37-39] and we
previously used a similar approach for patients admitted
to intensive care from the emergency department [24].
It is conceivable that the individual components of the
VSSscoremayhavedifferentrelevanceforthesubse-
quent clinical course. In the present study, impaired
levels of consciousness, hypotension, hypoxemia, and
abnormal heart rate were the strongest predictors of
mortality. In our previous study on p atients admitted to
intensive care from the emergency department, respira-
tory rate, decreased level of consciousness, hypoxemia,
hypotension, and abnormal heart rate within the first
hour in the emergency department were the strongest
predictors of mortality. In ward patients, bradypnea,
tachypnea, impaired consciousness, high heart rate, low
blood pressure, and high respiratory rate were predictors
of mortality [40]. Despite the d ifferent patient cohorts
and ranking of predictors, all these studies emphasize
the relevance of decreased levels of consciousness and
cardiovascular and respiratory instability as early predic-
tors of mortality risk.
The lack of independent predictive value for seizures
and respiratory rate may be r egarded as surprising. Sei-
zures have been associated with increased risk of sudden
death [41]. The 56 patients with seizures in this study
had a mortality of 8.9% (vs. 7.8% for the whole cohort).
It is conceivable that the simultaneous presence of other
VSS components (for example, hypoxemia and low
GCS) may have masked the independent predictive
value of seizures. The same can be assumed for re spira-
tory rate: it is likely to have occurred in conjunction
with hypoxemia, followed by immediate intubation.
The outcome of critically ill patients in the emergency
department can be ameliorated by rapid identification
and initiation of appropriate treatment. This is true of
ill patients in general [42] and in subgroups such as
septic shock [29], trauma [28], acute ischemic stroke
[32] and acute myocardial infarction [30]. Optimal man-
agement of patients who require advanced organ sup-
port seems to be of particular importance, and may
have a marked effect on eventual outcome [43,44]. The
VSS represents a simple scoring system that allows iden-
tification of at-risk patients within minutes after arrival.
Whether it facilitates rapid commencement of treatment
and improves the outcome of these patients is an unan-
swered question which should be a ddressed by future
research.
The main strength of our study is the use of well-
established criteria for the evaluation of vital sign
abnormalities to generate a simple scoring system, the
prognostic value of which was prospectively assessed in
patients admitted to the emergency department of a ter-
tiary referral hospital over a period of six months. The
analyzed sample size was large and repre sents a cohort
originating from a broad (adult) population covering the
whole spectrum of emergencies; all outcomes until hos-
pital discharge were available.
The main limitations of our study are related to the
single-centre design and the need to retrospectively
extract missing data from patient records. Focusing our
Table 4 Survival differences in patient groups stratified by VSS
initial
and VSS
max
scores
VSSinitial VSSmax
Chi-square OR 95% CI P Chi-square OR 95% CI P
VSS 0/1 94.31 4.10 3.03 to 5.54 <0.0001 65.7 3.45 2.54 to 4.77 <0.0001
VSS 1/2 11.32 2.11 1.38 to 3.23 0.0008 0.89 1.22 0.84 to 1.76 0.35
VSS 2/3 13.04 3.21 1.73 to 5.97 0.0003 23.23 3.63 2.14 to 6.17 <0.0001
VSS 3/4 0.01 1.029 0.48 to 2.22 0.94 8.90 2.95 1.50 to 5.81 0.0029
VSS, Vital Sign Score.
Figure 4 ROC curve for VSS
initial
. Receiver operating characteristic
curve for VSS
initial
in relation to hospital survival. The area under the
curve was 0.72 (95% CI 0.53 to 0.91, P < 0.0001).
Merz et al. Critical Care 2011, 15:R25
/>Page 6 of 9
study on hospital admissions and excluding patients trea-
ted on an outpatient basis could introduce a selection
bias for the study population, as the decision for admis-
sion or ambulatory treatment has not yet been made at
the time a pat ient presents at the ED. However, the m ain
outcome parameter of the study was hospital mortality,
which can only occur in patients admitted to the hospital.
Inclusion of study subjects who by definition cannot
reach the main endpoint of the study would confound
the results. Whether the VSS score can help to select
patients who can be treat ed as outpatients should be stu-
died separately. Our hospital serves as a primary care
centre for a large urban area as well as a tertiary care cen-
tre for specialized evaluation and treatment of a popula-
tion of approximat ely 1. 5 m illion. With regard to
structure and organisation our ins titution is comparab le
to other university hospitals in Switzerland and in other
countries. Despite the need to extract vital signs data
from the patient records in a substantial number of
patients, we are confident that this has not biased the
main results of the study. All the data needed for the VSS
were collected by the same staff as part of their routine
clinical work. In cases where the data were not duplicated
to the study record form by the clinica l staff the resear ch
staff extracted the data, the data collection sequence and
procedure by the clinical staff were the same. Only i n a
very small fraction of patients (28 patients) the data for
VSS were not available. Furthermore, we found no clini-
cally relevant di fferences between the characteristics or
outcomes in those patients where the vital sign data were
collected in both the study form and the patient records
vs those with data collected in the patient records only.
Finally, since the data were collected without actions to
alter the clinical routine, we have no reason to believe
that the patients would have been treated differently.
Inter-observer variation in the accuracy of data collec-
tion was not assessed. Determination of inter-observer
variation of all the involved health care professionals
would not have been possible due to t he limited study
resources. All ED staff had to attend lectures on how to
collect the required parameters correctly prior to the
study commencement. Parameters were strictly defined
and not study specific but part of the already implemented
routine clinical data collection. Most data originated from
automatic monitoring systems. Therefore, we do not
expect a significant bias by high inter-observer variation.
We consider the observed frequency of vital sign
instability as a minimum prevalence, since the vital signs
were recorded as part of the clinical routine. It is concei-
vable that the use of continuous monitoring technologies
and protocols triggering chan ges in routine monitoring
and treatment based on the observed abnormalities may
alter both the detection and occurrence rate of vital sign
abnormalities. Finally, only if the detection of vital sign
abnormalities triggers the correct intervention can an
improvement of outcome be expected. We suggest that
the VSS provides a pragmatic approach for structured
detection of outcome-relevant vital sign abnormalities
and a tool for interventional studies.
Conclusions
In t his prospective cohort study we found that in
patients admitted to the emergency departme nt, a score
Table 5 Frequency and results of Chi-square test of single VSS
initial
criteria
VSS
initial
parameter Frequency of single VSS criteria (% of all patients) Odds ratio Limits of 95% confidence
interval
Cramer’sV P-value
lower upper
threatened airway 159 (3.6%) 9.70 6.88 13.68 0.23 <0.0001
respiratory rate 80 (1.8%) 4.84 2.90 8.08 0.10 <0.0001
heart rate 154 (3.5%) 5.86 3.93 8.77 0.15 <0.0001
oxygen saturation 297 (6.8%) 4.61 3.41 6.21 0.16 <0.0001
systolic blood pressure 202 (4.6%) 10.96 8.04 14. 98 0.28 <0.0001
GCS score 262 (6%) 12.41 9.35 16.47 0.32 <0.0001
seizures 56 (1.3%) 0.0 0.0 0.0 0.01 0.99
GCS, Glasgow coma scale, VSS, Vital Sign Score. The results of Chi-square tests of single VSS
initial
criteria are given as odds ratio, Cramer’s V (degree of association
of single VSS criteria and hospital mortality; 0 denoting no association, 1 denoting maximum association) and significance value.
Table 6 Results of multivariate logistic regression of
individual VSS criteria
VSS
initial
parameter odds ratio limits of 95%
confidence interval
P-value
lower upper
Threatened airway 1.66 1.02 2.68 0.041
Respiratory rate 0.74 0.36 1.54 0.42
Heart rate 2.37 1.45 3.86 0.001
Oxygen saturation 2.91 2.02 4.20 <0.0001
Systolic blood pressure 3.88 2.62 5.75 <0.0001
GCS score 6.18 4.20 9.08 <0.0001
Seizures 0.83 0.31 2.26 0.83
GCS, Glasgow coma scale; VSS, Vital Sign Score. Results of multivariate logistic
regression of individual VSS criteria recorded in the first 15 minutes after
emergency department admission, identifying independent predictors given
as odds ratio, 95% confidence interval of odds ratio and significance value for
hospital mortality.
Merz et al. Critical Care 2011, 15:R25
/>Page 7 of 9
derived from readily available physiological parameters
registered during the first 15 minutes aft er admission
was strongly associated with the subsequent risk of
death.TheuseoftheVSSscoreintheemergency
department may help to design interventions for faster
and more systematic identification and treatment of
patients at risk of an unfavourable outcome and to
avoid delays in implementing organ function support.
Key messages
• A score (Vital Sign Scoring; VSS) derived from
simple criteria to assess vital sign instability within
the first 15 minutes of admission to the emergency
department is highly predictive of hospital mortality.
• The VSS allows for simple and rapid evaluation of
patients immediately after emergency department
admission by the first health care provider looking
after the patient.
• The use of the VSS in the emergency department
may help to design interventions for faster and more
systematic identification of patie nts at risk of an
unfavorable outcome.
• The VSS may help to avoid delays in treatment
and implementation of organ function support in
critically ill patients in the emergency department.
Abbreviations
CI: confidence interval; ED: emergency department; GCS: Glasgow Coma
Scale; LOS: length of stay; MET: medical emergency team; OR: odds ratio;
VSS: Vital Sign Scoring.
Acknowledgements
This work was supported by an Innovation Project grant from the Bern
University Hospital. Thanks go to the nursing staff and doctors from the
Department of Emergency Medicine, Bern University Hospital for their
invaluable help with the data collection and to Jeannie Wurz for editorial help.
Author details
1
Department of Intensive Care Medicine, Bern University Hospital and
University of Bern, Freiburgstrasse, 3010 Bern, Switzerland.
2
Department of
Emergency Medicine, Bern University Hospital and University of Bern,
Freiburgstrasse, 3010 Bern, Switzerland.
Authors’ contributions
TM, RE, LMe, LMa and JT participated in the design of the study. DB
designed the study database. RE, DB, LMe and LMa collected all data on ED
patients. TM and DB performed the statistical analysis. The manuscript was
drafted by TM, assisted by JW and JT. All authors read and revised the
manuscript drafts and approved the final manuscript.
Competing interests
The Department of Intensive Care Medicine has, or has had in the past,
research contracts with Abbott Nutrition International, B. Braun Medical AG,
CSEM SA, Edwards Lifesciences Services GmbH, Kenta Biotech Ltd, Maquet
Critical Care AB, Omnicare Clinical Research AG, and Orion Corporation; and
research and development/consulting contracts with Edwards Lifesciences
SA, Maquet Critical Care AB, and Nestlé. The money is/was paid into a
departmental fund; no author receives/received individual fees. These
contracts are unrelated to and did not influence the current study.
Received: 31 May 2010 Revised: 20 December 2010
Accepted: 18 January 2011 Published: 18 January 2011
References
1. Jones AE, Fitch MT, Kline JA: Operational performance of validated
physiologic scoring systems for predicting in-hospital mortality among
critically ill emergency department patients. Crit Care Med 2005,
33:974-978.
2. McQuillan P, Pilkington S, Allan A, Taylor B, Short A, Morgan G, Nielsen M,
Barrett D, Smith G, Collins CH: Confidential inquiry into quality of care
before admission to intensive care. BMJ 1998, 316:1853-1858.
3. Hillman KM, Bristow PJ, Chey T, Daffurn K, Jacques T, Norman SL, Bishop GF,
Simmons G: Antecedents to hospital deaths. Intern Med J 2001,
31:343-348.
4. Derlet RW, Richards JR: Overcrowding in the nation’s emergency
departments: complex causes and disturbing effects. Ann Emerg Med
2000, 35:63-68.
5. Lynn SG, Kellermann AL: Critical decision making: managing the
emergency department in an overcrowded hospital. Ann Emerg Med
1991, 20:287-292.
6. Subbe CP, Slater A, Menon D, Gemmell L: Validation of physiological
scoring systems in the accident and emergency department. Emerg Med
J 2006, 23:841-845.
7. Subbe CP, Kruger M, Rutherford P, Gemmel L: Validation of a modified
Early Warning Score in medical admissions. QJM 2001, 94:521-526.
8. Bertollo S, Rodenberg H: Correlation of the RTS (Revised Trauma Score)
and RAPS (Rapid Acute Physiology Score) in rotor-wing prehospital care.
Air Med J 1994, 13:91-95.
9. Rees JE, Mann C: Use of the patient at risk scores in the emergency
department: a preliminary study. Emerg Med J 2004, 21:698-699.
10. 2005 American Heart Association Guidelines for Cardiopulmonary
Resuscitation and Emergency Cardiovascular Care. Circulation 2005, 112:
IV1-203.
11. Advanced Trauma Life Support
®
for Doctors (ATLS
®
) Student Course Manual.
8 edition. Chicago American College of Surgeons Committee on Trauma;
2002.
12. Buist MD, Moore GE, Bernard SA, Waxman BP, Anderson JN, Nguyen TV:
Effects of a medical emergency team on reduction of incidence of and
mortality from unexpected cardiac arrests in hospital: preliminary study.
BMJ 2002, 324:387-390.
13. Bellomo R, Goldsmith D, Uchino S, Buckmaster J, Hart GK, Opdam H,
Silvester W, Doolan L, Gutteridge G: A prospective before-and-after trial of
a medical emergency team. Med J Aust 2003, 179:283-287.
14. Lee A, Bishop G, Hillman KM, Daffurn K: The Medical Emergency Team.
Anaesth Intensive Care 1995, 23:183-186.
15. Hillman K, Chen J, Cretikos M, Bellomo R, Brown D, Doig G, Finfer S,
Flabouris A: Introduction of the medical emergency team (MET) system:
a cluster-randomised controlled trial. Lancet 2005, 365:2091-2097.
16. Kenward G, Castle N, Hodgetts T, Shaikh L: Evaluation of a medical emergency
team one year a fter implementation. Resuscitation 2004, 61:257-263.
17. Bellomo R, Goldsmith D, Uchino S, Buckmaster J, Hart G, Opdam H,
Silvester W, Doolan L, Gutteridge G: Prospective controlled trial of effect
of medical emergency team on postoperative morbidity and mortality
rates. Crit Care Med 2004, 32:916-921.
18. Pittard AJ: Out of our reach? Assessing the impact of introducing a
critical care outreach service. Anaesthesia 2003, 58:882-885.
19. DeVita MA, Braithwaite RS, Mahidhara R, Stuart S, Foraida M, Simmons RL:
Use of medical emergency team responses to reduce hospital
cardiopulmonary arrests. Qual Saf Health Care 2004, 13:251-254.
20. Goldhill DR, Worthington L, Mulcahy A, Tarling M, Sumner A: The patient-
at-risk team: identifying and managing seriously ill ward patients.
Anaesthesia 1999, 54:853-860.
21. Bristow PJ, Hillman KM, Chey T, Daffurn K, Jacques TC, Norman SL,
Bishop GF, Simmons EG: Rates of in-hospital arrests, deaths and intensive
care admissions: the effect of a medical emergency team. Med J Aust
2000, 173:236-240.
22. Priestley G, Watson W, Rashidian A, Mozley C, Russell D, Wilson J, Cope J,
Hart D, Kay D, Cowley K, Pateraki J: Introducing Critical Care Outreach: a
ward-randomised trial of phased introduction in a general hospital.
Intensive Care Med 2004, 30:1398-1404.
23. Cretikos M, Parr M, Hillman K, Bishop G, Brown D, Daffurn K, Dinh H,
Francis N, Heath T, Hill G, Murphy J, Sanchez D, Santiano N, Young L:
Guidelines for the uniform reporting of data for Medical Emergency
Teams. Resuscitation 2006, 68:11-25.
Merz et al. Critical Care 2011, 15:R25
/>Page 8 of 9
24. Etter R, Ludwig R, Lersch F, Takala J, Merz TM: Early prognostic value of
the medical emergency team calling criteria in patients admitted to
intensive care from the emergency department. Crit Care Med 2008,
36:775-781.
25. Goransson KE, Ehrenberg A, Ehnfors M: Triage in emergency departments:
national survey. J Clin Nurs 2005, 14:1067-1074.
26. Patel VL, Gutnik LA, Karlin DR, Pusic M: Calibrating urgency: triage
decision-making in a pediatric emergency department. Adv Health Sci
Educ Theory Pract 2008, 13:503-520.
27. Gerdtz MF, Bucknall TK: Triage nurses’ cli nical decision making. An
observational study of urgency assessment. JAdvNurs2001,
35:550-561.
28. Nardi G, Riccioni L, Cerchiari E, De Blasio E, Gristina G, Oransky M,
Pall otta F, Ajmone-Cat C, Freni C, Trombetta S, Mega AM: [Impa ct of an
integrated treatment approach of the severely injured patients (ISS
=/> 16) on hospital mortality and quality of care]. Minerva Anestesiol
2002, 68:25-35.
29. Rivers E, Nguyen B, Havstad S, Ressler J, Muzzin A, Knoblich B, Peterson E,
Tomlanovich M: Early goal-directed therapy in the treatment of severe
sepsis and septic shock. N Engl J Med 2001, 345:1368-1377.
30. De Luca G, Suryapranata H, Ottervanger JP, Antman EM: Time delay to
treatment and mortality in primary angioplasty for acute myocardial
infarction: every minute of delay counts. Circulation 2004, 109:1223-1225.
31. Duke G, Green J, Briedis J: Survival of critically ill medical patients is time-
critical. Crit Care Resusc 2004, 6:261-267.
32. Tissue plasminogen activator for acute ischemic stroke. The National
Institute of Neurological Disorders and Stroke rt-PA Stroke Study Group.
N Engl J Med 1995, 333:1581-1587.
33. Goldhill DR, White SA, Sumner A: Physiological values and procedures in the
24 h before ICU admission from the ward. Anaesthesia 1999, 54:529-534.
34. Hillman KM, Bristow PJ, Chey T, Daffurn K, Jacques T, Norman SL, Bishop GF,
Simmons G: Duration of life-threatening antecedents prior to intensive
care admission. Intensive Care Med 2002, 28:1629-1634.
35. Groarke JD, Gallagher J, Stack J, Aftab A, Dwyer C, McGovern R, Courtney G:
Use of an admission early warning score to predict patient morbidity
and mortality and treatment success. Emerg Med J 2008, 25:803-806.
36. Rhee KJ, Fisher CJ Jr, Willitis NH: The Rapid Acute Physiology Score. Am J
Emerg Med 1987, 5:278-282.
37. Le Gall JR, Lemeshow S, Saulnier F: A new Simplified Acute Physiology
Score (SAPS II) based on a European/North American multicenter study.
Jama 1993, 270:2957-2963.
38. Knaus WA, Draper EA, Wagner DP, Zimmerman JE: APACHE II: a severity of
disease classification system. Crit Care Med 1985, 13:818-829.
39. Vincent JL, Moreno R, Takala J, Willatts S, De Mendonca A, Bruining H,
Reinhart CK, Suter PM, Thijs LG: The SOFA (Sepsis-related Organ Failure
Assessment) score to describe organ dysfunction/failure. On behalf of
the Working Group on Sepsis-Related Problems of the European Society
of Intensive Care Medicine. Intensive Care Med 1996, 22:707-710.
40. Buist M, Bernard S, Nguyen TV, Moore G, Anderson J: Association between
clinically abnormal observations and subsequent in-hospital mortality: a
prospective study. Resuscitation 2004, 62:137-141.
41. Nashef L, Brown S: Epilepsy and sudden death. Lancet 1996,
348:1324-1325.
42. Nguyen HB, Rivers EP, Havstad S, Knoblich B, Ressler JA, Muzzin AM,
Tomlanovich MC: Critical care in the emergency department: A
physiologic assessment and outcome evaluation. Acad Emerg Med 2000,
7:1354-1361.
43. Bion JF, Edlin SA, Ramsay G, McCabe S, Ledingham IM: Validation of a
prognostic score in critically ill patients undergoing transport. Br Med J
(Clin Res Ed) 1985, 291:432-434.
44. Dragsted L, Jorgensen J, Jensen NH, Bonsing E, Jacobsen E, Knaus WA,
Qvist J: Interhospital comparisons of patient outcome from intensive
care: importance of lead-time bias. Crit Care Med 1989, 17:418-422.
doi:10.1186/cc9972
Cite this article as: Merz et al.: Risk assessment in the first fifteen
minutes: a prospective cohort study of a simple physiological scoring
system in the emergency department. Critical Care 2011 15:R25.
Submit your next manuscript to BioMed Central
and take full advantage of:
• Convenient online submission
• Thorough peer review
• No space constraints or color figure charges
• Immediate publication on acceptance
• Inclusion in PubMed, CAS, Scopus and Google Scholar
• Research which is freely available for redistribution
Submit your manuscript at
www.biomedcentral.com/submit
Merz et al. Critical Care 2011, 15:R25
/>Page 9 of 9