Báo cáo y học: "Measurement of ventilation and cardiac related impedance changes with electrical impedance tomography" potx
Bạn đang xem bản rút gọn của tài liệu. Xem và tải ngay bản đầy đủ của tài liệu tại đây (1.61 MB, 9 trang )
RESEARCH Open Access
Measurement of ventilation and cardiac related
impedance changes with electrical impedance
tomography
Caroline A Grant
1,2*
, Trang Pham
1
, Judith Hough
1
, Thomas Riedel
1,3
, Christian Stocker
1
, Andreas Schibler
1
Abstract
Introduction: Electrical impedance tomography (EIT) has been shown to be able to distinguish both ventilation and
perfusion. With adequate filtering the regional distributions of both ventilation and perfusion and their relationships
could be analysed. Several methods of separation have been suggested previously, including breath holding,
electrocardiograph (ECG) gating and frequency filtering. Many of these methods require interventions inappropriate in a
clinical setting. This study therefore aims to extend a previously reported frequency filtering technique to a
spontaneously breathing cohort and assess the regional distributions of ventilation and perfusion and their relationship.
Methods: Ten healthy adults were measured during a breath hold and while spontaneously breathing in supine,
prone, left and right lateral positions. EIT data were analysed with and without filtering at the respiratory and heart
rate. Profiles of ventilation, perfusion and ventilation/perfusion related impedance change were generated and
regions of ventilation and pulmonary perfusion were identified and compared.
Results: Analysis of the filtration technique demonstrated its ability to separate the ventilation and cardiac related
impedance signals without negative impact. It was, therefore, deemed suitable for use in this spontaneously
breathing cohort.
Regional distributions of ventilation, perfusion and the combined ΔZ
V
/ΔZ
Q
were calculated along the gravity axis
and anatomically in each positi on. Along the gravity axis, gravity depe ndence was seen only in the lateral positions
in ventilation distribution, with the dependent lung being better ventilated regardless of position. This gravity
dependence was not seen in perfusion.
When looking anatomically, differences were only apparent in the lateral positions. The lateral position ventilation
distributions showed a difference in the left lung, with the right lung maintaining a similar distribution in both lateral
positions. This is likely caused by more pronounced anatomical changes in the left lung when changing positions.
Conclusions: The modified filtration technique was demonstrated to be effective in separating the ventilation and
perfusion signals in spontaneously breathing subjects. Gravity dependence was seen only in ventilation distribution
in the left lung in lateral positions, suggesting gravity based shifts in anatomical structures. Gravity dependence
was not seen in any perfusion distributions.
Introduction
Electrical Impedance Tomography (EIT) is an emerging
technique for bed-s ide assessment of ventilation distribu-
tion. It has been shown to be able to distinguish regional
distributions of both ventilation and perfusion [1,2].
Several methods have been suggested to separate these
signals, the simplest being breath holding to remove
respiratory changes [3], which also removes the ability
to assess cardio-pulmonary interaction. Alternatively
ECG gating and frequency filtering has been
suggested, which would allow acquisition of the perfu-
sion components of the EIT signal without respiratory
interference [4-6].
Recently, Frerichs et al. examined the distribution of
lung perfusion in mechanically ventilated a dults during
* Correspondence:
1
Paediatric Critical Care Research Group, Paediatric Intensive Care Unit, Mater
Children’s Hospital, 550 Stanley Street, South Brisbane, Queensland 4101,
Australia
Full list of author information is available at the end of the article
Grant et al. Critical Care 2011, 15:R37
/>© 2011 Grant et al.; licensee BioMed Central Ltd. This is an open access articl e distributed under the terms of the Creative Commons
Attribu tion License ( which permits unrestricted use, distribution, and reproduction in
any medium, provided the original work is properly cited.
bilateral and unilateral v entilation of the left and right
lungs [2]. They utilised a band pass filtering technique
and linear regression fit to establish functional regions
of interest (ROI), identifying two regions - the left and
right lung. This method appears sound in identifying
functional areas of lung tissue; however, subjects were
mechanically ventilated and the breath rate mani pulated
so as not to interfere with the frequency characte ristics
of the heart rate. While this may be feasible in some
mechanically ventilated subjects, on the whole it is not
practical clinically. It, therefore, remains to be seen
whether this method can be extended to a sponta-
neously breathing cohort.
Fagerberg et al. also examined perfusion using EIT and
calculated a V/Q ratio on anaesthetised piglets [1,7].
While highlighting the problems with differentiating venti-
lation and perfusion signals in EIT, they proposed instead
to circumvent the issue by recording perfusion during a
short apnoea. The breath-hold approach captures the car-
diac re lated impedance signal without the need for filter-
ing, but lacks the ability to measure the interactions
between ventilation and cardiac signals. While interesting,
again this is not exactly practical in a clinical setting.
In this study, therefore, it is aimed to extend Frerichs
functional filt ration method to spontaneously breathing
adults and assess the regional distributions of ventilation
and perfusion. By incorporating a breat h hold period,
similar to Fagerberg ’s apnoea, cardiac related impedance
changes can be easily identified and the impact of filter-
ing on ventilation/perfusion relationships better ana-
lysed. This study presents a stepwise approach,
extending previously suggested filtering techniques with
new methods to assess ventilation/perfusion relation-
ships using EIT.
Materials and methods
Ten healthy adults (21 to 52 years) were recruit ed from
the staff of the Paediat ric Intensive Care Unit at the
Mater Children’s Hospital, South Brisbane, Australia.
The study was approved by the Human Ethics Commit-
tee of the Mater Health Services and participant consent
was obtained.
The participants were to breathe normally for 30 s ec-
onds followed by breath holding for 30 seconds while in
a supine position. ECG data were recorded simulta-
neously for these measurements. EIT data were also
recorded for a period of 10 minutes of spontaneous
breathing in supine, prone, left- and right-lateral posi-
tions, from which a period of steady breathing (5 to 10
breaths) was used for analysis.
A Göttingen GoeMF II EIT tomograph (CareFusion,
San Diego, CA, USA) was used with a frame rate of 44
Hertz (Hz). EIT methodology has been extensively
described elsewhere [8-10]. EIT measures regional
impedance change using small current injections, 16
electrodes were placed around the chest at nipple level.
Dedicated software was used for data acquisition and
reconstruction of EIT images (MATLAB
®
7.7.0, The
Mathworks, Inc., Natick, MA, USA).
Analysis of filtering technique on cardiac related
impedance signal
A slightly modified version of Frerichs et al.’s [2,11] filtra-
tion technique was used to separate respiratory and perfu-
sion related impedance changes of the EIT signal. First,
regions within the EIT image identifiable as functional
lung (ROI
Lung
) were established. During spontaneous
breathing a Fast Fourier Transformation (previously
described [12]), was performed and a band pass frequency
filter applied to include the subject’s respiratory peak fre-
quency and its second harmonic (Figure 1). The lower
limit was set at two breaths/minute and the upper limit at
2.5 times the respiratory rate. ROI
Lung
was then defined as
any region in which the impedance signal was greater than
20% of the peak impedance signal [13].
The regions of functional lung tissue described by
ROI
Lung
were then outlined on the raw image during
the breath hold (unfiltered). A region of high impedance
change outside the ROI
Lung
was identified as ROI
Heart
.
Two measures of the coherence of two signals are the
slope of the linear regression fit between them (slope)
and t he phase angle (a). When a linear regression fit is
performed between two signals the slope of the li ne cre-
ated will be either positive (in phase behaviour) or nega-
tive (out of phase). The phase angle then describes the
temporal synchronicity of the two signals, and gives an
a in degrees (ranging from 0 to 360°) describing this dif-
ference. Phase angles in the range of 90 to 270° are
broadly regarded as being out of phase.
The established ROI
Lung
and ROI
Heart
signals were
analysed for slope and a under three circumstances: i)
During breath hold, unfiltered; ii) During breath hold,
band pass filtered to exclude respiratory signal and
include the perfusion signal (“HR filter” approximately
40 to 400/minute); iii) During spontaneous breathing,
HR filter (as in ii, approximately 40 to 400/minute).
The slope and a were calculated in each of these cases
across the four quarters of the image (anterior-left,
-right, posterior-left, -right) and are shown in Table 1.
The synchronicity of the band pass filtered signal in ii
and iii, with the recorded ECG signal was also examined.
Comparison of body position on ventilation and
perfusion distribution
With a region of functional lung determined (ROI
Lung
)
the application of various band pass filters was then
used to separate out the respiratory and perfusion
related impedance changes.
Grant et al. Critical Care 2011, 15:R37
/>Page 2 of 9
As used previ ousl y, a band pass filter surrounding the
respiratory rate (2/minute-2.5xRR) was used to extract
the respiratory impedance changes (ΔZ
V
), and a band
pass filter surrounding the heart rate, (HR filter)
(approximately 40 to 400/minute) w as used to extract
the perfusion related impedance changes (ΔZ
Q
).
These filters were applied to a period of steady breath-
ing (5 to 10 breaths) in each position (supine, prone, left
and right lateral).
Using these data, analyses were carried out on the
respiratory (ΔZ
V
)andperfusion(ΔZ
Q
) signals separately
and combined into a Δ Z
V
\ΔZ
Q
ratio on a pixel by pixel
basis. To calculate a ΔZ
V
\ΔZ
Q
thedatawerefirstnor-
malised (the ΔZ
Q
signal is several magnitudes smaller
than the ΔZ
V
signal). An image of the regional ΔZ
V
/ΔZ
Q
was generated by dividing the normalised ventilation
value by the normalised perfusion value for each pixel . In
this way the ΔZ
V
\ΔZ
Q
is not like a traditional VQ ratio
(c)
(d)
(b)
(a)
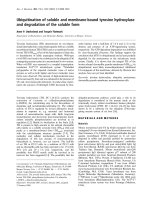
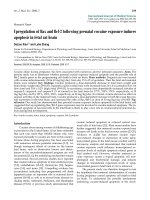
Figure 1 Filtering of the EIT signal. (a) Theoriginaltimecourseofimpedancechangeofa subject during spontaneous breathing with no
filtering applied. (b) The Fast Fourier Transform (FFT) power spectrum of this signal showing the frequency characteristics. The peak frequency
highlighted is the respiratory rate, band pass filtering for the respiratory rate was set from 2/minute to 2.5 times the respiratory rate - in this case
42/minute. The heart rate filtered data were extracted using a band pass filter above this rate, that is, 42 to 400/minute. (c) The standard deviation
image generated when filtering around the respiratory rate. (d) The standard deviation image generated when filtering around the heart rate.
Grant et al. Critical Care 2011, 15:R37
/>Page 3 of 9
but rather is a ratio of maximal ventilation to maximal
perfusion, with a value of 1 occurring in a region in
which the proportion of ventilation and perfusion are
matched, that is, ΔZ
Vmax
/ΔZ
Qmax
OR ΔZ
Vmin
/ΔZ
Qmin
.
The sum of the pixel values of ΔZ
V
, ΔZ
Q
and ΔZ
V
\ΔZ
Q
was calculated for dependent and non-dependent
lung regions (each comprising half the image) in each
position. Profiles of ΔZ
V
, ΔZ
Q
, and ΔZ
V
\ΔZ
Q
from right
to left and posterior to anterior in 32 slices were also
determined in each position [14,15].
Statistics
All results are presented as mean with confidence inter-
val (CI). A t wo-way ANOVA was used to compare the
slopes and phase angl es of the impedance sign al; during
ventilation vs. breath-hold and for filtered vs. non-fil-
tered. A one-way ANOVA was used to compare regional
diff erences for ventilation and cardiac related impedance
changes, both from depend ent to non-dependent regions
within positions, and between positions.
Results
Filtration technique
Examination of the slopes and a’s calculate d a cross the
lung during the breath hold with/without filteri ng and
during breathing with filtering allowed the effects of the
filtering technique on the perfusion signal to be quantified.
This analysis showed no significant effect on the perfusion
signal from either the filtering process or the presence of
the respiratory signal (P = ns, two-way-ANOVA). As seen
in Table 1 all ROI
Lung
regions showed inverse impedance
behaviour to ROI
Heart
with negative slopes and a between
152° and 181°.
Regional distribution of ventilation and perfusion
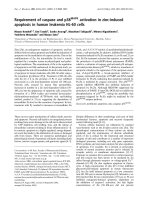
Figure 2 shows the sum of Δ Z
V
, ΔZ
Q
and the calculated
ΔZ
V
/ΔZ
Q
for the dependent and non-dependent lung in
all positions. Comparison within each position showed
signi ficant differences (P < 0.05) between the dependent
and non-dependent lung in ventilation distribution
(right lateral position) and in ΔZ
V
/ΔZ
Q
(prone and right
lateral positions).
Comparis on between positions showed significant dif-
ferences in the non-dependent lung in ventilation and
ΔZ
V
/ΔZ
Q
. In both cases prone and left lateral positions
were significantly higher (than supine and right lateral
respectively). The ΔZ
Q
distribution was not significantly
influenced by position.
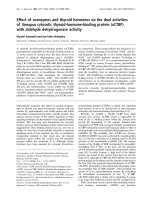
Figure 3 shows profiles of normalised ΔZ
V
, ΔZ
Q
and
ΔZ
V
/ΔZ
Q
in each position. Significant differences were
seen between positions - in ΔZ
V
distribution (lateral
positions) and in ΔZ
V
/ΔZ
Q
(lateral positions and prone/
supine). Significantly greater ventilation can be seen in
the left lung in the left lateral position.
The effect of these ΔZ
V
differences on the ΔZ
V
/ΔZ
Q
can also be seen with significant differences in both the
left and right regions of the chest with greater values
seen in the dependent region.
In pron e and supine positions the ΔZ
V
/ΔZ
Q
is higher
in the posterior regions of the lung. Prone position
results in higher values than supine across most of the
posterior slices, though the difference is only significant
in two of the more central slices.
Very little change was seen in the ΔZ
Q
profiles, with
those for the lateral positions being remarkably similar.
Discussion
Previous studies suggested either a breath-hold, or a sig-
nal filtering approach for separating the two sourc es of
impedance change [3]. The breath-hold approach cap-
tures the cardiac related impedance signal without the
need for f iltering, but lacks theabilitytomeasurethe
interactions between ventilation and cardiac signals. The
filtering approach is flawed by neglecting important
information on heart beat variability, and on cross-talk
between ventilation and heart rate signals by a potential
direct overlap of harmonics but all ows the inclusion of
phase information.
In this st udy, ventilat ion and perfusion data were suc-
cessfully separated out of the combined EIT signal and
Table 1 Phase angle a and slopes for perfused lung quadrants in comparison to ROI
Heart
while filtered around the
heart rate
Phase angle a (degrees) Slope of linear regression fit
Ant-R Ant-L Post-R Post-L Ant-R Ant-L Post-R Post-L
Breath hold period unfiltered Mean 181 152 180 153 -0.75 -0.53 -0.98 -0.44
CI 40 55 41 54 0.58 0.23 0.98 0.31
Breath hold period filtered Mean 159 152 159 157 -0.53 -0.45 -0.58 -0.36
CI 11 13 11 10 0.15 0.20 0.16 0.15
Spontaneous breathing filtered Mean 167 159 172 168 -0.50 -0.49 -0.50 -0.37
CI 7 11 8 7 0.09 0.16 0.10 0.12
All lung quadrants had phase angles close to 180 degrees and negative slopes indicating reversed ΔZ behaviour. Neither filtering of the impedance signal nor
respiration impacted on the slopes (P = ns, two-way-ANOVA). Ant L/R, anterior left/right; CI, confidence interval; Post L/R, posterior left/right.
Grant et al. Critical Care 2011, 15:R37
/>Page 4 of 9
analysed. The filtration technique used built on methods
described by Frerichs et al. and extended the technique
into a spontaneously breathing population in which
higher harmonics of ventilation would likely overlap and
swamp the cardiac signal [2]. It was shown that there
was no significant difference to the perfusion signal
introduced by the filtering technique during a breath
hold, or when filter ing out a ventilation signal. Making
the technique suitable for use on the spontaneously
breathing cohort as well as on patients in which the
ventilation rate cannot be adjusted or an apnoea
induced for the sake of gathering data.
ǻZQ
0
1
2
3
4
5
6
Non-dependent Dependent
sum rel. ǻ ZQ
Prone
Supine
0
1
2
3
4
5
6
Non-dependent Dependent
sum rel. ǻZQ
ǻZQ
Left lateral
Right lateral
ǻZV
0
1
2
3
4
5
6
Non-dependent Dependent
sum rel. ǻ ZV
Prone
Supine
#
ǻZV/ǻZQ
0
0.5
1
1.5
2
Non-de
p
endent De
p
endent
ǻ ZV
/
ǻ Z
Q
Prone
Supine
†
#
0
1
2
3
4
5
6
Non-dependent Dependent
sum rel. ǻZV
ǻZV
Left lateral
Right lateral
#
†
ǻZV/ǻZQ
0
0.5
1
1.5
2
Non-de
p
endent De
p
endent
ǻ ZV/ǻZQ
Left lateral
Right lateral
#
†
Figure 2 Sum of relative impedance change in depe ndent and non-dependent lung regions. The sum of ΔZ
Q
and ΔZ
V
and ΔZ
V
/ΔZ
Q
in
dependent and non-dependent regions for supine, prone, left and right lateral position (mean and confidence interval (CI)).
#
indicates a
significant difference between positions in the non-dependent lung and
†
indicates significant difference within the same position between
dependent and non-dependent lung (P < 0.05).
Grant et al. Critical Care 2011, 15:R37
/>Page 5 of 9
The validity of the cardiac related impedance signal
EIT measures regional changes in air volume and distri-
bution in the lung, for example, ventilation, with high
accuracy, but less is known of its capacity to measure
perfusion [2]. In a porcine model Fagerber g et al. mea-
suredstrokevolumewithapulmonaryarterycatheter
and compared it to pulse-synchronous impedance
changes measured with EIT [1]. The beat-to-beat pul-
monary perfusion was accurately measured with EIT
over a large range of stroke volumes.
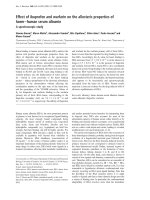
Visual analysis of the ROI
Lung
showed perfect alignment
of the cardiac related impedance changes with the ECG. A
significant phase lag between the ROI
Heart
and each ROI-
Lung
could be seen, thus demonstrating the time course of
blood moving away from the heart (Figure 4, Table 1).
It is uncertain as to what effec t the cardiac structures
have on the impedance signal [6]. It is possible that
mechanical i nteraction of the heart with the su rrounding
lung tissue is res ponsible for the changes in impedance,
rather than the pulsatile intrapulmonary blood volume.
Assuming that the pulsatile impedance signal within the
lung is caused by mechanical interaction only, then an
incr ease in the impedance signal would be expected dur-
ing systole as the lung expands while the heart contracts.
Our study showed the opposite. During heart contraction
the impedance of ROI
Heart
increased as a result of
reduced blood volume, that is, decreased conductivit y,
whilesimultaneouslytheimpedance value in the lung
decreased as a result of the increased blood volume in
the lung, that is, increased conductivity. The calculated
slopes of ROI
Lung
were negative demo nstrating tha t
impedance changes were caused by pulsatile blood
volume. The calculated phase angles showed a significant
phase lag between ROI
Heart
and ROI
Lung
, which supports
the motion that the pulsatile impedance changes may
represent perfusion.
The same phase relationship between ROI
Heart
and
ROI
Lung
during breathing and breath-hold was found.
ǻZV
0
0.1
0.2
0.3
0.4
0.5
0.6
0.7
135791113151719212325272931
Posterior Anterior
normalised ǻZV
Prone
Supine
ǻZV
0
0.1
0.2
0.3
0.4
0.5
0.6
0.7
0.8
1 3 5 7 9 1113151719212325272931
Right Left
normalised ǻZV
Le
f
t lateral
Right lateral
ǻZQ
0
0.1
0.2
0.3
0.4
0.5
0.6
0.7
1 3 5 7 9 11 13 15 17 19 21 23 25 27 29 31
Posterior Anterior
normalised ǻZQ
Prone
Supine
ǻZQ
0
0.1
0.2
0.3
0.4
0.5
0.6
0.7
1 3 5 7 9 11 13 15 17 19 21 23 25 27 29 31
Right Left
normalised ǻZQ
Left lateral
Right lateral
ǻZV /ǻZQ
0
0.5
1
1.5
2
2.5
3
1 3 5 7 9 1113151719212325272931
Posterior Anterior
normalised ǻZV/ǻZQ
Prone
Supine
ǻZV/ǻZQ
0
0.5
1
1.5
2
2.5
3
3.5
1 3 5 7 9 1113151719212325272931
Right Left
normalised ǻZV/ǻZQ
Left lateral
Right lateral
Figure 3 Profiles of normalised impedance change along the gravity axis . Profiles of the sum of normalised impedance change across the
lung. The horizontal axis of each plot shows the slice or pixel row/column number from posterior to anterior or right to left in each position.
The upper two plots show the distribution of ΔZ
V
, the central two the distribution of ΔZ
Q
and the lower two the distribution of ΔZ
V
\ΔZ
Q
.A
significant difference between the two positions within a region is indicated with a *.
Grant et al. Critical Care 2011, 15:R37
/>Page 6 of 9
Hence, we demonstrated that filtering did not impact on
the phase shift of the cardiac related impedance signal
within the lungs (Table 1).
Ventilation distribution
Previous studies have shown ventilation distributed pre-
ferentially towards the depend ent lung and attributed
this to gravity [18]. While this may be the case in
upright positions it remains to be seen if gravity still
plays a role when horizontal.
The profiles of ΔZ
V
showninFigure3infactshowa
lack of gravity dependence in supine/prone positions,
with the two profiles being virtually identical. The pro-
files from the lateral positions do, however, show a dif-
ference, with greater ventilation in the left lung in left
lateral position, though only a slight change in the dis-
tribution to the right lung rather than the complete shift
gravity dependence might imply.
If gravity h ad an effect on the air flow itself these find-
ings would make no sense, reversing patterns would be
seen betw een po sitions. Instead it ca n b e infer red f rom
these plots that gravity plays a role in ventilation distribu-
tion across the chest through its effect on anatomy.
Anatomically there is very little change in the chest
from prone to supine positions, as evidenced by the
similarity in the profiles. When changing lateral posi-
tions how ever large changes in anatomy occur with the
shift of gravity direction. As the heart is already in the
left side of the chest its impact on ventilation in left lat-
eral position is minimised. Ventilation distribution is
compromised in right lateral position however as gravity
causes a shift in the position of mediastinal organs.
Perfusion distribution
If gravity plays a role in blood volume, regions of the lung
at the same height (iso-heights) should have similar blood
volume. Similar to ΔZ
V
, gravity had little effect on ΔZ
Q
distribution, and the profiles showed no significant regional
differences ( Figure 3). This agree s with a previous study
using injected microspheres in dogs, showing considerable
blood volume heterogeneities within iso-height planes [16].
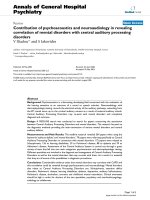
Figure 4 Heart rate filtered data with ECG trace. Filli ng Capacity Imag e and superim posed relative impedanc e change trace taken while
filtered at the heart rate range. The heart (ROI-Heart) is seen in red at the top of the filling capacity image and its time course is traced in red.
The blue regions and time course are that of the perfused lung (ROI-Lung). The simultaneously sampled ECG trace is shown on top of the
impedance time course for comparison.
Grant et al. Critical Care 2011, 15:R37
/>Page 7 of 9
ΔZ
V
/ΔZ
Q
distribution
Unlike traditional VQ which relates ventilation and per-
fusion rates in L/minute the ΔZ
V
/ΔZ
Q
compares the
amplitude of impedance change after normalisation of
the two signals. A ΔZ
V
/ΔZ
Q
of 1 does n ot imply that
the components have the same magnitude change, but
rather that the proportion of ventilation and perfusion
are matched, that is, ΔZ
Vmax
/ΔZ
Qmax
OR ΔZ
Vmin
/
ΔZ
Qmin
. Although only relative changes can be detected,
this approach allows investigation of the impact of gravi-
tational factors on ventilation and cardiac related ΔZ.
As would be expected from the v entilation and pe rfu-
sion distributions there is littledifferencebetween
supine and prone positions. Across the central to pos-
terior portions of the lung supine position in particular
has a very consistent relati onship of around 1.2 to 1.4.
The values in prone position tend to be higher (1.5 to
1.9) across this portion of the chest though the differ-
ences are generally not significant; significance is only
reached in two of the central regions as a by-product of
a non-significant drop in perfusion in these regions.
The distribution across the chest in lateral positions is
however quite different. Significant differences can be seen
between left and right lateral positions in both the left and
right regions of the ches t. This is to be expected because
of the gravity dependant changes in ventilation, and lack
of gravity dependence in perfusion distribution. H ad the
perfusion dis tribut ion shown a similar patt ern of gravity
dependence to the ventilation distributio n the ΔZ
V
/ΔZ
Q
would have been more consistent across the lung as is
seen in supine and prone positions (where neither ventila-
tion nor perfusion show gravitational effects).
Instead the ΔZ
V
/ΔZ
Q
pattern follows the ventilation
distribution pattern with each position significantly
higher in its dependent lung (that is, left lung in left lat-
eral). Again the values across the central regions of the
lung tend to be high (up to 2.3) in the dependent lung
in each case.
As a value of 1 in this ΔZ
V
/ΔZ
Q
calculation is a
matching of comparative amplitude the high values seen
across the lung in all positions suggests a greater or
broader distribut ion of ventilation than perfusion across
the lung, that is, m ore pixels in the higher ranges of
ventilation than perfusion. This suggests that perhaps a
simple normalisation of the signals is not the most
appropriate technique for making the two signals com-
parative, but that further parameters such as the stan-
dard deviation of the values also may need to be
considered.
Limitations
The measurement of ventilation and p erfusion with EIT
will remain a complex task. The interaction of these two
physiological events will impact on the accuracy of
impedance measurements, which are only surrogates for
true ventilation and perfusion. ΔZ
V
/ΔZ
Q
of different
lung regions were assessed by normalising the impe-
dan ce signals of respiration and lung perfusion. A ΔZ
V
/
ΔZ
Q
of 1 does not imply that both components of the
relationship have the same flow rate but that they share
the same quantitative relationship to the maximal ampli-
tude of measured impedance in the specific frequency
range.
Gravity dependent changes in ΔZ
V
/ΔZ
Q
could b e
demonstrated (particularly in lateral positions), similar
to those found using other measurement techniques
with greater spatial resolution such as electron-beam
CT [17] or radio- labelled tracers [18]. It is acknowl-
edged that no direc t reference method has been used to
compare the lung perfusion signal, but the use of any
other imaging technique with x-rays or radio-lab elled
tracers has been denied by our ethical standards. Other
filtering techniques using dynamic frequency filtering
could furt her improve the separation of the ventilation
and perfusion signals and therefore improve the ΔZ
V
/
ΔZ
Q
[19]. Precise reg ional assessment of ventilation and
cardiac related impedan ce changes are further compli-
cated by the low resolution and interregional blurring
effect of EIT. The propo sed ROI definition of our study
will not identify atelectatic regions as lung tissue and
these areas cannot be analysed.
The use of the term ‘perfusion’ for this heart rate syn-
chronous impedance signal is an area of some conten-
tion. Frerichs et al. [3] have also described this signal as
perfusion and present further data supp orting this ter-
minology. It is, however, acknowledged that there may
be other factors involved such as the mechanical trans-
mission of pressure waves onto the surrounding tissue
from the heart beating. The impedance signal generated
by this mechanical interaction, however, would have a
distribution which diminishes with distance from the
heart, much like a stone in a pond causing ripples. This
is not the pattern of impedance distribution that is seen
at this frequency range.
Conclusions
Inthisstudyweexaminedpreviouslyusedfiltration
techniques and extended and adapted them to a sponta-
neously breathing healthy adult cohort. Examination of
the effects of the filtration process determined that the
method described was suitable for filtering an d separat-
ing regional ventilation and perfusion related impeda nce
changes.
The regional distributions of ΔZ
V
, ΔZ
Q
and ΔZ
V
/ΔZ
Q
were examined in supine, prone, left- and right-lateral
positions, and the effects of gravity determined. Signifi-
cant gravity dependence was not seen in any position.
Gravity dependence was only seen in ΔZ
V
in lateral
positions, likely caused by the shift in mediastinal
Grant et al. Critical Care 2011, 15:R37
/>Page 8 of 9
structures. ΔZ
V
/ΔZ
Q
distribution s were above one for
non-peripheral regions of the lung in all positions. In
supine and prone position the ΔZ
V
/ΔZ
Q
was quite con-
sistent across the lung regions whereas the lateral posi-
tions showed significantly higher values in the respective
dependent regions.
Key messages
• It is possible to distinguish between lung ventila-
tion a nd perfusion using Electrica l Impedance
Tomography (EIT).
• A modified filtration technique can effectively
separate respiratory and perfusion related impedance
changes of the EIT signal in spontaneously breathing
subjects.
• Gravity dependence was not seen in any p erfusi on
distributions in spontaneously breathing adults.
Abbreviations
ANOVA: analysis of variance; CI: confidence interval; CT: computed
tomography; ECG: electrocardio graph; EIT: electrical impedance
tomography; HR: heart rate; HZ: hertz; ROI: region of interest (lung or heart);
ΔZ: impedance change; ΔZ
V
/ΔZ
Q
: ventilation impedance change divided by
cardiac impedance change.
Acknowledgements
This study was financed through an internal research fund. No external
sources of funding were obtained.
Author details
1
Paediatric Critical Care Research Group, Paediatric Intensive Care Unit, Mater
Children’s Hospital, 550 Stanley Street, South Brisbane, Queensland 4101,
Australia.
2
Institute of Health and Biomedical Innovation, Queensland
University of Technology, 96/110 Victoria Park Road, Kelvin Grove,
Queensland 4059, Australia.
3
Paediatric and Neonatal Intensive Care,
Department of Paediatrics, Inselspital, University Children’s Hospital,University
of Bern, CH-3010 Bern, Switzerland.
Authors’ contributions
CG assisted with study design, data processing, analysis and interpretation,
and drafting the manuscript. TP assisted with data collection, software
engineering, and data processing. JH assisted with participant recruitment,
data collection, data interpretation, and drafting the manuscript. CS assisted
with study design and data interpretation. TR and AS assisted with study
design, data interpretation, and drafting the manuscript. All authors read
and approved the final manuscript.
Competing interests
The authors declare that they have no competing interests.
Received: 18 February 2010 Revised: 3 November 2010
Accepted: 25 January 2011 Published: 25 January 2011
References
1. Fagerberg A, Stenqvist O, Aneman A: Monitoring pulmonary perfusion by
electrical impedance tomography: an evaluation in a pig model. Acta
Anaesthesiol Scand 2009, 53:152-158.
2. Frerichs I, Pulletz S, Elke G, Reifferscheid F, Schadler D, Scholz J, Weiler N:
Assessment of changes in distribution of lung perfusion by electrical
impedance tomography. Respiration 2009, 77:282-291.
3. Frerichs I, Hinz J, Herrmann P, Weisser G, Hahn G, Quintel M, Hellige G:
Regional lung perfusion as determined by electrical impedance
tomography in comparison with electron beam CT imaging. IEEE
Transactions on Medical Imaging 2002, 21:646-652.
4. Patterson RP, Zhang J, Mason LI, Jerosch-Herold M: Variability in the
cardiac EIT image as a function of electrode position, lung volume and
body position. Physiological Measurement 2001, 22:159-166.
5. Vonk Noordegraaf A, Kunst PW, Janse A, Marcus JT, Postmus PE, Faes TJ, de
Vries PM: Pulmonary perfusion measured by means of electrical
impedance tomography. Physiological Measurement 1998, 19:263-273.
6. Vonk-Noordegraaf A, Janse A, Marcus JT, Bronzwaer JG, Postmust PE,
Faes TJ, De Vries PM: Determination of stroke volume by means of
electrical impedance tomography. Physiological Measurement 2000,
21:285-293.
7. Fagerberg A, Stenqvist O, Aneman A: Electrical impedance tomography
applied to assess matching of pulmonary ventilation and perfusion in a
porcine experimental model. Critical Care 2009, 13:R34.
8. Bodenstein M, David M, Markstaller K: Principles of electrical impedance
tomography and its clinical application. Crit Care Med 2009, 37:713-724.
9. Frerichs I, Dargaville PA, Dudykevych T, Rimensberger PC: Electrical
impedance tomography: a method for monitoring regional lung
aeration and tidal volume distribution? Intensive Care Medicine 2003,
29:2312-2316.
10. Hahn G, Dudykevych T, Frerichs I, Hellige G: EIT System for clinical and
space applications. Proceedings of the 2nd European Medical and Biological
Engineering Conference: December 4-8, 2002, Vienna, Austria, IFMBE
Proceedings Series 3 110-111.
11. Carlisle HR, Armstrong RK, Davis PG, Schibler A, Frerichs I, Tingay DG:
Regional distribution of blood volume within the preterm infant thorax
during synchronised mechanical ventilation. Intensive Care Medicine 2010,
36:2101-2108.
12. Dunlop S, Hough J, Riedel T, Fraser JF, Dunster K, Schibler A: Electrical
impedance tomography in extremely prematurely born infants and
during high frequency oscillatory ventilation analyzed in the frequency
domain. Physiological Measurement 2006, 27:1151-1165.
13. Pulletz S, van Genderingen HR, Schmitz G, Zick G, Schadler D, Scholz J,
Weiler N, Frerichs I: Comparison of different methods to define regions of
interest for evaluation of regional lung ventilation by EIT. Physiological
Measurement 2006, 27:S115-127.
14. Riedel T, Fraser JF, Dunster K, Fitzgibbon J, Schibler A: Effect of smoke
inhalation on viscoelastic properties and ventilation distribution in
sheep. Journal of Applied Physiology 2006, 101:763-770.
15. Riedel T, Richards T, Schibler A: The value of electrical impedance
tomography in assessing the effect of body position and positive airway
pressures on regional lung ventilation in spontaneously breathing
subjects. Intensive Care Medicine 2005, 31:1522-1528.
16. Glenny RW, Bernard S, Robertson HT, Hlastala MP: Gravity is an important
but secondary determinant of regional pulmonary blood flow in upright
primates. J Appl Physiol 1999, 86:623-632.
17. Jones AT, Hansell DM, Evans TW: Pulmonary perfusion in supine and
prone positions: an electron-beam computed tomography study. J Appl
Physiol 2001, 90:1342-1348.
18. Amis TC, Jones HA, Hughes JM: Effect of posture on inter-regional
distribution of pulmonary perfusion and VA/Q ratios in man. Respiration
Physiology 1984, 56:169-182.
19. Deibele JM, Luepschen H, Leonhardt S: Dynamic separation of pulmonary
and cardiac changes in electrical impedance tomography. Physiological
Measurement 2008, 29:S1-14.
doi:10.1186/cc9985
Cite this article as: Grant et al.: Measurement of ventilation and cardiac
related impedance changes with electrical impedance tomography.
Critical Care 2011 15:R37.
Grant et al. Critical Care 2011, 15:R37
/>Page 9 of 9