Báo cáo y học: "A global view of gene expression in lithium and zinc treated sea urchin embryos: new components of gene regulatory network" pot
Bạn đang xem bản rút gọn của tài liệu. Xem và tải ngay bản đầy đủ của tài liệu tại đây (4.35 MB, 18 trang )
Open Access
Volume
et al.
Poustka
2007 8, Issue 5, Article R85
Research
Albert J Poustka*, Alexander Kühn*, Detlef Groth*, Vesna Weise*,
Shunsuke Yaguchi†‡, Robert D Burke†, Ralf Herwig*, Hans Lehrach* and
Georgia Panopoulou*
reviews
Addresses: *Max-Planck Institut für Molekulare Genetik, Evolution and Development Group, Ihnestrasse 73, 14195 Berlin, Germany.
†University of Victoria, Departments of Biology and Biochemistry/Microbiology, 3800 Finnerty Road, Victoria, British Columbia, Canada V8P
5C5. ‡US National Institutes of Health, National Institute of Dental and Craniofacial Research, 30 Convent Drive, MSC 4326, Bethesda.
Maryland 20815, USA.
comment
A global view of gene expression in lithium and zinc treated sea
urchin embryos: new components of gene regulatory networks
Correspondence: Albert J Poustka. Email:
Published: 16 May 2007
The electronic version of this article is the complete one and can be
found online at />
Abstract
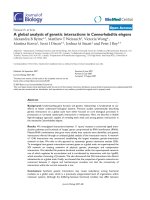
Background: The genome of the sea urchin Strongylocentrotus purpuratus has recently been
sequenced because it is a major model system for the study of gene regulatory networks.
Embryonic expression patterns for most genes are unknown, however.
information
Genome Biology 2007, 8:R85
interactions
Conclusion: Our work provides tissue-specific expression patterns for a large fraction of the sea
urchin genes that have not yet been included in existing regulatory networks and await functional
integration. Furthermore, we noted neuron-inducing activity of zinc on embryonic development;
this is the first observation of such activity in any organism.
refereed research
Results: Using large-scale screens on arrays carrying 50% to 70% of all genes, we identified novel
territory-specific markers. Our strategy was based on computational selection of genes that are
differentially expressed in lithium-treated embryos, which form excess endomesoderm, and in zinctreated embryos, in which endomesoderm specification is blocked. Whole-mount in situ
hybridization (WISH) analysis of 700 genes indicates that the apical organ region is eliminated in
lithium-treated embryos. Conversely, apical and specifically neural markers are expressed more
broadly in zinc-treated embryos, whereas endomesoderm signaling is severely reduced. Strikingly,
the number of serotonergic neurons is amplified by at least tenfold in zinc-treated embryos. WISH
analysis further indicates that there is crosstalk between the Wnt (wingless int), Notch, and
fibroblast growth factor signaling pathways in secondary mesoderm cell specification and
differentiation, similar to signaling cascades that function during development of presomitic
mesoderm in mouse embryogenesis. We provide differential expression data for more than 4,000
genes and WISH patterns of more than 250 genes, and more than 2,400 annotated WISH images.
deposited research
© 2007 Poustka et al.; licensee BioMed Central Ltd.
This is an open access article distributed under the terms of the Creative Commons Attribution License ( which
permits unrestricted use, distribution, and reproduction in any medium, provided the original work is properly cited.
genes that embryonic expression patterns
Novel are differentially expressed is blocked.
embryos, which form an excess of endomesoderm, identified using screens forSea urchinterritory-specific markers from the sea urchin <it>Strongylocentrotus purpuratus </it>have beenand in zinc-treated embryos,
in which endomesoderm specification in lithium-treated
reports
Received: 15 January 2007
Revised: 12 April 2007
Accepted: 16 May 2007
Genome Biology 2007, 8:R85 (doi:10.1186/gb-2007-8-5-r85)
R85.2 Genome Biology 2007,
Volume 8, Issue 5, Article R85
Poustka et al.
Background
Body plan development is controlled by large gene regulatory
networks (GRNs). Such networks consist of components that
accurately specify cell fate at defined times during development via their physical interaction, or in the case of transcription factors via their binding to cis-regulatory DNA elements.
One of the best studied developmental GRNs is the sea urchin
endomesoderm GRN, which includes almost 50 genes [1,2].
These genes were uncovered in part through three array
screens: a subtractive screen, in which RNA from lithiumtreated embryos was subtracted with RNA isolated from cadherin injected embryos [3]; a Brachyury target gene screen
[4]; and a screen for pigment cell-specific genes [5]. Comparison of the endoderm network between vertebrates (mouse,
xenopus, and zebrafish) showed that many components have
been conserved. Common key zygotic factors are the Nodalrelated transforming growth factor-β ligands, the Mixlike
(paired box) family of homeodomain transcription factors,
the Gata4/Gata5/Gata6 zinc-finger transcription factors and
the HMG box transcription factor Sox17 [6-10]. Orthologs of
some of these genes are components of the sea urchin
endomesoderm GRN. Examples include SpGataE and SpGataC (orthologs of Gata4/Gata5/Gata6 and Gata1/Gata2/
Gata3, respectively), SpFoxA (ortholog of FoxA1 [HNF3b],
which in Xenopus is a target of Mixer), and SpOtx (ortholog
of Otx2, which in Xenopus is induced by Sox17). However,
comparison of the vertebrate and sea urchin endomesoderm
network also reveals that many sea urchin orthologs of vertebrate endomesoderm genes are absent from the respective
sea urchin GRN.
This could be due to the fact that the existing sea urchin
endomesoderm GRN is built progressively, starting from
genes found to be regulated in the initial screens; this raises
the possibility that nodes of the endomesoderm network that
are not affected by the above subtractive hybridizations have
not yet been explored. In addition, some genes employed in
the sea urchin endomesoderm GRN are apparently absent
from vertebrate endomesoderm GRNs. The aim of this study
is to identify additional genes that are associated with developmental patterning, primarily focusing on endomesoderm
specific genes but also on genes that are involved in ectoderm
differentiation and patterning. We then add these genes to
the existing GRNs or create novel GRNs that describe sea
urchin embryonic development.
The early sea urchin embryo develops two primary axes: the
animal-vegetal axis and the oral-aboral axis. Most of the
endodermal and mesodermal cells are derived from the vegetal half, whereas the animal cells contribute to neural and
non-neural ectodermal territories. During gastrulation the
ectoderm is divided into an oral side, which flattens and is the
site where the mouth secondarily breaks through, and a
rounded aboral side, which is seperated by the ciliary band
region.
/>
Activation of the sea urchin endomesoderm GRN is initiated
at the molecular level as a result of nuclearization of β-catenin
initially in the vegetal micromeres (at the fourth cleavage)
and subsequently in the macromeres and their progenitor
blastomeres veg2 and part of veg1. The nuclearization of βcatenin in the micromeres at the 16-cell stage is also the earliest molecular evidence of an animal-vegetal axis in Strongylocentrotus purpuratus [11-14].
Reagents exist for manipulation of the GRNs that specify the
embryonic axis. Lithium chloride acts as a vegetalizing (posteriorizing) agent by directly binding glycogen synthase
kinase-3β, thus freeing up β-catenin, which then enters the
nucleus and activates target genes via a complex with Tcf/Lef
[14] (Figure 1 shows a sketch of the resulting axis perturbations). As result of the vegetalization, the endomesodermal
domain is expanded at the expense of ectodermal territories.
A recent study suggested that lithium chloride treatment
induces an increase in endoderm at the expense of the ectoderm, but without alterating the mesodermal territories,
because the expression domain of Frizzled5/8 at the animal
pole is eliminated whereas its expression at the secondary
mesenchyme cells (SMCs) is not affected [15]. Furthermore,
recent evidence based on study of Nodal suggests that lithium
chloride also intervenes with the oral-aboral axis of the
embryo, because the region expressing the oral marker Nodal
is reduced and shifted to the animal side [16], which is consistent with the conversion of part of the ectoderm to endoderm. Oral-aboral axis is established before the sixth cleavage
and is dependant on signals from the vegetal pole [16,17].
Complementary to lithium treatment, zinc treatment animalizes (anteriorizes) the embryos and leads to embryos with no
or reduced endomesodermal cells [18-20].
Using these reagents we conducted separate array hybridizations of lithium chloride or zinc sulfate treated and normal
embryos. Because lithium vegetalizes and zinc complementarily animalizes embryos, we would expect endomesodermspecific genes to be upregulated in embryos treated with lithium and downregulated in embryos treated with zinc sulfate,
whereas ectoderm-specific genes should exhibit the opposite
pattern.
Hybridizations were carried out on nonredundant arrays that
correspond to 50% to 70% of all sea urchin genes [21]. In our
experimental design we have used repetitions of experiments
in order to calculate sensitivity as a factor of reproducibility.
We deliberately did not amplify or subtract any probes,
because these procedures run the risk for distorting the representation of different sequences in the RNA sample. In
addition, they can interfere with the identification of (for
instance, they may remove) highly expressed genes, which
can also be territory specific markers. Differentially
expressed genes were analyzed by whole-mount in situ
hybridization (WISH) from early blastula stages (10 hours) to
the pluteus stage (90 hours) during normal embryonic
Genome Biology 2007, 8:R85
/>
Genome Biology 2007,
Strategy for expression profiling
Zinc
+ Endoderm
+ Mesoderm
- Ectoderm
- Endoderm
- Mesoderm
+ Ectoderm
Animalisation
information
Genome Biology 2007, 8:R85
interactions
In order to minimize measurement error resulting from
cross-talk between neighboring spots, we made two different
arrays for each set of clones with two different spotting patterns, both of which are used in each experiment. Arrays were
made on nylon filters carrying polymerase chain reaction
(PCR) amplification products of the inserts of 35,238 cDNA
clones, representing about 20,000 genes of the sea urchin S.
purpuratus. This set of clones was selected as a low-redundancy set, as indicated by normalization by oligonucleotide
fingerprinting and expressed sequence tag (EST) analysis
[21]. A re-evaluation with the now available draft of the sea
urchin genome sequence verifies that the established gene
catalog contains a tag for more than 50% of all sea urchin
genes. Out of a total of 28,944 predicted sea urchin gene
refereed research
development, and certain identified marker genes were also
analyzed for expression in treated embryos. In this way we
identified key molecules of endomesoderm and oral-aboral
axis differentiation, novel territories, and new highly dynamic
expression patterns in the sea urchin embryo. A total of about
700 out of more than 4.000 differentially expressed genes
representing all functional protein classes have thus far been
analyzed by WISH. All WISHs were annotated and deposited
in a database that is freely accessible [22]. The differential
expression data are available in the Array Screens Database
[23]. As the screens progress, this database will continue to be
expanded.
deposited research
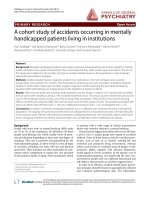
Figure development and perturbations
Normal 1
Normal development and perturbations. Normal sea urchin embryos (top)
develop two primary axis: the animal-vegetal axis and the oral-aboral axis.
Nuclearization of β-catenin in cells on the vegetal side initiates
endomesoderm specification. Later on the ectoderm is divided into an oral
and aboral side, which is comparable to the dorso-ventral axis in
vertebrates. Treating embryos with lithium chloride leads to enhanced
nuclearization of β-catenin and, as a result, a shift in cell fate toward
vegetal and formation of excess endomesoderm (left). Conversely zinc
sulfate treatment prevents endomesoderm formation (right). The
molecular basis for zinc sulfate action is unknown, as is the effect of these
drugs on the ectoderm.
RNA was isolated from embryos subjected to treatment and
control embryos simultaneously, and was hybridized simultaneously on 12 array copies in order to prevent differences
resulting from discrepant handling procedures. For each
probe, six different filter copies were hybridized (for each
experiment) to collect 24 data points per clone (each clone is
spotted in duplicate). This high number of repetitions enables
the calculation of reproducibility values based on the coefficient of variation of the replicate signal intensities for each
cDNA clone. The statistical tests (Student's t-test 1, Welch
test, Wilcoxon test, and a permutation-based test) were calculated for all clones. A total of 3,456 copies of an Arabidopsis
clone were used to adapt the P values, ensuring that an experimental false-positive rate of 5% is not exceeded (for details,
see Herwig and coworkers [24]).
reports
For expression profiling experiments to be valid, they must
exhibit good sensitivity and reproducibility; hence in order to
identify significantly regulated genes, it is necessary to generate enough data points to allow reliable statistical analyses to
be conducted.
reviews
Vegetal
We generated a robust strategy for profiling the expression of
genes differentially expressed during early development in
sea urchin. We compared the conditions of embryos vegetalized by lithium treatment (excess endomesoderm) and animalized by zinc treatment (excess ectodermal territories).
Expression profiles were established for embryos at different
developmental stages. They were established for the midblastula stage at 20 hours after fertilization for lithium-vegetalized embryos and at a midgastrula stage for zinc treatment
(38 hours; see Materials and methods, below, for treatment
details). We decided to analyze the expression profile of a
midgastrula stage of development (38 hours) for the animalized embryos because it is at this stage that a first phenotypic
effect becomes visible (a thickened animal plate and the
absence of gut structures). In addition, the use of a later stage
is also useful for establishing an expression profile catalog
throughout development (Poustka AJ, unpublished data).
comment
Aboral
Lithium
Vegetalisation
Poustka et al. R85.3
Results
Animal
Oral
Volume 8, Issue 5, Article R85
R85.4 Genome Biology 2007,
Volume 8, Issue 5, Article R85
Poustka et al.
models (Glean3) [25], 14,638 do not match an EST sequence,
which would mean that almost 50% of the gene predictions
are already covered by an EST. Of the 27,217 EST clusters,
however, 10,698 do reversely not match any Glean3 gene prediction. This indicates that, as expected, untranslated region
sequences are not properly predicted in the Glean3 gene set
and hence that the number of sea urchin genes tagged in our
EST catalog is well over 50%.
Lithium-zinc in silico subtraction and performance
evaluation
A total of 6,581 clones were identified as being differentially
expressed, according to the criteria described in the Materials
and methods (below; all data are available at the sea urchin
embryo WISH database [23]). We estimate that these clones
represent about 4,000 different genes, based on comparison
with the gene predictions (Glean3) of the recently completed
sea urchin genome sequence [25]. Because lithium vegetalizes and zinc complementarily animalizes embryos, we would
expect endomesoderm-specific genes to be upregulated in
lithium-treated embryos and simultaneously downregulated
in zinc-treated embryos, whereas ectoderm-specific genes
should exhibit the opposite pattern. We selected 81 clones
that are upregulated in the hybridizations with lithium chloride-treated embryos and downregulated in the hybridizations with zinc sulfate-treated embryos (referred to hereafter
as 'LiUpZiDown' clones) and 151 LiDownZiUp clones, of
which 39 and 101 clones, respectively, were analyzed by
WISH. Whereas the percentage of these clones giving
restricted expression patterns was very high (61% and 68%
for LiUpZiDown and LiDownZiUp, respectively), the localization results were striking. Of the clones predicted to be localized to the endomesoderm domain from the LiUpZiDown
fraction, 96% were indeed localized to an endomesodermal
domain during embryogenesis. Likewise, only 19% of the LiDownZiUp group localized to an endomesodermal domain,
whereas the rest were expressed in an ectodermal domain.
As the next step, we evaluated the quality of all of the results
by examining the differentially expressed genes by quantitative real-time PCR (Q-PCR). Statistical analysis (see above)
should ensure that the false-positive rate stays below 5%. The
high number of repetitions and the resulting statistical evaluation gave us the confidence to select even marginally regulated clones, such as those exhibiting a minimal expression
change of 1.3 and a significant reproducibility value (P value)
of minimally e-3 from the set of all regulations. We selected
genes of good (P < e-5), medium (P = e-4 to e-3), and poor (P >
e-2) e values (the last being below the 5% quantile for significantly regulated clones; see Materials and methods, below).
Tables 1, 2, and 3 summarize the values from the array and
the Q-PCR experiments for 71 genes.
Overall, we generated and compared differential expression
data for 80 regulations (namely zinc or lithium) between
array and Q-PCR data. In 17 cases the regulations were not in
/>
agreement, indicating an experimental false positive rate of
21% for the entire set of 6,581 differentially regulated clones
(indicated by 'a' in Tables 1, 2, and 3).
To identify the biologic pathways affected by the treatments,
we analyzed the expression data in terms of pathways. To sort
sea urchin genes into pathways we mapped the ESTs of the
regulated clones on our arrays to the predicted sea urchin
genes (Glean3) of the recently sequenced genome [25] and
then searched to determine whether their human orthologs
are involved in pathways listed in the Kyoto Encyclopedia of
Genes and Genomes pathway database [26]. The results indicate a statistically significant differential regulation of the
mitogen-activated protein kinase and transforming growth
factor-β pathway in zinc-treated embryos.
Expression profile with lithium chloride treatment
We then assessed the efficacy of the lithium chloride treatment through examining the behavior of known sea urchin
endomesoderm genes in the above hybridizations. As
expected, we found that endomesoderm-specific genes (such
as Brachyury, gata-e, foxa, hox11/13b, notch, wnt8 [1,3], krl
[27] and endo16 [28]), which are central components of the
endomesoderm GRN, are all upregulated with the exception
of eve, which we found not to be significantly regulated (as
verified by Q-PCR; Table 1). Because lithium treatment is
thought to activate Wnt (wingless int) signaling by stabilizing
β-catenin, we investigated the expression of Wnt genes in
treated embryos. A Q-PCR survey of all 11 Wnt genes in S.
purpuratus reveals that Wnts 5, 8, and 16 are expressed (>
100 copies/per embryo) at 20 hours of development (which is
the time point at which lithium chloride measurements were
obtained). Furthermore, all three are significantly upregulated in lithium-treated embryos, indicating and confirming a
strong positive response to lithium treatment of Wnt
signaling (see Figure 2 for Wnt gene Q-PCR findings, and
Tables 1 and 3).
Among the genes analyzed by WISH are many genes
expressed in the endomesodermal domain, which have not
yet been described (Additional data file 1). Among these are
several transcription factors (genes encoding enzymes and
suchlike are not described in detail here, but can be found in
the WISH database [22]), including the following: sox4, six3
(Figure 3), dlx (Additional data file 1) and six1 (Figure 4), an
ortholog of the Hex transcription factor family (Figure 5),
Lox, Dp-Hbn (WISH database [22]), Prox, Tbx6, snail, and a
sox17 ortholog (Figure 4). The sox4 and six3 genes have
dynamic and opposing patterns of expression (Figure 3).
Although six3 is expressed initially in the blastula stage at the
animal pole, during gastrulation its expression is also
restricted to the vegetal plate, forming a ring of expression
around both poles of the early embryo. The sox4 gene, on the
other hand, is expressed in the early blastula in the vegetal
plate and is activated during gastrulation at the animal pole as
well (Figure 3). Tbx6 is exclusively expressed in SMCs (Figure
Genome Biology 2007, 8:R85
/>
Genome Biology 2007,
Volume 8, Issue 5, Article R85
Poustka et al. R85.5
Table 1
Differential expression data based on array experiments and Q-PCR of endomesoderm marker genes
P value
Q-PCR ratio ± error
Brachyury
537REA_5B8
EM
Li 1.69
Zn 0.42
1.08 × e-06
3.89 × e-03
1.64 ± 0.21
0.33 ± 0.10
Blimp1
537REA_16B13
E
Li 1.33
Zn 0.42
3.98 × e-02
2.58 × e-03
1.78 ± 0.09
0.53 ± 0.04
CoA-reductase
536REAsu2_4L15
EM
Li 0.40
Zn 1.31
5.68 × e-08
1.20 × e-03
0.44 ± 0.03
1.71 ± 0.50
Delta
536REAsu4_17C2
SMC
Li 1.79
Zn NA
1.64 × e-01
NA
4.86 ± 1.05
0.95 ± 0.14
Dlx
537REA_9O11
EM-Oect
Li 0.09
Zn NA
2.60 × e-05
NA
0.03 ± 0.00
0.58 ± 0.26
Endo16
536REAsu2_5N1
E
Li 1.20
Zn 0.46
3.00 × e-01
2.05 × e-04
1.76 ± 0.34
1.70 ± 0.12a
Eve
537REA_2G8
E
Li 1.33
Zn nd
4.89 × e-03
nd
0.93 ± 0.01a
1.73 ± 0.10
FoxA
537REA_10P13
EM+Oect
Li 1.37
Zn na
1.37 × e-06
na
3.18 ± 0.12
1.69 ± 0.43
GataE
537REA_3C9
E
Li 1.55
Zn 0.48
2.77 × e-03
1.71 × e-03
3.06 ± 0.92
0.23 ± 0.04
Hex
SpSMBLAS_124N22
M
Li 1.54
Zn nd
3.99 × e-01
nd
3.22 ± 0.53
0.33 ± 0.03
Hox11/13b
537REA_12K1
E
Li 1.69
Zn na
3.44 × e-09
na
na
na
KRL
PMC_BG781437
EM
Li
Zn
Lox
536REAsu4_13M18
E
Li ne
Zn 0.36
ne
5.17 × e-03
ne
0.04 ± 0.01
Notch
RUDIREA_30E15
E
Li 1.27
Zn na
4.84 × e-01
na
1.81 ± 0.18
13.5 ± 3.41
P19
537REA_15K13
PMC
Li 1.07
Zn 1.58
7.82 × e-01
3.43 × e-03
1.66 ± 0.33
2.14 ± 0.22
PMAR1
PMC
Li na
Zn na
na
na
1.77 ± 0.29
0.50 ± 0.02
Prox
RUDIREA_15N17
M
Li 0.57
Zn na
2.40 × e-04
na
0.81 ± 0.16
1.46 ± 0.27
Six3
RUDIREA_40B23
Apical, later +EM
Li 0.72
Zn 0.10
7.83 × e-02
6.46 × e-03
0.39 ± 0.04
1.15 ± 0.15a
SM50
RUDIREA_5L2
PMC
Li 0.57
Zn 1.55
1.09 × e-05
1.20 × e-04
1.07 ± 0.19a
18.12 ± 2.93
SMAD2
RUDIREA_24O7
PMC
Li 0.50
Zn NA
2.49 × e-01
NA
0.52 ± 0.09
1.20 ± 0.32
Snail
RUDIREA_13L18
EM
Li 0.99
Zn 0.26
9.72 × e-01
9.05 × e-05
0.24 ± 0.01
0.09 ± 0.01
Sox4
RUDIREA_2H10
EM, later +apical
Li 1.15
Zn nd
4.23 × e-01
nd
1.67 ± 0.21
1.05 ± 0.08
SuH
621REA_14C17
EM
Li 0.24
Zn NA
3.75 × e-02
NA
4.24 ± 0.95a
4.61 ± 1.50
T-Brain
621Rea_6N24
M
Li 0.82
Zn na
6.93 × e-01
na
1.40 ± 0.31a
2.18 ± 0.12
Tbx6
RUDIREA_29D1
M
Li 0.64
Zn 0.74
6.71 × e-05
1.78 × e-05
0.33 ± 0.15
0.16 ± 0.04
Unknown
536REAsu4_13G12
EM
Li 2.23
Zn 4.05
2.69 × e-07
5.52 × e-10
4,68 ± 0.72
11,01 ± 0,27
Wnt3
RUDIREA_28M14
EM
Li 0.89
Zn NA
7.86 × e-01
NA
2.29 ± 0.97a
0.09 ± 0.03
Wnt5
RUDIREA_16P23
EM
Li 1.25
Zn NA
1.97 × e-01
NA
6.31 ± 2.31
1.08 ± 0.08
Wnt8
537REA_10K11
EM
Li 1.35
Zn NA
4.19 × e-03
NA
2.49 ± 0.07
11.36 ± 1.13
1.90 ± 0.03
5.95 ± 0.66
deposited research
refereed research
interactions
information
The first column gives the gene name and the clone ID, both of which can be used to query the described database [22] for additional data. In the second column the
localization of expression in the embryo is given, where EM is endomesoderm, E is endoderm, M is mesoderm, PMC is primary mesenchyme cell, and SMC is secondary
mesenchyme cell, Oect is oral ectoderm. The third column (Regulation) gives the differential expression ratios (expression in treatment/expression control) based on the array
experiment for lithium (Li) and zinc (Zn) treated embryos (values above 1 indicate upregulation and values below 1 indicate downregulation). The column 'P value' indicates the
statistical probability that the regulation could happen by chance (see Materials and methods for detail). The column Q-PCR (quantitative real-time polymerase chain reaction)
gives the differential expression ratios (expression in treatment/expression control) and the error, as determined by Q-PCR. (Values expressed in copies of mRNA molecules/
embryo are provided via the expressed sequence tag database [75]; see Materials and methods for details on Q-PCR). aDifferential expression based on array and Q-PCR data
do not correlate. na, not analyzed; nd, no statistically relevant differential expression; ne, not expressed; ?, expression pattern unknown.
Genome Biology 2007, 8:R85
reports
Regulation
reviews
Expression
comment
EM markers
R85.6 Genome Biology 2007,
Volume 8, Issue 5, Article R85
Poustka et al.
/>
Table 2
Differential expression data based on array experiments and Q-PCR of ectoderm marker genes
Ectoderm markers
Expression
Regulation
P value
Q-PCR ratio ± error
Bmp2/4
SpSMBLIT_68K21
Oral
Li 1.32
Zn 1.54
3.13 × e-01
7.33 × e-01
1.27 ± 0.29
0.97 ± 0.25
Chordin
537REA_13L23
Oral
Li nd
Zn 0.40
nd
4.55 × e-05
1.19 ± 0,19
0.41 ± 0,12
Goosecoid
RUDIREA_9C8
Oral
Li 1.05
Zn 0.27
8.43 × e-01
4.13 × e-03
0.75 ± 0.08a
0.16 ± 0.06
Lefty
536REAsu4_7H9
Oral
Li 1.80
Zn nd
1.91 × e-07
nd
0.98 ± 0.22a
2.17 ± 0,14
Nodal
536REA_98I13
Oral
Li na
Zn na
na
na
1.34 ± 0,11
4.12 ± 0,23
IrxA
SpSMBLAS_51E6
Aboral
Li 0.38
Zn
2.51 × e-09
0.08 ± 0.05
1.60 ± 0.02
Nkx2.2
536REAsu4_10G11
Aboral
Li 0.37
Zn nd
7.69 × e-08
nd
0.15 ± 0.13
5.87 ± 0.15
Spec2A
Aboral
Li nd
Zn nd
nd
nd
na
10.64 ± 1.67
Tbx2
RUDIREA_26D12
Aboral
Li 0.20
Zn
3.50 × e-12
0.12 ± 0.01
1.42 ± 0.24
Dp-Hbn
SpSMBLAS_141N1
Apical
Li 0.14
Zn nd
1.41 × e-07
nd
0.05 ± 0.02
1.03 ± 0.21
FoxJ
RUDIREA_13I13
Apical
Li 1.40
Zn 2.29
2.86 × e-02
3.26 × e-07
0.93 ± 0.20a
1.84 ± 0.04
FoxQ
537REA_3F18
Apical
Li 0.24
Zn 4.51
3.55 × e-14
5.01 × e-07
0.15 ± 0.03
4.66 ± 0.78
Glass
536REAsu2_5I1
Apical
Li 0.52
Zn na
2.99 × e-01
na
ne
0.03± 0.01
ZFhpf4
537REA_15C23
Apical
Li 0.24
Zn na
7.78 × e-07
na
1.20 ± 0.00
2.05 ± 0.15
Hypothetical
RUDIREA_15C22
Apical + SMC late
Li 0.59
Zn 4.27
4.79 × e-01
3.24 × e-02
0.20 ± 0.06
1.11 ± 0.10
Mox
SpSMBLAS_131A20
Apical, serotonergic
Li 0.49
Zn nd
8.23 × e-02
nd
1.76 ± 0.22a
1.39 ± 0.21
Radical spoke protein
RUDIREA_39F2
Apical
Li 1.56
Zn na
5.75 × e-04
na
1.14 ± 0.10
2.11 ± 0.45
sFRP1/5
536REAsu4_11O4
Apical
Li 0.42
Zn 1.99
7.10 × e-04
3.67 × e-04
0.11 ± 0.04
2.14 ± 0.08
Hairy1
537REA_10P14
Cilliary band +?E
Li 0.77
Zn
5.78 × e-06
0.62 ± 0.04
1.54 ± 0.25
onecut
538REA_9E3
Cilliary band
Li 0.40
Zn 0.74
3.20 × e-04
5.88 × e-03
0.68 ± 0.06
1.84 ± 0.24a
Pax2
RUDIREA_22J20
Cilliary band
Li 1.14
Zn na
7.71 × e-01
na
3.72 ± 0.50
0.11 ± 0.02
AEX3
RUDIREA_5J10
Entire ectoderm, off vegetal
Li 0.64
Zn 5.34
1.37 × e-08
3.83 × e-12
0.78 ± 0.26
9.11 ± 0.90
Hatching enzyme
538REA_2G05
Entire ectoderm
Li 3,39
Zn 4.35
4.42 × e-07
1.25 × e-03
7.55 ± 0.55
11.42 ± 0.87
Otx
537REA_12D12
Entire ectoderm
Li 0.65
Zn na
1.01 × e-04
na
0.96 ± 0.09
2.43 ± 0.14
Soxb1
RUDIREA_25A17
Entire ectoderm
Li 1.28
Zn nd
9.93 × e-02
nd
0.87 ± 0.05a
1.43 ± 0.27
Soxb2
536REAsu4_4A13
Entire ectoderm
Li 1.44
Zn
6.71 × e-05
0.79 ± 0.12a
1.12 ± 0.27
SpAN
RUDIREA_29D20
Entire ectoderm
Li 2.19
Zn nd
7.72 × e-07
nd
1.88 ± 0.13
1.73 ± 0.14
The first column gives the gene name and the clone ID, both of which can be used to query the described database [22] for additional data. In the second column the
localization of expression in the embryo is given, where E is endoderm and SMC is secondary mesenchyme cell. The third column (Regulation) gives the differential expression
ratios (expression in treatment/expression control) based on the array experiment for lithium (Li) and zinc (Zn) treated embryos (values above 1 indicate upregulation and
values below 1 indicate downregulation). The column 'P value' indicates the statistical probability that the regulation could happen by chance (see Materials and methods for
detail). The column Q-PCR (quantitative real-time polymerase chain reaction) gives the differential expression ratios (expression in treatment/expression control) and the
error, as determined by Q-PCR. (Values expressed in copies of mRNA molecules/embryo are provided via the expressed sequence tag database [75]; see Materials and
methods for details on Q-PCR). aDifferential expression based on array and Q-PCR data do not correlate. na, not analyzed; nd, no statistically relevant differential expression;
ne, not expressed; ?, expression pattern unknown.
4). Other interesting genes expressed in the vegetal components are a Smad-interacting protein and the c-fos transcrip-
tion factor (Additional data file 1), which in vertebrates is a
Wnt target gene and interacts with Smads [29].
Genome Biology 2007, 8:R85
/>
Genome Biology 2007,
Volume 8, Issue 5, Article R85
Poustka et al. R85.7
Table 3
Differential expression data based on array experiments and Q-PCR of genes with unknown or ubiquitous expression pattern
P Value
Q-PCR ratio
Arginine kinase
536REAsu4_15B20
?
Li 2.20
Zn na
7.29 ì e-07
na
1.95 0.15
2.07 0.47
ò-catenin
538REA_2O22 RUDIREA_22E13
Ubiquitous
Li 0.39
Zn na
4.77 × e-03
na
0.85 ± 0.11
0.79 ± 0.16
SpZ12
?
Li 1.44
Zn 2.29
2.55 × e-01
2.05 × e-02
2.03 ± 0.37
2.66 ± 0.40
Hmx, NkX5.1
537REA_6C02
?
Li 0.20
Zn 1.86
1.18 × e-14
5.87 × e-03
0.05 ± 0.03
1.20 ± 0.32
Tcf/Lef
536REAsu4_11P24
?
Li 1.37
Zn na
7.88 × e-02
na
0.73 ± 0.13a
1.42 ± 0.29
WntA
RUDIREA_33L4
?
Li 1.07
Zn nd
8.13 × e-01
nd
0.39 ± 0.13a
0.24 ± 0.12
Wnt1
?
Li na
Zn na
na
na
ne
ne
Wnt4
536REAsu4_6C19
?
Li 1.09
Zn NA
6.69 × e-01
NA
1.66 ± 0.36
1.73 ± 0.21
Wnt6
?
Li na
Zn na
na
na
1.55 ± 0.19
0.24 ± 0.01
Wnt7
?
Li na
Zn na
na
na
ne
0.03 ± 0.02
Wnt9
?
Li na
Zn na
na
na
ne
0.29 ± 0.03
Wnt10
?
Li na
Zn na
na
na
1.43 ± 0.29
1.30 ± 0.14
Wnt16
?
Li na
Zn na
na
na
2.79 ± 0.81a
0.84 ± 0.12
Thus far, of a total of 700 genes that were analyzed by WISH,
selected from either of the expression profiling experiments,
151 localized to an endomesodermal domain. We identified
34 clones restricted to primary mesenchyme cells (PMCs), 92
to SMCs, and 98 to ectodermal cells, of which about half colocalize to more than one cell type. About 400 genes exhibited
ubiquitous expression or expression was too low to allow any
detection. More than 2,400 images from these WISHs have
been annotated, with the results accessible in the sea urchin
WISH database [22].
Genome Biology 2007, 8:R85
information
The global view that arises from the analysis of this screen is
that a majority of genes are downregulated in zinc-treated
embryos. Zinc sulfate treatment has the opposite effect of
lithium chloride and animalizes the embryos. No endomesoderm is formed and the embryos are 'arrested' as a hollow ball
of ectodermal cells (Figures 1 and 5, 6, 7, 8). Zinc treatment is
believed to have a nonspecific, purely inhibitory mode of
action, which is in accordance with our findings. Nevertheless, there are two groups of genes that we found to be up-regulated. These are genes expressed in the apical plate and
genes expressed in the aboral ectoderm. Table 1 shows that a
interactions
Zinc treatment expands the neuronal apical plate by
downregulating vegetal signaling and oral markers, and
upregulating aboral markers
refereed research
Concerning the effect of lithium on the ectoderm, three observations were made. First, apical pole genes, which are those
that are expressed at the animal most ectodermal region
(such as Fz5/8 [15] and SpNK2.1 [30]), are eliminated. As
shown in detail in Table 2, the expression ratios in lithiumtreated embryos for newly discovered apical plate markers
such as FoxQ2, Zfhpf4 (Figure 6), and Dp-Hbn (WISH database [22]) are 0.15, 0.01, and 0.05, respectively, which correspond to 6-fold, 100-fold, and 20-fold downregulation,
respectively (as determined by Q-PCR). Second, the expression of oral genes is shifted to the animal side of the embryo,
as was observed for antivin/lefty by Duboc and coworkers
[16]. Third, genes expressed on the aboral side are strongly
downregulated (Table 1). This is the case for the known transcription factor tbx2 (ratio 0.12, equivalent to a 8.3-fold
downregulation) but also for the newly discovered aboral
ectoderm transcriptional regulators IrxA (ratio 0.08, 12.5fold downregulation) and SpNkx2.2 (ratio 0.15, 6.6-fold
downregulation; Figure 6). Genes expressed in the oral ectoderm (BMP2/4, lefty/antivin, nodal, and chordin) or cilliary
band (Sponecut and SpPaxB) are not clearly differentially
regulated in lithium-treated embryos (Table 2; for insitus, see
WISH database [22]).
deposited research
The first column gives the gene name and the clone ID, both of which can be used to query the described database [22] for additional data. In the second column the
localization of expression in the embryo is given. The third column (Regulation) gives the differential expression ratios (expression in treatment/expression control) based on
the array experiment for lithium (Li) and zinc (Zn) treated embryos (values above 1 indicate upregulation and values below 1 indicate downregulation). The column 'P value'
indicates the statistical probability that the regulation could happen by chance (see Materials and methods for detail). The column Q-PCR (quantitative real-time polymerase
chain reaction) gives the differential expression ratios (expression in treatment/expression control) and the error, as determined by Q-PCR. (Values expressed in copies of
mRNA molecules/embryo are provided via the expressed sequence tag database [75]; see Materials and methods for details on Q-PCR). aDifferential expression based on array
and Q-PCR data do not correlate. na, not analyzed; nd, no statistically relevant differential expression; ne, not expressed; ?, expression pattern unknown.
reports
Regulation
reviews
Expression
comment
Other genes
R85.8 Genome Biology 2007,
Volume 8, Issue 5, Article R85
Poustka et al.
/>
100.00
Wnt8
10533
Wnt5
10.00
5854
Wnt16
Wnt3
Wnt4
20
WntA
1.00
45
1664
49
Wnt1
n.e.
10
31
217
Wnt7
14
5076
693
n.e.
5091
Wnt6
373
940
4726
681
n.e.
Wnt10
Wnt9
466
n.e.
553
717
2049 934
9
7
1251
686
5
428
457
570
17
211
369
161
0.10
60
12
0.01
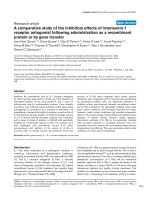
Figure 2
Expression of Wnt genes in lithium and zinc treated embryos
Expression of Wnt genes in lithium and zinc treated embryos. Quantitative real-time polymerase chain reaction (Q-PCR) analysis of all wingless int (Wnt)
genes of the sea urchin Strongylocentrotus purpuratus. Measurements were done at blastula stage (20 hours) for lithium-treated embryos (purple bars) and
gastrula stage (38 hours) for zinc-treated embryos (pink bars). Data are presented in a logarithmic style. Bars above 1 indicate upregulation and bars below
1 indicate downregulation. The numbers given on top or bottom of bars are the number of mRNA molecules/embryo in normal or treated embryos,
respectively. For instance, the number of transcripts for wntA is 45 in normal 20 hours embryos and 17 in lithium-treated embryos (blue bar), and the
number of transcripts of wnt5 is 940 in normal 20 hours embryos and 5,854 in lithium-treated 20 hours embryos. Where n.e. (not expressed) is indicated
the gene is not expressed at this stage at all, either in control or in treated embryos. Also see Tables 1 and 3 and the text for further detail.
majority of genes expressed in the vegetal plate are severely
reduced in expression, indicating that vegetal signaling is
largely blocked. Q-PCR analysis of Wnt genes indicates that
all Wnts except wnt1 are expressed at significant levels (> 100
copies/embryo) at 38 hours (midgastrula stage; see Tables 1
and 3 and Figure 2). Of the ones that have significant (> 2fold) differential expression, wntA, wnt3, wnt6, wnt7, and
wnt9 are downregulated in zinc-treated embryos. Only one
Wnt, namely wnt8, is upregulated in zinc-treated embryos. In
addition, the secreted Wnt antagonist sFRP1/5 is markedly
upregulated in zinc-treated embryos (Figure 6).
We found 14 genes that specifically localized to the animal
plate, some of which appear to localize specifically to neuronal cells of the apical organ. The Dp-Hbn (WISH database
[22]) gene is initially expressed broadly in the animal plate
and becomes cleared during gastrulation from the central
region, forming a ring of expression around the apical organ.
A similar ring-like expression, embracing the developing api-
cal organ, is also observed for the six3 gene, which is later also
expressed on the vegetal side (see above). Several genes are
expressed exactly in the apical organ. These are the transcription factors FoxJ (WISH database [22]),FoxQ2 (Figure 6),
Mox, glass (Figure 7), a zinc finger gene (hpf4; Figure 6), a
radial spoke protein, the tubulin β-chain gene (WISH database [22]), several genes without clear homology to any
known genes, and - strikingly - Sp-sFRP1/5, which is a
secreted frizzled protein (Figure 6).
We have analyzed three transcription factors (FoxQ2, Mox,
and glass) for co-expression with serotonin and show here
that the transcription factor Mox is specific for serotonergic
neurons, whereas the transcription factor glass, which in
Drosophila is required for the differentiation and survival of
photoreceptor sells [31], localizes to cells adjacent to serotonergic cells (Figure 8). FoxQ2 and Glass are expressed in the
neurogenic ectoderm but not in serotonergic neurons. Using
the FoxQ2 gene as marker of the apical organ and Mox as a
Genome Biology 2007, 8:R85
/>
Genome Biology 2007,
(b)
(c)
(d)
(e)
(f)
(g)
(h)
(i)
(j)
Via a series of targeted array screens, we identified 250 genes
exhibiting a restricted expression pattern. An analysis of
global gene expression using whole-genome tiling arrays
indicates that 9,000 genes are expressed in the sea urchin
embryo [34]. Previous random WISH screens across multiple
organisms have concluded that 20% of all genes assessed had
a restricted expression pattern [35,36]. This could mean that
perhaps 1,800 sea urchin genes are expressed in specific tissues during embryonic development. We hence assume that
the genes identified thus far and the additional differentially
expressed genes that have not yet been analyzed represent a
significant portion of all tissue-specific sea urchin genes. This
assumption provides the rationale for using our approach of
combined array-WISH screens to unravel new candidate
genes of GRNs, ultimately to move toward a global systems
level understanding of sea urchin embryogenesis.
information
Genome Biology 2007, 8:R85
interactions
Among the genes that we found to be upregulated in zinctreated embryos is the homeobox transcription factor gene
mox, which is a member of the extended hox complex in
humans [37], which in vertebrates has been found to be
involved in mesoderm development [38,39]. By simultaneous
WISH and immunohistochemical localization with serotonin,
we could show that Mox is expressed in serotonergic neurons
in the apical plate (Figure 8). Hence, this is the first transcription factor identified in sea urchin embryos that is expressed
specifically by serotonergic cells; furthermore, its pattern of
expression is consistent with its functioning in neuronal
specification. It is also the first time that a mox ortholog had
been found to be expressed by neurons in any organism.
WISH analysis of mox in zinc-treated embryos revealed an
apparent expansion of expression of mox in these embryos.
Consistent with this, immunohistochemical localization of
serotonin in zinc-treated embryos revealed an increase in the
number of serotonergic neurons (Figure 7). Although two
other transcription factors, expressed in the apical plate
(FoxQ2 and glass), were found to be negative for expression
in serotonergic neurons, it remains possible that they are
refereed research
Neuronal identity, apical plate, and zinc treatment
deposited research
In addition to upregulation of genes of the animal plate or the
apical organ, we also find a significant number of upregulated
genes that are expressed in the aboral ectoderm in normal
embryos. In fact, no transcription factor has yet been identified that is exclusively expressed in the aboral ectoderm.
However, the fact that there is a cytoskeletal gene (Spec2A
[32]) that is exclusively expressed in the aboral ectoderm
does argue that such factors should exist (although post-transcriptional or combinatorial mechanisms of control of gene
activity cannot be ruled out). As a control, we measured
Spec2a expression in zinc-treated embryos and find that it is
about tenfold upregulated (Table 2). One transcription factor
that is expressed in the aboral ectoderm but that is also
expressed in other territories is the T-box gene Tbx2/3
[15,33]. This gene was found to be significantly downregulated (Table 2; namely, clone RUDIREA_28I11, which is
downregulated by a factor of 0.20; P = 3.50e-12) in lithiumtreated embryos and is upregulated in zinc-treated embryos.
We found two other transcription factors, namely IrxA (Irx4/
5) of the Iroquois gene family and Nkx2.2 in the highly signif-
Discussion
reports
marker for serotonergic cells in zinc-treated embryos, we
found that the few cells forming the apical organ in the sea
urchin embryo are markedly expanded in the zinc-treated
embryos (Figure 6), whereas this recently described new territory [30] appears to be entirely eliminated in lithiumtreated embryos (Figure 6). Furthermore, we find that the
expanded apical plate is extremely enriched in serotonergic
neurons, where about 30 serotonergic neurons form, as
opposed to five or six in normal embryos (Figure 7).
icant group in zinc-treated embryos. Both genes (as illustrated in Figure 6) are expressed in the aboral ectoderm,
starting at very early stages, and expand their expression
toward the oral side of the vegetal half during gastrulation in
normal embryos. Hence, we propose that these transcription
factors are essential components of the regulatory network
that controls oral-aboral ectoderm differentiation. Because
many aboral genes are upregulated in zinc-treated embryos,
one would expect a downregulation of oral specific genes.
This was found to be the case for the oral specific genes chordin (its antagonist Bmp2/4, also orally expressed, is not significantly differentially expressed) and goosecoid, but not for
nodal and its antagonist lefty (see Discussion and conclusions, below).
reviews
Opposing expression patterns of six3 and sox4
Figure 3
Opposing expression patterns of six3 and sox4. Whole-mount in situ
hybridization (WISH) analysis of the developmental expression pattern of
the transcription factors six3 and sox4. (a to e) six3; (f to j) sox4. The
animal side is located to the top in all images. Six3 expression starts as
early as 8 hours of development (8 hours embryo in panel a and 10 hours
in panel b) at the animal side of the embryo. At the mesenchyme blastula
stage (20 hours in panel c and flattened embryo in panel d), the animal
expression clears from the central apical plate (apical organ) and at the
same time forms a ring-like expression around the vegetal pole as well. In
the pluteus (panel e) expression is detectable in a part of one coelomic
pouch and at the forgut-midgut constriction. In contrast, sox4 is initially
expressed on the vegetal side (14 hours embryo in panel f). Starting from
18 hours (panel g, and 20 hours in panel h) of development, expression
also starts in the apical plate. At gastrula stage (panel i) expression is
detected at the archenteron tip, and in the pluteus (panel j) expression can
be detected in various secondary mesoderm cell derivatives, including
some coelomic pouch cells.
Poustka et al. R85.9
comment
(a)
Volume 8, Issue 5, Article R85
R85.10 Genome Biology 2007,
Volume 8, Issue 5, Article R85
Poustka et al.
/>
+Lithium
Normal
1
2
3
+Zinc
4
5
6
Endo16
FGF20
FGFR3
FGFR1
FGFR1
FoxA
Prox1
Prox1
Tbx6
GataE
Tbx6
SMIP
Six1
Six1
PKCdelta1
PKCdelta1
Hex
P19
Sox17
Sox17
Snail
Snail
Figure 4
Coexpression of genes in SMC cells
Coexpression of genes in SMC cells. Whole-mount in situ hybridization
(WISH) analysis of examples of signaling and transcription factor genes
identified in this screen. FGF20 (Sp-FGF9/16/20), the only fibroblast growth
factor present in the sea urchin genome, is expressed in primary
mesenchyme cells (PMCs) and around the apical organ during gastrulation,
whereas two receptors identified in this screen are expressed in adjacent
secondary mesenchyme cells (SMCs; FGFR3, blastula stage) and in SMCs
and the central apical region (FGFR1, left blastula, right gastrula). The
transcription factors Prox1, Tbx6, Six1, Sox17, and snail are expressed in
SMCs during gastrulation, as is a PKCdelta1 gene. In all pictures the animal
sides of the embryos is located towards the top. Annotated images of
additional stages can be found in the WISH database [22].
expressed by one of the other types of neurons of the apical
organ. The transcription factor glass is required for the differentiation and survival of photoreceptor cells in Drosophila
[31]. In the sea urchin, glass is expressed in cells adjacent to
serotonergic neurons. The structure of photoreceptors in sea
urchins is not known, but it is presumed to involve sensory
neurons and lack image-forming specializations. Thus, the
apical organ may contain photoreceptors. However, there are
no published data demonstrating that urchin embryos and
larvae are responsive to photic cues.
The secreted frizzled-related protein gene Sp-sFRP1/5,
selected because of being upregulated in zinc-treated
embryos and downregulated in lithium-treated embryos, is
also expressed exclusively in the apical plate and later in the
apical organ (Figure 6). Secreted frizzled proteins are potent
and highly specific inhibitors of Wnt signaling because they
lack membrane domains and strongly compete with the Wnts
on their receptors (frizzleds) [40]. This finding is an indication that downregulation of Wnt signaling may be a requirement for apical organ formation and neurogenesis, and one of
the possible actions of zinc treatment on embryogenesis. A
Figure 5
treated embryos
Expression of endomesoderm markers in normal, lithium-treated and zincExpression of endomesoderm markers in normal, lithium-treated and zinctreated embryos. Shown are whole-mount in situ hybridizations (WISHs)
of endomesodermal marker genes on blastula stage (columns 1, 3, and 5)
and gastrula stage (columns 2, 4, and 6) sea urchin embryos. The genes
under considerations are indicated on the right hand side. Endo16, FoxA,
and GataE are known, and Smip is a new gene that is expressed in the
endoderm. The expression is strongly expanded in lithium-treated
embryos (columns 3 and 4), whereas only at the most animal pole are
ectodermal tissues left in the embryo. Blastula stage zinc-treated embryos
do not exhibit any expression of endodermal markers (column 5).
Gastrula stage zinc-treated embryos (column 6) do occasionally begin to
express early endomesodermal markers as they recover from treatment
(see Materials and methods). Hex is a transcription factor that is expressed
at low levels in primary mesenchyme cells (PMCs) and predominantly in
secondary mesenchyme cell (SMC) cells. Expression is upregulated in
lithium-treated embryos, as determined by quantitative real-time
polymerase chain reaction (Q-PCR; columns 3 and 4; compare with Table
1) but seems unchanged as determined by WISH and is eliminated in
blastula stage zinc-treated embryos. P19 is a PMC-specific gene identified
in the screen. Although its expression appears to be quantitatively
upregulated in lithium-treated and zinc-treated embryos (see Table 2),
WISH analysis indicates that the number of PMC cells forming is normal in
lithium-treated or zinc-treated embryos, but that the PMCs migrate to the
animal pole in lithium-treated embryos and to the vegetal pole in zinctreated embryos. In neither case does a skeleton form.
second finding, namely that aboral genes are upregulated in
zinc-treated embryos, suggests that oral specific genes may be
downregulated. This was found to be the case for the oral-specific genes chordin and goosecoid. However, other oral
expressed genes exhibit a different pattern of regulation. As
an example, the chordin antagonist Bmp2/4 is not differentially expressed, whereas nodal and its antagonist lefty are
upregulated (see Q-PCR data in Table 2). This finding
appears to contradict a recent finding that Nodal signaling, in
the absence of vegetal signaling, represses the serotonergic
cell content in the embryo [41]; hence, further investigation
into the roles of BMP and nodal signaling, and expansion of
Genome Biology 2007, 8:R85
/>
Normal
+Lithium
2
3
Volume 8, Issue 5, Article R85
Poustka et al. R85.11
+Zinc
4
5
(a)
6
(b)
(c)
(d)
(e)
(f)
(g)
(h)
hpf4
FoxQ2
comment
1
Genome Biology 2007,
sFRP1/5
onecut
Nkx2.2
reports
IrxA
Figure 7
serotonergic cellsGlass and Mox and immunohistochemical localization of
WISH analysis of in normal and zinc-treated embryos
WISH analysis of Glass and Mox and immunohistochemical localization of
serotonergic cells in normal and zinc-treated embryos. Whole-mount in
situ hybridization (WISH) analysis identified the transcription factors (a)
Glass and (b) Mox as being expressed in single cells of the apical organ.
Although Glass expression is eliminated in zinc-treated embryos (b), the
expression of Mox is expanded and upregulated in zinc-treated embryos
(f) (also see quantitative real-time polymerase chain reaction data in Table
2). Immunohistochemical localization of serotonin in (c, d) normal and (g,
h) zinc-treated embryos shows that whereas normal embryos produce
four to six serotonergic cells (panel d), the number of serotonergic cells is
elevated to at least 30 on average in zinc treated embryos (panel h). Panels
d and h are fluorescent photographs of the same embryos depicted in
transmitted light in panels c and g, respectively.
reviews
chordin
tbx2
TBX6, Notch, fibroblast growth factor, and Wnt
signaling in SMC specification
information
Genome Biology 2007, 8:R85
interactions
In the sea urchin, induction of the mesodermal founder cells
that give rise to the secondary mesenchyme cells of the
embryo (SMCs; for example, pigment cells and blastocoelar
cells) require a signal transduced by the Notch receptor [4346]. This signal is the Delta ligand, which is expressed by the
eight large micromere daughter cells beginning at the seventh
cleavage [47]. The Delta signal is received directly by the adjacent cells of the macromere lineage. Our screen has identified
fibroblast growth factor (FGF) signaling components Tbx6
and snail as components of SMC-specific gene expression
(Figure 4). This signaling cascade reveals striking similarities
in gene expression between sea urchin SMC cells and mouse
presomitic mesoderm. In the mouse embryo Tbx6 is
expressed in presomitic mesoderm during mouse gastrulation [48,49]. Studies have shown that Wnt signaling, in
synergy with T/TBX6, controls Notch signaling by regulating
Delta1 (Dll1) expression in the presomitic mesoderm of
mouse embryos by demonstrating the need for T-box-binding
and LEF/TCF-binding sites for activity of the Dll1 promoter
refereed research
the animal plate is required. The screens for zinc-treated
embryos were conducted at a stage where normal embryos
are at the gastrula stage (38 hours) and oral expression of
nodal and lefty are downregulated in the oral ectoderm at this
stage (expression shifts to the right side [42]). Hence, nodal
and lefty may not be useful oral markers at this stage, and it
is better to rely on chordin and goosecoid, which remain
orally expressed until the end of gastrulation. Alternatively,
there may be interactions between transforming growth factor-β signaling pathways, or the zinc-treated embryos may
undergo a recovery process that leads to elevated expression
of early patterning genes. Because many of the differentially
expressed genes have not been analyzed in detail, we expect
that there are additional genes that are involved in
neurogenesis.
deposited research
Figure 6
Expressiothium-treated, and zinc-treated embryos
Expression of ectoderm markers in normal, lithium-treated, and zinctreated embryos. Shown are whole-mount in situ hybridizations (WISHs)
of ectodermal marker genes on blastula stage (columns 1, 3, and 5) and
gastrula stage (columns 2, 4, and 6) sea urchin embryos. The genes under
considerations are indicated on the right hand side. Expression of apical
plate marker genes (hpf4, FoxQ2, and secreted frizzled protein 1/5 [sFRP1/
5]) is lost in lithium-treated embryos (columns 3 and 4) and expanded in
zinc-treated embryos (columns 5 and 6). Expression of the oral ectoderm
marker chordin is shifted to the 'new' animal pole region in lithium-treated
embryos (columns 3 and 4) but lost in blastula stage zinc-treated embryos
(column 5). However, ectodermal differentiation does appear to take
place in zinc-treated embryos if they are left to recover for a longer period
of time (column 6). The ciliated band marker gene onecut exhibits wildtype-like expression in lithium-treated embryos, with a ring of expression
around the animal pole (columns 3 and 4). The apical expression domain
of onecut co-expands like the other apical organ markers in zinc-treated
embryos (panels 5 and 6). Strikingly, the expression of aboral ectoderm
markers (IrxA, Nkx2.2, and tbx2) is lost in blastula stage lithium-treated
embryos (panel 3), whereas it is enhanced in zinc-treated blastula stage
embryos, in which the expression appears to be quite uniformly
distributed. Tbx2 is expressed in mesodermal cells and in the aboral
ectoderm in normal embryos (columns 1 and 2). Strikingly, the ectodermal
expression only is lost in lithium-treated embryos, whereas the
mesodermal domain remains (compare with Figure 4).
R85.12 Genome Biology 2007,
Volume 8, Issue 5, Article R85
Poustka et al.
Serotonin
T-WISH
Merged
(b)
(c)
(e)
(f)
(h)
(i)
(k)
(l)
(n)
(o)
(q)
(r)
72 hours
(d)
Confocal single
FoxQ2
Epi-fluorescenct
(a)
/>
72 hours
Epi-fluorescent
(g)
72 hours
Confocal single
MOX
(j)
72 hours
Confocal single
(m)
120 hours
Epi-fluorescent
Glass
(p)
72 hours
Figure 8 (see legend on next page)
Genome Biology 2007, 8:R85
/>
Genome Biology 2007,
Volume 8, Issue 5, Article R85
Poustka et al. R85.13
Genome Biology 2007, 8:R85
information
In the development of bilaterian animals, the indirect mode
of development is regarded to be ancestral because it occurs
in deuterostomes (echinoderms and hemichordates) and protostomes (lophotrochozoans), but in chordates (and ecdysozoan protostomes) indirect modes of development appear to
have been lost during evolution [57]. Indirect development
(also referred to as maximal indirect development) is characterized by use of a larval stage, the body patterning of which
is essentially different from the body patterning of the adult
[57]. The comparative study of gene expression patterns in
interactions
Evolution of axial patterning
There are several parallels between the organizer region of
other animals and the vegetal pole of sea urchin. For example,
in all cases this is the site of gastrulation as well as the source
of axial specification signals that are capable of reorganizing
surrounding tissue upon transplantation. Chordin and nodal
are molecules classically associated with organizer and dorsal
axis specification; in particular, chordin was used to interpret
the expression on the ventral side in flies as possible proof of
an axis inversion that happened during the evolution of tribloblastic animals. In fact, ecdysozoans are very derived animals with a direct mode of development that is regarded not
to be ancestral [57]. The derived state of ecdysozoans is
reflected by the recent finding that diploblastic cnidarians
may share more genes with vertebrates than they do with
ecdysozoans [59]. In sea urchin embryo we have an example
in which the gene expression pattern of chordin and the
organizer-like region are dissociated. One could view this
finding as an indication that the vegetal plate is not the only
organizer region in sea urchin embryo, but that the oral ectoderm also has organizer functions, perhaps similar to head
and trunk organizer in vertebrates. Moreover, the classical
dorso-ventral patterning genes chordin (Figure 6) and nodal,
and their antagonists BMP2/4 and lefty/antivin [16,42],
respectively, are all expressed at the same time on the same
side of the embryo, in the oral ectoderm, and this may have
further implications for the evolution of axial patterning.
Even more strikingly, a recent analysis of dorso-ventral genes
in the cnidarian Nematostella vectensis has revealed a similar
situation in which, unlike in flies and vertebrates, the trans-
refereed research
Gene expression data in lophotrochozoan larvae are still few,
and gene expression studies in indirect developing basal deuterostomes are also in their infancy; hence, this study aims to
close the gap.
deposited research
Thus, it appears that several levels of crosstalk exist between
the Notch, the Wnt, and the FGF pathways in somitogenesis
in the mouse. The co-expression of Tbx6, FGFR1, and FGFR3
(this report) and delta [54] in sea urchin embryo suggests that
during sea urchin SMC specification, differentiation, or maintainance, highly similar processes function as in mesenchymal epithelial transition of mouse presomitic mesoderm to
somites. Hence, we propose that in sea urchin there may exist
a feed-forward loop, in which Tbx6 and Wnt may act in synergy to activate delta to control Notch signaling in SMC differentiation. Moreover, we also found the transcription factor
Prox1 to be co-expressed with FGFR3. This indicates that, like
in mouse, FGFR3 may be a target of Prox1 [55]. Interestingly,
a PKCdelta1 gene is expressed in migrating SMC cells. In the
Xenopus embryo it has been shown that PKCdelta is essential
for dishevelled function in a noncanonical Wnt pathway that
regulates convergent extension movements [56]. This indicates that noncanonical Wnt signaling is involved in cell
migration and convergent extension movements during sea
urchin embryogenesis and further indicates that there exists
crosstalk between Wnt, Notch, and FGF signalling in secondary mesenchyme (SMC) specification and differentiation.
reports
the larvae of protostomes (for instance, annelid trochophora)
and deuterostomes (for example, sea urchin dipleurula type)
is a key step toward gaining insights into the Urbilateria, the
common bilaterian ancestors. For example, comparison of
gene expression between three patterning genes in indirect
developing lophotrochozoan embryos and their counterparts
in vertebrates and basal deuterostomes suggests that the
Urbilateria has developed through a free swimming larva
[58].
reviews
in the tailbud and presomitic mesoderm. This suggests that
T/TBX6 and Wnt signaling directly and synergistically regulate Dll1 transcription in the tailbud and presomitic
mesoderm in mouse [50]. In addition, T-box transcription
factors, as well as FGF and Wnt signaling, are essential regulators of formation, differentiation, and maintenance of
paraxial mesoderm in mouse embryos, because mutations in
T, Fgfr1, wnt3a, and Tbx6 cause defects in formation and differentiation of paraxial mesoderm [51-53].
comment
Figure 8 (see previous co-staining with serotonin
Glass, Mox, and FoxQ2 page)
Glass, Mox, and FoxQ2 co-staining with serotonin. FoxQ2 mRNA is detected throughout the thickened neurogenic ectoderm at the animal pole of prisms
(72 hours), but in 96 and 120 hour plutei there was no hybridization detectable. Tyramide amplification produces small foci of fluorescence in the
cytoplasm of the cells that hybridize probe. There is diffuse background fluorescence throughout the remainder of the embryo. (a to c) In 72 hour prisms
that have strong hybridization of the FoxQ2 probe to the neurogenic ectoderm, the anti-serotonin immunoreactive cells were localized outside the FoxQ2
region. (d to f) Single confocal optical section clearly shows serotonergic cells are FoxQ2 negative (white arrow). Mox mRNA was detected in the
neurogenic ectoderm of prism and pluteus larvae. (g to l) In prism larvae, all of the serotonergic neurons were Mox positive. There are also some cells
that are not immunoreactive with anti-serotonin, and they hybridize the Mox probe (not shown). (m to o) In plutei, neurons that are weakly
immunoreactive with anti-serotonin hybridize with the Mox probe (yellow arrow). However, Mox mRNA was not detected in the neurons that strongly
expressed serotonin. As the serotonergic neurons continue to differentiate during these stages, this may indicate that Mox is only expressed early in
neurogenesis (asterisks in panels m to o). These preparations have relatively high background. (p to r) Glass mRNA appears not to co-localize with antiserotonin immunoreactive cells in 72 hours prisms (white and yellow arrowheads).
R85.14 Genome Biology 2007,
Volume 8, Issue 5, Article R85
Poustka et al.
forming growth factor-β ligands and their antagonists are colocalized at the onset of gastrulation in presumptive endoderm [60].
/>
(IgG)-Alexa488 (green) from Molecular Probes (Eugene, OR,
USA, product number A-11034).
Expression profiling
It is therefore imperative to analyze the development of indirect developing organisms in order to analyze axis relationships between protostomes and deuterostomes.
We predict that chordin will be expressed on the ventral side
of lophotrochozoan embryos as well, which would indicate
that the bilaterian ancestor developed through a swimming
larva, similar to types of larvae that can be found in basal deuterostomes, such as echinoderms and hemichordates and
prototypic protostomes, the lophotrochozoans.
Such a result would also mean that an axis inversion could not
have taken place at the time point in evolution when the tribloblastic world arose, but rather at the time when chordates
arose. Expression and GRN architecture analysis of the chordin molecule and other dorso-ventral patterning genes in
lophotrochozoan embryos and in amphioxus will clarify this
interesting aspect of bilaterian evolution.
Materials and methods
Embryo cultures and treatments
The fertilized eggs were grown at a maximal density of 1 to 2
× 107 eggs/liter (1% to 2% volume; 1 ml settled eggs roughly
equals 106 eggs/embryos, so no more than 10,000/ml) in filtered seawater in 1 to 3 liter beakers. The antibiotics penicillin
(20 units/ml) and streptomycin (50 μg/ml) were added to
cultures that were to be grown for longer than 15 hours. The
cultures were kept at 16°C with continuous stirring.
For lithium chloride treatment embryos were cultured in seawater containing a 30 mmol/l end concentration of lithium
chloride, which was added after egg activation (namely at the
two-cell stage). For expression profiling we used the midblastula stage at 20 hours of development. Zinc sulfate treatments
to animalize the embryos were performed as described by
Nemer and coworkers [61]. Expression profiling was performed on 38-hour embryos.
WISH, TWISH, and immunohistochemical
localization of serotonin
Fixation of embryos and WISH was performed in accordance
with the method described by Minokawa and coworkers [62]
or as described previously [63]. Tyramide signal amplification (TSA) with whole mount in situ RNA hybridization
(TWISH) and immunohistochemical localization of serotonin
was performed in accordance with the method described by
Yaguchi and Katow [64]. The anti-serotonin antibody used
was made in rabbits and obtained from Sigma (Munich,
Bavaria, Germany) (product number S5545). As secondary
antibodies we used anti-Rabbit (IgG)-Alexa594 (red) from
Molecular Probes (product number A-11037) and anti-Rabbit
Plasmid inserts of 35,238 cDNA clones representing about
20,000 genes of the sea urchin Strongylocentrotus purpuratus [21] were PCR amplified in a 30 μl volume in 384-well
plates. PCR was performed in 1 × PCR buffer, with 0.1 mmol/
l primer, 200 mmol/l of each dNTP, 1.5 mol/l betain, and 2 to
3 units Taq polymerase. As vector specific primers, M13 forward: 5'-GCTATTATGCCAGCTGGCGAAAGGGGGATGTG-3'
and 3/86: 5'-CCGGTCCGGAATTCCCGGGT-3' were used to
amplify the inserts. Ready PCR mix was inoculated with a
bacterial suspension using a replicator. PCR was performed
for 30 cycles with the following cycle profile: 20 s denaturation at 94°C followed by a one-step 210 s annealing and extension step at 65°C.
DNA was transferred to dry Hybond N+ Nylon membranes
using in-house build spotting robots. Filters were fixed to tiles
using sticky bands. Each DNA was spotted seven times. Pin
diameter used was 250 μm, and the spot distance was 900 μm
in the common 5 × 5 pattern (each clone in duplicate) [65].
After spotting filters were denatured by 2 × 5 min soaking on
whatman paper weatend with 0.4 mol/l NaOH followed by 2
× 5 min denaturation on whatman paper soaked with 0.5
mol/l NaH2PO4 (pH 7.2). Filters were air dried overnight and
cross-linked twice at 12 J/cm2 using the UV Stratalinker 2400
(Stratagene, La Jolla, CA, USA).
Embryos were dissociated in 20 volumes Trizol (Gibco BRL
Life Technologies, Rockville, MD, USA), shockfrozen in liquid
nitrogen, and stored at -80°C until use. For RNA isolation the
sample was defrosted in a 65°C waterbath, 0.2 ml chloroform/ml Trizol was added, and the mixture was shaken for 15
s, followed by an additional 5 min at room temperature. The
samples were subsequently balanced and then centrifuged at
12,000 g for 15 min at 4°C in a Sorvall SS34 rotor in silinized
RNAse free glass tubes. Supernatant was transferred to a new
RNAse free tube and 0.5 ml isopropanol/1 ml Trizol added.
After thorough mixing, the sample was stored for 10 min at
room temperature followed by a 10 min spin, as above. The
RNA pellet was then washed with 20 ml of 75% ice-cold ethanol and spun for 5 min at 7,500 g at 4°C. The pellet was air
dried for 10 min and re-suspended in 500 μl RNAse free
water. The integrity of the RNA was analyzed by gel electrophoresis and its concentration was determined spectrophotometrically. RNA was aliquoted and stored at -80°C.
For poly A selection, the PolyATract mRNA Isolation System
III (Promega, Mannheim, Germany) was used, in accordance
with the manufacturer's instructions. Usually, 8 to 10 μg poly
A RNA was obtained from 1 mg total RNA. RNA concentration was determined spectrophotometrically. A typical labeling reaction was carried out with 1 μg poly A RNA (used for
two filters). One microgram of poly A RNA concentrated in a
Genome Biology 2007, 8:R85
volume of 8 μl was mixed with 1 μl of random primer hexamers (Gibco BRL; 2.5 μg/μl), denatured for 10 min at 70°C, and
immediately placed on ice. Subsequently, the following was
added: 1 μl RNasin (Promega), 1.5 μl cMix, 6 μl 5 × reverse
transcriptase buffer, 3 μl 0.1 mol/l DTT, 7 μl α- [P-33] dCTP
(70 μCi), and 2 μl Superscript II reverse transcriptase (Gibco
BRL). The mixture was mixed well and incubated at 37°C for
2 hours. Incorporation was measured by running 1 μl on a PEI
paper followed by capturing intensities by scanning on a
phosphorimager. ImageQuant software (GE Healthcare,
Munich, Germany) was used to measure the ratio of incorporated versus unincorporated nucleotides. The rate of incorporation is usually more than 90%. Probe was denatured by
addition of 10 μl 5 mol/l NaOH. Hybridizations were carried
out in modified Church buffer at a probe concentration of 100
ng/ml in a 10 ml volume, with two filters separated by a nylon
mesh in one bottle at 65°C for 20 hours. Bottles were carefully
cleaned with 1 mol/l NaOH before use. After hybridization,
filters were washed four times in 1 l wash solution containing
40 ml of 0.5 mol/l NaH2PO4 (pH 7.2), 10 ml 10% SDS, and 2
ml 0.5 mol/l EDTA, twice at room temperature and twice at
65°C. Filters were then wrapped in saran wrap without any
wrinkles, exposed for 10 hours, and scanned at 100 μm resolution using the Fuji BAS 1800 phosphorimager.
To analyze pathways based on gene expression signals, we
tested whether the entire group of genes associated with specific pathways exhibited differential expression across treated
and untreated conditions. We mapped the sea urchin genes
via the glean3 protein predictions of the sea urchin genome
[25] to the human ensemble genes (National Center for Biotechnology Information version 36) and those to HUGO via
reciprocal blast. Symbols that are grouped into Kyoto Kyoto
Encyclopedia of Genes and Genomes pathways (version
18.05.2006) were used to analyze pathway-specific differential regulation of sea urchin genes. The procedure computes a
nonparametric test for the groups of genes organized in pathways and judges which pathways are affected by the treatment. This is described in detail elsewhere [67]. All array data
can be found in the Array Screens Database [23].
Total RNA was isolated from embryos subjected to 20 hours
of lithium treatment embryos and from those subjected to 38
hours of zinc treatment, as well as from untreated embryos at
corresponding time points by extraction with Trizol (Gibco
BRL), following the manufacturer's instructions. The integrity of the resulting RNAs was analyzed by gel electrophoresis. In case of DNA contamination, RNAs were DNAse treated
using the TURBO DNA-free® Kit (Ambion, Austin, TX, USA).
cDNA was transcribed with random hexamers and 1 μg total
RNA using M-MLV reverse transcriptase (Promega). The
cDNAs were used as Q-PCR templates to determine mRNA
transcript levels of several genes in embryos at the embryonic
stages mentioned above. Quantitative real-time PCR measurements were performed on an ABI 7900 HT Detection
System using SYBR Green PCR Master Mix (ABI, Foster City,
CA, USA) with the following thermal cycling parameters:
50°C for 2 min and 95°C for 10 min, followed by 40 cycles of
95°C for 15 s and 60°C for 1 min. To determine the expression
of a specific gene, SpZ12-1 amplification for normalizing
measurements of the absolute number of transcripts of the
gene as well as ubiquitin amplifications as an amplification
reliability standard were also carried out on the same sample.
Each PCR reaction was performed in triplicate.
information
Genome Biology 2007, 8:R85
interactions
A threshold was arbitrarily set within the exponential range of
the amplification process so that different samples could be
compared in terms of the number of cycles required to attain
the threshold (CT, threshold cycle) when considering the
same marker gene. The Q-PCR primer sequences used to
determine the amount of transcripts of a specific gene can be
found in Additional data file 2. Gel electrophoresis and dissociation curve were used to confirm product. Primer efficiency
was found to be around 1.96. The average CT value obtained
for the gene of interest (CTGOI) was normalized to the average
CT value acquired on the same control cDNA preparations
with SpZ12-1 primers (CTSpZ12): ΔCT = CTGOI - CTSpZ12. The
exact number of transcripts per untreated embryo of the specific gene at 20 hours and 38 hours respectively (QGOI) was
calculated using the known values described by Wang and
refereed research
For each cDNA, we performed statistical tests based on the
replicate signals in experiments with treated and untreated
samples. Four standard tests were used in parallel: Student's
t-test, the Welch test, Wilcoxon's rank-sum test, and a permutation-based test [24].
Quantitative real-time PCR
deposited research
Gene expression data were normalized as described previously [66]. The validity of gene expression of each individual
signal was judged by comparison with a negative control sample. In order to verify whether a given gene was significantly
expressed, we compared its signal with a signal distribution
derived from negative controls. In our array design, we distributed about 6,000 empty spot positions on the array. After
quantification, a small, non-zero intensity was assigned to
each empty spot, reflecting the amount of background signal
on the array. Because these positions were spread uniformly
over the array, the distribution of signals reflects a global
background distribution for the experiment and indicates
whether cDNA signals were at or above the background level
of expression. For each cDNA, we counted the relative proportion of empty positions on the array that were smaller
than the observed intensity (background tag [BG]). Background-tags from replicated experiments for the same cDNA
were averaged. Thus, high values (close to 1) indicated that
the cDNA was expressed in the tissue tested, whereas low values reflected noise. cDNAs were considered 'expressed' when
their average background-tag was above 0.9, a threshold consistent with the limit of visual detection of the spots.
Poustka et al. R85.15
reports
Statistical analysis
Volume 8, Issue 5, Article R85
reviews
Genome Biology 2007,
comment
/>
R85.16 Genome Biology 2007,
Volume 8, Issue 5, Article R85
Poustka et al.
coworkers [68] and Minokawa and colleagues [62] for SpZ121 at the same stages (QSpZ12): QGOI = QSpZ12 × 1.96-ΔCT.
The ratio of gene expression between treated and untreated
embryos was calculated as follows. First, the average CT value
of the specific gene (CTGOI) was normalized to the average CT
value acquired with ubiquitin primers (CTUbq) on cDNA
obtained from untreated embryos (ΔCT [con] = CTGOI [con] CTUbq [con]) as well as on cDNA obtained from treated
embryos (ΔCT [tre] = CTGOI [tre] - CTUbq [tre]). The ratio was
then determined by using the difference in normalized CT
values: rGOI(tre/con) = 1.96ΔCT(con)-ΔCT(tre). To determine the
exact number of transcripts of the specific gene per treated
embryo, the ratio found was multiplied by the exact number
of transcripts of the same gene in the control embryo, as calculated previously: QGOI(tre) = rGOI(tre/con) × QGOI(con). The
numbers given in the figures and tables are averages of the
results of at least two independent experiments using two different batches of cDNA.
/>
References
1.
2.
3.
4.
5.
6.
7.
8.
9.
Databases and database management
Development and maintenance of the sea urchin web application was done on a dual core 64 bit computer running a Linux
operating system using an Apache webserver [69]. The database was implemented with a relational sqlite3 database [70].
The web interface was created dynamically by CGI scripts [71]
written in the Perl programming language [72], and Javascript components were used to enhance the user interface.
Connection to the database is done via the DBI module [73]
and the DBD::Sqlite module [74]. All data that accompany
this report can be found in the sea urchin EST database [75],
the Array Screens Database [23], the WISH database [22],
and the genome database [76]. The sea urchin genome annotation data are accessible via the Baylor College Genome
Project annotation database [25,77].
Additional data files
10.
11.
12.
13.
14.
15.
16.
The following additional data are available with the online
version of this paper. Additional data file 1 provides a figure
with WISH images of 88 endomesoderm genes in Strongylocentrotus purpuratus embryos at blastula stage (20 hours).
Additional data file 2 provides a table summarizing the
sequences of the used Q-PCR primers, amplicon size, and
melting temperatures.
primers, are file used
Providedamplicon images melting temperatures. hours).
temperaturesthe 88 1
Sequences data filesize, andof primers,embryos of genes in melting
Additionalfortable summarizing endomesoderm size, stageQ-PCR
Click hereisof WISH 2 Q-PCR 88the genes in blastula usedblastula
stage Strongylocentrotus purpuratus amplicon the and
embryos a
WISH images of
endomesoderm sequences (20
17.
18.
19.
20.
Acknowledgements
We thank Drs Matthew Clark and Pia Aanstad for discussions during the
course of this project and help with experimental design. Furthermore, we
thank Florian Thiel for help with the WISH database, Dr Andrew Hufton
for careful reading of the manuscript, and Professor Bernhard G Herrmann
for valuable suggestions. We thank Drs George Weinstock and Erica Sodergren, and the Baylor College of Medicine (Human Genome Sequencing
Center, Houston, TX, USA) for access to the S. purpuratus genome
sequence before scientific publication. This work was supported by the
Max-Planck Gesellschaft zur Förderung der Wissenschaften e.V. and by the
Network of Excellence Marine Genomics of the European Union contract
N° 505430.
21.
22.
23.
24.
Davidson EH, Rast JP, Oliveri P, Ransick A, Calestani C, Yuh CH,
Minokawa T, Amore G, Hinman V, Arenas-Mena C, et al.: A provisional regulatory gene network for specification of endomesoderm in the sea urchin embryo. Dev Biol 2002, 246:162-190.
Davidson EH, Rast JP, Oliveri P, Ransick A, Calestani C, Yuh CH,
Minokawa T, Amore G, Hinman V, Arenas-Mena C, et al.: A genomic
regulatory network for development.
Science 2002,
295:1669-1678.
Ransick A, Rast JP, Minokawa T, Calestani C, Davidson EH: New
early zygotic regulators expressed in endomesoderm of sea
urchin embryos discovered by differential array
hybridization. Dev Biol 2002, 246:132-147.
Rast JP, Cameron RA, Poustka AJ, Davidson EH: brachyury Target
genes in the early sea urchin embryo isolated by differential
macroarray screening. Dev Biol 2002, 246:191-208.
Calestani C, Rast JP, Davidson EH: Isolation of pigment cell specific genes in the sea urchin embryo by differential macroarray screening. Development 2003, 130:4587-4596.
Sinner D, Kirilenko P, Rankin S, Wei E, Howard L, Kofron M, Heasman J, Woodland HR, Zorn AM: Global analysis of the transcriptional network controlling Xenopus endoderm formation.
Development 2006, 133:1955-1966.
Loose M, Patient R: A genetic regulatory network for Xenopus
mesendoderm formation. Dev Biol 2004, 271:467-478.
Stainier DY: A glimpse into the molecular entrails of endoderm formation. Genes Dev 2002, 16:893-907.
Tam PP, Kanai-Azuma M, Kanai Y: Early endoderm development
in vertebrates: lineage differentiation and morphogenetic
function. Curr Opin Genet Dev 2003, 13:393-400.
Xanthos JB, Kofron M, Wylie C, Heasman J: Maternal VegT is the
initiator of a molecular network specifying endoderm in
Xenopus laevis. Development 2001, 128:167-180.
Emily-Fenouil F, Ghiglione C, Lhomond G, Lepage T, Gache C:
GSK3beta/shaggy mediates patterning along the animal-vegetal axis of the sea urchin embryo. Development 1998,
125:2489-2498.
Wikramanayake AH, Huang L, Klein WH: beta-Catenin is essential for patterning the maternally specified animal-vegetal
axis in the sea urchin embryo. Proc Natl Acad Sci USA 1998,
95:9343-9348.
Logan CY, Miller JR, Ferkowicz MJ, McClay DR: Nuclear beta-catenin is required to specify vegetal cell fates in the sea urchin
embryo. Development 1999, 126:345-357.
Vonica A, Weng W, Gumbiner BM, Venuti JM: TCF is the nuclear
effector of the beta-catenin signal that patterns the sea
urchin animal-vegetal axis. Dev Biol 2000, 217:230-243.
Croce J, Duloquin L, Lhomond G, McClay DR, Gache C: Frizzled5/
8 is required in secondary mesenchyme cells to initiate archenteron invagination during sea urchin development. Development 2006, 133:547-557.
Duboc V, Rottinger E, Besnardeau L, Lepage T: Nodal and BMP2/4
signaling organizes the oral-aboral axis of the sea urchin
embryo. Dev Cell 2004, 6:397-410.
Angerer LM, Oleksyn DW, Levine AM, Li X, Klein WH, Angerer RC:
Sea urchin goosecoid function links fate specification along
the animal-vegetal and oral-aboral embryonic axes. Development 2001, 128:4393-4404.
Lallier R: Effect of cadmium and zinc ions on the development
of the sea-urchin egg (Paracentrotus lividus) [in French].
Arch Biol (Liege) 1955, 66:75-102.
Lallier R: Heavy metal ions and the problem of embryonic
determination in echinoderms [in French]. J Embryol Exp
Morphol 1956, 4:265-278.
Timourian H: The effect of zinc on sea urchin morphogenesis.
J Exp Zool 1968, 169:121-132.
Poustka AJ, Groth D, Hennig S, Thamm S, Cameron A, Beck A, Reinhardt R, Herwig R, Panopoulou G, Lehrach H: Generation, annotation, evolutionary analysis, and database integration of
20,000 unique sea urchin EST clusters. Genome Res 2003,
13:2736-2746.
The Sea Urchin Embryo Whole Mount In Situ Hybridisation
Database [ />The Sea Urchin Embryo Array Screen Database [http://gob
let.molgen.mpg.de/cgi-bin/seaurchin-hybsbase.cgi]
Herwig R, Aanstad P, Clark M, Lehrach H: Statistical evaluation of
differential expression on cDNA nylon arrays with replicated
Genome Biology 2007, 8:R85
/>
25.
27.
28.
30.
31.
33.
35.
36.
38.
39.
40.
42.
43.
45.
46.
52.
53.
54.
55.
56.
57.
58.
59.
60.
61.
62.
63.
64.
65.
66.
67.
Genome Biology 2007, 8:R85
information
44.
51.
interactions
41.
50.
refereed research
37.
49.
deposited research
34.
48.
during sea urchin embryogenesis.
Development 1999,
126:5255-5265.
Sweet HC, Gehring M, Ettensohn CA: LvDelta is a mesoderminducing signal in the sea urchin embryo and can endow blastomeres with organizer-like properties. Development 2002,
129:1945-1955.
Chapman DL, Garvey N, Hancock S, Alexiou M, Agulnik SI, GibsonBrown JJ, Cebra-Thomas J, Bollag RJ, Silver LM, Papaioannou VE:
Expression of the T-box family genes, Tbx1-Tbx5, during
early mouse development. Dev Dyn 1996, 206:379-390.
Chapman DL, Cooper-Morgan A, Harrelson Z, Papaioannou VE:
Critical role for Tbx6 in mesoderm specification in the
mouse embryo. Mech Dev 2003, 120:837-847.
Hofmann M, Schuster-Gossler K, Watabe-Rudolph M, Aulehla A,
Herrmann BG, Gossler A: WNT signaling, in synergy with T/
TBX6, controls Notch signaling by regulating Dll1 expression in the presomitic mesoderm of mouse embryos. Genes
Dev 2004, 18:2712-2717.
Chapman DL, Papaioannou VE: Three neural tubes in mouse
embryos with mutations in the T-box gene Tbx6. Nature
1998, 391:695-697.
Ciruna B, Rossant J: FGF signaling regulates mesoderm cell fate
specification and morphogenetic movement at the primitive
streak. Dev Cell 2001, 1:37-49.
Aulehla A, Wehrle C, Brand-Saberi B, Kemler R, Gossler A, Kanzler
B, Herrmann BG: Wnt3a plays a major role in the segmentation clock controlling somitogenesis. Dev Cell 2003, 4:395-406.
Walton KD, Croce JC, Glenn TD, Wu SY, McClay DR: Genomics
and expression profiles of the Hedgehog and Notch signaling
pathways in sea urchin development.
Dev Biol 2006,
300:153-164.
Shin JW, Min M, Larrieu-Lahargue F, Canron X, Kunstfeld R, Nguyen
L, Henderson JE, Bikfalvi A, Detmar M, Hong YK: Prox1 promotes
lineage-specific expression of fibroblast growth factor (FGF)
receptor-3 in lymphatic endothelium: a role for FGF signaling in lymphangiogenesis. Mol Biol Cell 2006, 17:576-584.
Kinoshita N, Iioka H, Miyakoshi A, Ueno N: PKC delta is essential
for Dishevelled function in a noncanonical Wnt pathway that
regulates Xenopus convergent extension movements. Genes
Dev 2003, 17:1663-1676.
Davidson EH, Peterson KJ, Cameron RA: Origin of bilaterian body
plans: evolution of developmental regulatory mechanisms.
Science 1995, 270:1319-1325.
Arendt D, Technau U, Wittbrodt J: Evolution of the bilaterian
larval foregut. Nature 2001, 409:81-85.
Kortschak RD, Samuel G, Saint R, Miller DJ: EST analysis of the
cnidarian Acropora millepora reveals extensive gene loss and
rapid sequence divergence in the model invertebrates. Curr
Biol 2003, 13:2190-2195.
Matus DQ, Thomsen GH, Martindale MQ: Dorso/ventral genes
are asymmetrically expressed and involved in germ-layer
demarcation during cnidarian gastrulation. Curr Biol 2006,
16:499-505.
Nemer M: An altered series of ectodermal gene expressions
accompanying the reversible suspension of differentiation in
the zinc-animalized sea urchin embryo. Dev Biol 1986,
114:214-224.
Minokawa T, Rast JP, Arenas-Mena C, Franco CB, Davidson EH:
Expression patterns of four different regulatory genes that
function during sea urchin development. Gene Expr Patterns
2004, 4:449-456.
Poustka AJ, Kuhn A, Radosavljevic V, Wellenreuther R, Lehrach H,
Panopoulou G: On the origin of the chordate central nervous
system: expression of onecut in the sea urchin embryo. Evol
Dev 2004, 6:227-236.
Yaguchi S, Katow H: Expression of tryptophan 5-hydroxylase
gene during sea urchin neurogenesis and role of serotonergic
nervous system in larval behavior. J Comp Neurol 2003,
466:219-229.
Clark MD, Panopoulou GD, Cahill DJ, Bussow K, Lehrach H: Construction and analysis of arrayed cDNA libraries. Methods
Enzymol 1999, 303:205-233.
Kahlem P, Sultan M, Herwig R, Steinfath M, Balzereit D, Eppens B,
Saran NG, Pletcher MT, South ST, Stetten G, et al.: Transcript level
alterations reflect gene dosage effects across multiple tissues in a mouse model of down syndrome. Genome Res 2004,
14:1258-1267.
Adjaye J, Huntriss J, Herwig R, BenKahla A, Brink TC, Wierling C,
reports
32.
47.
Poustka et al. R85.17
reviews
29.
experiments. Nucleic Acids Res 2001, 29:E117.
Sodergren E, Weinstock GM, Davidson EH, Cameron RA, Gibbs RA,
Angerer RC, Angerer LM, Arnone MI, Burgess DR, Burke RD, et al.:
The genome of the sea urchin Strongylocentrotus purpuratus.
Science 2006, 314:941-952.
The KEGG Pathway Database
[ />pathway.html]
Howard EW, Newman LA, Oleksyn DW, Angerer RC, Angerer LM:
SpKrl: a direct target of beta-catenin regulation required for
endoderm differentiation in sea urchin embryos. Development
2001, 128:365-375.
Ransick A, Ernst S, Britten RJ, Davidson EH: Whole mount in situ
hybridization shows Endo 16 to be a marker for the vegetal
plate territory in sea urchin embryos. Mech Dev 1993,
42:117-124.
Verschueren K, Remacle JE, Collart C, Kraft H, Baker BS, Tylzanowski
P, Nelles L, Wuytens G, Su MT, Bodmer R, et al.: SIP1, a novel zinc
finger/homeodomain repressor, interacts with Smad proteins and binds to 5'-CACCT sequences in candidate target
genes. J Biol Chem 1999, 274:20489-20498.
Takacs CM, Amore G, Oliveri P, Poustka AJ, Wang D, Burke RD,
Peterson KJ: Expression of an NK2 homeodomain gene in the
apical ectoderm defines a new territory in the early sea
urchin embryo. Dev Biol 2004, 269:152-164.
Moses K, Ellis MC, Rubin GM: The glass gene encodes a zinc-finger protein required by Drosophila photoreceptor cells.
Nature 1989, 340:531-536.
Hardin PE, Angerer LM, Hardin SH, Angerer RC, Klein WH: Spec2
genes of Strongylocentrotus purpuratus. Structure and differential expression in embryonic aboral ectoderm cells. J Mol
Biol 1988, 202:417-431.
Gross JM, Peterson RE, Wu SY, McClay DR: LvTbx2/3: a T-box
family transcription factor involved in formation of the oral/
aboral axis of the sea urchin embryo. Development 2003,
130:1989-1999.
Samanta MP, Tongprasit W, Istrail S, Cameron RA, Tu Q, Davidson
EH, Stolc V: The transcriptome of the sea urchin embryo. Science 2006, 314:960-962.
Gawantka V, Pollet N, Delius H, Vingron M, Pfister R, Nitsch R, Blumenstock C, Niehrs C: Gene expression screening in Xenopus
identifies molecular pathways, predicts gene function and
provides a global view of embryonic patterning. Mech Dev
1998, 77:95-141.
Neidhardt L, Gasca S, Wertz K, Obermayr F, Worpenberg S, Lehrach
H, Herrmann BG: Large-scale screen for genes controlling
mammalian embryogenesis, using high-throughput gene
expression analysis in mouse embryos. Mech Dev 2000,
98:77-94.
Pollard SL, Holland PW: Evidence for 14 homeobox gene clusters in human genome ancestry. Curr Biol 2000, 10:1059-1062.
Candia AF, Wright CV: The expression pattern of Xenopus
Mox-2 implies a role in initial mesodermal differentiation.
Mech Dev 1995, 52:27-36.
Rallis C, Stamataki D, Pontikakis S, Mankoo BS, Karagogeos D: Isolation of the avian homologue of the homeobox gene Mox2
and analysis of its expression pattern in developing somites
and limbs. Mech Dev 2001, 104:121-124.
Jones SE, Jomary C: Secreted Frizzled-related proteins: searching for relationships and patterns. Bioessays 2002, 24:811-820.
Yaguchi S, Yaguchi J, Burke RD: Specification of ectoderm
restricts the size of the animal plate and patterns neurogenesis in sea urchin embryos. Development 2006, 133:2337-2346.
Duboc V, Rottinger E, Lapraz F, Besnardeau L, Lepage T: Left-right
asymmetry in the sea urchin embryo is regulated by nodal
signaling on the right side. Dev Cell 2005, 9:147-158.
McClay DR, Peterson RE, Range RC, Winter-Vann AM, Ferkowicz MJ:
A micromere induction signal is activated by beta-catenin
and acts through notch to initiate specification of secondary
mesenchyme cells in the sea urchin embryo. Development
2000, 127:5113-5122.
Ruffins SW, Ettensohn CA: A fate map of the vegetal plate of the
sea urchin (Lytechinus variegatus) mesenchyme blastula.
Development 1996, 122:253-263.
Sherwood DR, McClay DR: LvNotch signaling mediates secondary mesenchyme specification in the sea urchin embryo.
Development 1999, 126:1703-1713.
Sweet HC, Hodor PG, Ettensohn CA: The role of micromere signaling in Notch activation and mesoderm specification
Volume 8, Issue 5, Article R85
comment
26.
Genome Biology 2007,
R85.18 Genome Biology 2007,
68.
69.
70.
71.
72.
73.
74.
75.
76.
77.
Volume 8, Issue 5, Article R85
Poustka et al.
Hultschig C, Groth D, Yaspo ML, Picton HM, et al.: Primary differentiation in the human blastocyst: comparative molecular
portraits of inner cell mass and trophectoderm cells. Stem
Cells 2005, 23:1514-1525.
Wang DG, Britten RJ, Davidson EH: Maternal and embryonic
provenance of a sea urchin embryo transcription factor,
SpZ12-1. Mol Mar Biol Biotechnol 1995, 4:148-153.
The Apache Webserver Source Page []
The Sqlite Source Page []
The CGI Script Source Page [ />ware/CGI/]
The PERL Programming Language Source Page
[http://
www.perl.org]
DBI Module Source Page [ />DBD Module Source Page
[ />doc?DBD::SQLite]
The Sea Urchin Embryo EST Database
[
gen.mpg.de/cgi-bin/seaurchin-database.cgi]
The Sea Urchin Genome Database
[
gen.mpg.de/cgi-bin/seaurchin-genombase.cgi]
The Sea Urchin Genome Project Gene Annotations
Database
[ />Login.html]
Genome Biology 2007, 8:R85
/>