Báo cáo y học: "Modular organization in the reductive evolution of protein-protein interaction networks" pps
Bạn đang xem bản rút gọn của tài liệu. Xem và tải ngay bản đầy đủ của tài liệu tại đây (1.44 MB, 8 trang )
Genome Biology 2007, 8:R94
comment reviews reports deposited research refereed research interactions information
Open Access
2007Tamameset al.Volume 8, Issue 5, Article R94
Research
Modular organization in the reductive evolution of protein-protein
interaction networks
Javier Tamames
*
, Andrés Moya
*
and Alfonso Valencia
†
Addresses:
*
Instituto Cavanilles de Biodiversidad y Biología Evolutiva, Universitat de València, 46071 Valencia, Spain.
†
Structural and
Computational Biology Programme, Spanish National Cancer Research Centre (CNIO), 28029 Madrid, Spain.
Correspondence: Javier Tamames. Email:
© 2007 Tamames et al; licensee BioMed Central Ltd.
This is an open access article distributed under the terms of the Creative Commons Attribution License ( which
permits unrestricted use, distribution, and reproduction in any medium, provided the original work is properly cited.
Protein interaction network evolution<p>Analysis of the reduction in genome size of <it>Buchnera aphidicola </it>from its common ancestor <it>E. coli </it>shows that the organization of networks into modules is the property that seems to be directly related with the evolutionary process of genome reduc-tion.</p>
Abstract
Background: The variation in the sizes of the genomes of distinct life forms remains somewhat
puzzling. The organization of proteins into domains and the different mechanisms that regulate gene
expression are two factors that potentially increase the capacity of genomes to create more
complex systems. High-throughput protein interaction data now make it possible to examine the
additional complexity generated by the way that protein interactions are organized.
Results: We have studied the reduction in genome size of Buchnera compared to its close relative
Escherichia coli. In this well defined evolutionary scenario, we found that among all the properties
of the protein interaction networks, it is the organization of networks into modules that seems to
be directly related to the evolutionary process of genome reduction.
Conclusion: In Buchnera, the apparently non-random reduction of the modular structure of the
networks and the retention of essential characteristics of the interaction network indicate that the
roles of proteins within the interaction network are important in the reductive process.
Background
Bacterial endosymbionts of insects, such as Buchnera aphidi-
cola [1,2], Blochmannia floridanus [3] and Wigglesworthia
glossinidia [4], are paradigms of reductive evolution. These
bacteria live in a stable and isolated environment, the bacte-
riocyte of insects, where the host provides most of their nutri-
tional requirements. As a consequence, the genomes of these
bacteria have undergone a process of reduction, losing
around 90% of their ancestral genes. These endosymbionts
also fail to acquire new genes due to their incapacity to incor-
porate DNA via lateral gene transfer and their isolated envi-
ronment. Nevertheless, although their genomes represent a
subset of the genome of their ancestors, these gamma-proteo-
bacteria remain closely related to Escherichia coli (98% of the
genes in Buchnera have clear orthologues in E. coli). Accord-
ingly, the process of genome shrinkage that these species have
undergone has been well documented in terms of the evolu-
tion of the corresponding protein families [1,2].
Recent research indicates that the capacity of an organism for
adaptation depends not only on the properties of its individ-
ual molecular components, but also on the structure and
organization of its underlying network of molecular interac-
tions. Indeed, it was recently proposed that the modular
organization of the network of interactions is necessary to
adapt to changing environments [5]. In such a modular
Published: 28 May 2007
Genome Biology 2007, 8:R94 (doi:10.1186/gb-2007-8-5-r94)
Received: 28 July 2006
Revised: 30 January 2007
Accepted: 28 May 2007
The electronic version of this article is the complete one and can be
found online at />R94.2 Genome Biology 2007, Volume 8, Issue 5, Article R94 Tamames et al. />Genome Biology 2007, 8:R94
system, the compartmentalization of a set of interactions that
are both closely interconnected and remain weakly connected
to other components in the artificial environment increases.
Accordingly, the organization into so-called modules is
favored by constant changes in environmental conditions,
highlighting the direct causal relationship between such
changes and the increase in network modularity. Neverthe-
less, this proposal awaits a direct assessment in a real biolog-
ical system.
Studies on the organization and properties of protein net-
works have flourished recently thanks to data from high-
throughput experiments, for example, two-hybrid screens,
pull-down experiments and ChIP-on-chip studies [6-10].
Despite limitations in terms of the extent and quality of the
datasets, the results produced have been fundamental in ena-
bling the first studies of network structure to be carried out
[7,11]. Such studies have involved the comparison of networks
from different origins [12] and the construction of the first
models of network behavior and evolution [13,14].
Taking advantage of the two recently published high-
throughput protein interaction maps of E. coli [9,15], we have
performed a study in which we focused on the reductive evo-
lution of the Buchnera genome. The comparison between the
E. coli and Buchnera interaction networks was based on the
assumed low rate of protein interaction turnover [16] and the
weak probability that new interactions would be generated in
the restricted conditions in which Buchnera lives. Accord-
ingly, it can be assumed that when proteins are conserved
between E. coli and Buchnera, the protein interactions are
also likely to be maintained [17]. Therefore, the direct rela-
tionship between the genomes, the clear conservation of pro-
teins and the probable similarity of their interactions
provides a perfect scenario to assess the consequences of
adaptation to a stable and nutrient-rich environment.
E. coli is a free-living bacteria known to be capable of adapt-
ing to very different environments [18-20]. In contrast, Buch-
nera is an endosymbiotic bacteria living in a very stable
medium. As a result, we would expect the E. coli network to
be more modular than that of Buchnera. Hence, reductive
evolution might be responsible not only for decreasing the
gene repertoire of Buchnera, but also for reducing its network
modularity. This hypothesis can be tested by comparing the
organization of the protein-protein interaction networks of
these two species.
Results and discussion
Modular structure of the E. coli network
Modules are set of components (proteins) with a clear imbal-
ance in favor of internal versus external connections. There-
fore, the modularity of a network can be quantified by
comparing the number of connections within and between
modules. Consequently, the main problem when defining
modules is the search for the optimal division of the network
that maximizes the ratio between intra- and inter-module
connectivities. Several algorithms have been proposed to
carry out the task of decomposing networks into their modu-
lar components [21-24]. We have used two recently proposed
algorithms [23,24] that have been shown to produce optimal
decomposition of biological networks. Since both algorithms
are based on different approaches, and two different maps of
protein-protein interactions of E. coli are available [9,15], the
validity of the conclusions is relatively independent of the
method and the data source. It is important to realize that the
values of the modularity coefficients have to be normalized/
corrected with respect to the modularity expected in equiva-
lent random networks of the same connectivity, thereby elim-
inating the effect that the pattern of connections in the
network could have on the calculation of its modularity (see
Materials and methods).
The results of analyzing the structure of the E. coli network
show that it is most modular at any level, irrespective of the
clustering methods used (see Table S3 in Additional data file
1 for descriptions and results obtained using other clustering
approaches for determining modularity). The optimal
decompositions render between 10 and 15 modules (Table 1),
most of them significant from a functional point of view (see
Materials and methods). Some of the modules are quite
homogeneous and contain easily discernible functions, that
is, protein synthesis (including ribosomal proteins), tran-
scription (RNA polymerase), cell division, DNA synthesis
(DNA polymerase), or DNA maintenance, corresponding well
to the empirical analysis of the original dataset established by
Butland et al. [9]. These modules account for more than half
of the modularity in the network (Table S1 in Additional data
file 1). Other modules contribute less to the global modularity
and are composed of proteins with more diverse functions.
The overall structure of the network indicates the existence of
a central core that is clearly organized into modules of protein
interactions, while many other functions or activities associ-
ated with this core display less modular structure.
The potential Buchnera protein interaction network was
obtained by maintaining the connections between the orthol-
ogous proteins in E. coli. The modular decomposition of the
resulting network shows that the Buchnera network was
always significantly less modular than that of E. coli (Table 1).
The decrease in the modularity coefficient implies that the
network obtained for Buchnera is much harder to separate
into isolated components than that of E. coli. Therefore, we
concluded that the process of reducing the genome size
(reductive evolution) creates a less compartmentalized net-
work with a smaller degree of modularity.
An alternative approach is to study the process of module
reduction maintaining the modular structure obtained for E.
coli but deleting the proteins that do not have orthologues in
Buchnera. In this way, the reduction of the modules originally
Genome Biology 2007, Volume 8, Issue 5, Article R94 Tamames et al. R94.3
comment reviews reports refereed researchdeposited research interactions information
Genome Biology 2007, 8:R94
defined in E. coli can be assessed. We found that the ensuing
'constrained' decomposition of the Buchnera network is also
less modular than that of E. coli. Indeed, the modularity
observed is similar to that observed when the Buchnera net-
work was decomposed independently (Table 1). Furthermore,
with the exception of the module containing ribosomal pro-
teins, the modules in the 'constrained' network are signifi-
cantly smaller than those in E. coli. The deletion involves
between 70% and 91% of the nodes and, interestingly, the set
of conserved nodes often consists of those involved in the
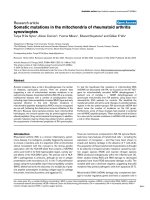
connection between modules (Figure 1).
Nevertheless, the coefficients are low in all cases. In E. coli,
they are around 0.1, indicating little modularity (high modu-
larity is achieved when the coefficient reaches values around
0.3). The coefficients are close to zero in all Buchnera net-
works, indicating that modularity has been almost completely
lost in these networks.
The role of the nodes in the reduction of the modular
structure of the network
The connections between modules in the E. coli network are
dominated by non-hub connectors, that is, nodes with an
average number of links within their module but that are well
connected to other modules [23]. These nodes account for
more than 80% of the connections between modules. The
remaining connections are made by connector hubs with
strong links both within and between modules but that are, in
turn, weakly connected between themselves (examples of
connector hubs are peptidyl-prolyl cis/trans isomerase tig
and pyruvate dehydrogenase aceE). This is characteristic of a
feature known as dissortativity [11], which has been docu-
mented in several other biological networks[21]. There is
extensive communication between modules in the E. coli net-
work and this is mainly based on the links provided by non-
hub connectors.
In the constrained reduced Buchnera network, it is apparent
that the number of peripheral nodes has diminished. While
there was less than average loss of non-hub connectors, con-
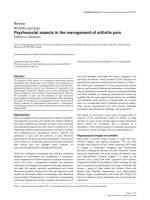
nector hubs were almost completely preserved (Figure 2).
Therefore, connector hubs appear to create a highly preserved
backbone of interactions. This emphasizes the crucial impor-
tance of connector hubs in maintaining the integrity of the
protein network, in contrast to the findings from studies of
metabolic networks [21].
Table 1
Values of modularity for E. coli and Buchnera networks
Dataset Modules and validation Q
real
Q
rand
Q
norm
(Q
real
- Q
rand
)
Newman algorithm
E. coli, Butland dataset 12 (5/10) 0.346 0.244 0.102
Buchnera, Butland dataset 7 (3/7) 0.259 0.232 0.027
Buchnera constrained, Butland dataset 7 (2/6) 0.182 0.168 0.014
E. coli, Arifuzzaman dataset 15 (8/13) 0.409 0.329 0.080
Buchnera, Arifuzzaman dataset 10 (4/9) 0.460 0.423 0.037
Buchnera constrained, Arifuzzaman dataset 12 (4/10) 0.274 0.265 0.009
E. coli, STRING 33 (32/32) 0.670 0.209 0.461
Buchnera, STRING 12 (11/11) 0.581 0.272 0.309
Buchnera constrained, STRING 14 (11/11) 0.493 0.210 0.283
Guimerá algorithm
E. coli, Butland dataset 10 (7/10) 0.357 0.248 0.109
Buchnera, Butland dataset 6 (3/5) 0.263 0.237 0.026
Buchnera constrained, Butland dataset 8 (2/7) 0.192 0.179 0.013
E. coli, Arifuzzaman dataset 12 (6/11) 0.413 0.332 0.081
Buchnera, Arifuzzaman dataset 8 (4/8) 0.461 0.432 0.029
Buchnera constrained, Arifuzzaman dataset 11 (2/8) 0.266 0.242 0.024
E. coli, STRING 19 (17/17) 0.669 0.211 0.458
Buchnera, STRING 11(10/10) 0.566 0.277 0.289
Buchnera constrained, STRING 9 (7/7) 0.489 0.231 0.258
Modularity is calculated using different algorithms as described in the text for the E. coli and Buchnera networks. The module validation is indicated
between parentheses after the number of modules for each network and this provides information on the number of modules that are statistically
significant with regards to the STRING data (see text for details). For instance, 5/10 means that five out of ten modules are significant in terms of
STRING interactions. The number of modules validated is sometimes different to the total number of modules, since some modules are too small to
be statistically assessed. When using STRING-derived networks, all modules can be validated since the same information was used to construct the
network. The table also shows the modularity coefficient (Q) for real and randomized networks, and the normalized modularity coefficient, resulting
from the subtraction of the modularity coefficients for real and random modules.
R94.4 Genome Biology 2007, Volume 8, Issue 5, Article R94 Tamames et al. />Genome Biology 2007, 8:R94
The reduction of network modularity and of the overall
properties of the network
Reduction of modularity affects certain topological aspects of
the network. For simplicity, we restrict our analysis to the
results for the Butland dataset, since the results for the Ari-
fuzzaman [15] dataset are very similar. The analysis of con-
nectivity shows that the E. coli and Buchnera networks follow
a power-law distribution with exponents (
γ
) of 2.25 for E. coli
and 2.03 for Buchnera. The smaller exponent in Buchnera
indicates that hubs are more prevalent in the network, since
they are in contact with a larger proportion of nodes. This
highlights the relevance of connector hubs, which produce a
more compact network in Buchnera, as reflected by the aver-
age number of links per node (6.07 link per node in Buchnera
versus 4.16 in E. coli) and the smaller diameter of the Buchn-
era network (2.821 versus 3.607 for E. coli). Both networks
are almost completely connected, which means that there are
very few nodes in islands not linked to the main component.
In both networks, isolated nodes constitute just 2% of the
total number of nodes. Additionally, the length of the paths
crossing the network remains unaltered, and only 60 of a pos-
sible 37,408 paths were longer in Buchnera than in E. coli,
with a difference of just one node. Therefore, rather than frag-
menting the network, the removal of nodes and links in the
Buchnera network maintains the global topology of the net-
work, preserving the main interaction backbone. The prefer-
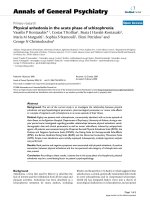
View of three modules of the E. coli networkFigure 1
View of three modules of the E. coli network. The blue module corresponds to cell division and chaperones. The red module is related to RNA
polymerase and the green module involves DNA metabolism. The size of the nodes indicates their absolute degree or number of connections. Conserved
nodes in Buchnera are shown in darker colors, while conserved connections are shown in thick black lines. Connector hubs are completely conserved,
whereas non-hub connectors are deleted in some instances.
hslU
dnaJ
ftsA
gyrA
ftsZ
mreB
rpoC
rpoA
rpoB
nusG
rpoD
nusA
aceE
lpd
aceF
recB
recD
rnhA
Genome Biology 2007, Volume 8, Issue 5, Article R94 Tamames et al. R94.5
comment reviews reports refereed researchdeposited research interactions information
Genome Biology 2007, 8:R94
ential deletion of connections between peripheral nodes that
lie outside of the core of the network creates an apparent
enrichment of densely connected motifs in Buchnera, partic-
ularly when the relative proportions are considered (Table S1
in Additional data file 1).
When nodes were randomly removed from the E. coli net-
work until it reached a size equivalent to that of Buchnera, the
organization of the network was completely lost. The result-
ing network is fragmented into a myriad of small components
(islands), each with few isolated nodes. This is an important
indication of how node deletion during reductive evolution
has been accomplished in a controlled manner that preserves
the network organization and the cross-talk between the
remaining processes.
Conclusion
We compare the structure of two independent sets of experi-
mentally derived interactions for E. coli with the deduced
structure of interactions for the closely related Buchnera
genome. Thus, the reductive evolution followed by Buchnera,
whereby more than 90% of the ancestral genes have been lost,
is correlated with the loss of modularity of the protein inter-
action network. Nevertheless, the rest of the characteristics of
the network in Buchnera essentially remain unchanged.
These observations provide an initial model to understand
reductive evolution, adaptation to environments and network
organization. As in previous analyses of network structure, it
is clear that, in this early phase, the models will benefit greatly
from additional information from other genomes, and from
an overall improvement in the quality of the proteomic exper-
iments. Nevertheless, even bearing these limitations in mind,
it is possible to see how the reduced modularity in the Buch-
nera genome is caused by the partial deletion of nodes in
regions that are connected to dense clusters of essential func-
tions in the E. coli protein interaction network. This is dem-
onstrated by measuring the modularity in the reduced
network. In contrast to what would be expected if the prefer-
entially deleted genes were those participating in a non-mod-
ular part of the E. coli network, the modularity decreased with
respect to the E. coli network.
The E. coli network is apparently composed of a modular core
and a mostly non-modular peripheral region. This could
imply that, at this level, modular structures are not determi-
nant for the evolution of the network. Reduction of modular-
ity is not achieved by the removal of entire modules (which
could even produce an increase in the modularity coefficient),
but rather by selective deletion of nodes in the modular parts
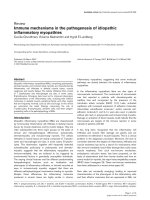
of the network (Figure 3). In other words, the process of
genome reduction apparently involves deleting peripheral
regions of the network and the selective loss of proteins form-
ing part of densely packed clusters that are separated into
modules. However, it affects the proteins directly implicated
in maintaining the connections between modules to a much
smaller extent (Figure 2). The result is a very compact net-
work with a smaller diameter, a conserved backbone and an
increase in the proportion of densely connected motifs, as
well as the preservation of characteristics such as path length
and network topology. The way to maintain or increase mod-
ularity in reduced networks would be to remove connections
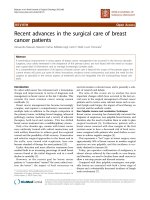
Density map of the role of the nodes in the E. coli network that are conserved or deleted in Buchnera, according to the procedure described in [23]Figure 2
Density map of the role of the nodes in the E. coli network that are
conserved or deleted in Buchnera, according to the procedure described in
[23]. The degree of participation measures the connection of a given node
with the nodes from modules other than its own. The within-module
degree measures the connection of the node with other nodes within its
own module. Peripheral nodes show both low participation and low
within-module degree. Non-hub connectors participate significantly and
with a low degree of within-module connections, while connector hubs
have both high participation and high degree of within-module connections
[23]. Connector hubs and non-hub connectors are mainly conserved in
the Buchnera network, while the deletion of nodes mainly affects
peripheral nodes. The measures are calculated as in [23], based on the
modular division of the E. coli network obtained from the Butland dataset.
The scale refers to the number of nodes in each position.
Non-hub connectors
Peripheral
Connector hubs
Deleted nodes
Within-module degree
Participation
Peripheral
Non-hub connectors
Connector hubs
Participation
Within-module degree
Conserved nodes
R94.6 Genome Biology 2007, Volume 8, Issue 5, Article R94 Tamames et al. />Genome Biology 2007, 8:R94
between modules and, therefore, communication between
processes, which could be highly deleterious. Our conclusion
is that the loss of modularity in Buchnera networks seems to
be mainly related to the conservation of the network back-
bone, rather than resulting from the loss of adaptability to
environmental conditions.
These results might be important in the context of the evolu-
tionary implications of network structure. It has been sug-
gested that the organization of biological networks
(interaction and control networks) is a direct product of the
simple process of gene duplication and deletion, and that it is
not directly subjected to natural selection [16]. The appar-
ently non-random reduction of the modular structure of the
networks and the retention of essential characteristics of the
interaction network indicate that the roles of proteins within
the interaction network are important in the reductive proc-
ess. Accordingly, the importance of the roles of the proteins
must be taken into consideration when discussing the effect
of the natural selection on the organization of protein
networks.
Materials and methods
Protein-protein interaction data for E. coli were obtained as
described in the original studies [9,15].
The first study [9] is based on yeast-based tandem affinity
purification (TAP) adapted to E. coli. In this procedure, 1,000
E. coli open reading frames were tagged (22% of the genome)
and their interactions with other proteins within this set were
determined. It was possible to determine 5,254 protein-pro-
tein interactions, involving 1,264 proteins (Butland dataset).
To our knowledge, this was the first set of E. coli protein-pro-
tein interaction data determined by high-throughput
procedures.
The second study [15] was based on producing His-tagged
bait proteins; after co-purifying the interacting bait and prey
proteins on a Ni
2+
-NTA column, they were identified by mass
spectrometry. There were 4,339 E. coli proteins tested, for
which 11,511 interactions were determined. The authors pro-
vided a reliable set of 8,893 of these interactions, involving
2,821 proteins, which were reproducible in the original study
(Arifuzzaman dataset). The reliable set was the one used by us
in this study.
While both datasets share 983 proteins, only 168 interactions
are present in both sources, a situation similar to that
observed in yeast [25].
For E. coli proteins, orthologues in B. aphidicola strain APS
(RefSeq NC_002528) were identified by perfoming BLASTP
homology searches. To correctly identify orthologues, both
proteins must fulfill the following criteria: one is the best hit
of the other (best bi-directional hits); the BLASTP E-value
must be above 1e-15; and the alignment must span at least
80% of the residues in both proteins. Considering complete
genomes, we were able to identify E. coli orthologues for 98%
of Buchnera proteins, while around 90% of E. coli protein-
coding genes have been deleted from the Buchnera genome
(E. coli strain K-12 contains 4,243 genes; Buchnera has 564
genes). For the two sources of data (1,264 E. coli proteins in
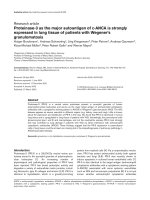
Deletion of interactions may produce reduced modularityFigure 3
Deletion of interactions may produce reduced modularity. Three modules
(red, yellow, blue) are shown, surrounded by a non-modular region. Even
if the reduction is higher in peripheral nodes (non-modular region),
modularity may decrease since the module structure is lost and only the
backbone remains.
Reductive
evolution
Genome Biology 2007, Volume 8, Issue 5, Article R94 Tamames et al. R94.7
comment reviews reports refereed researchdeposited research interactions information
Genome Biology 2007, 8:R94
the Butland dataset and 2,821 in the Arifuzzaman dataset),
we identified 278 and 260 orthologues in the proteome of
Buchnera, respectively.
The protein-protein interaction network in Buchnera was
generated by mapping E. coli interactions between conserved
proteins in Buchnera. The removal of nodes (proteins)
implies the removal of all links attached to them. This creates
a network of 1,638 interaction pairs for the Butland dataset
and 549 for the Arifuzzaman dataset, implying that the latter
is enriched in interactions between proteins that are not con-
served in Buchnera.
We also created a third network based on data from the
STRING database [26,27]. STRING contains known and
inferred relationships between E. coli proteins derived using
diverse methods. The version of STRING used in this work
involves 3,868 proteins implicated in 33,733 relationships,
and it does not include the data from the other two sources.
Thus, it comprises an independent set of interactions that can
be used to validate the modular decomposition of the
networks.
For the networks, the node degree was measured as the
number of links for each node. Links were non-directional
and corresponded to protein-protein interactions. Protein
motifs were identified as described previously [12]. The path
length (l) between all pairs of nodes was calculated using a
standard Dijstra algorithm.
A module is defined as a part of the network with abundant
connections between the nodes within it, and less connected
to nodes outside the module. The ratio between these two
measures (connections within the module and with other
modules) defines the modularity coefficient Q. The modular-
ity coefficient was calculated as the fraction of edges in the
network that connect the nodes in a module minus the
expected value of the same quantity in a network, with the
same assignment of nodes in modules but with random con-
nections between nodes [5,22,23]:
where K is the number of modules, L is the number of edges
in the network, l
s
is the number of edges between nodes in
modules, and d
5
is the sum of the degrees of the nodes in mod-
ule s. Since modularity is possibly affected by the different
size or connectivity of the networks, it is advisable to normal-
ize this measure with respect to the modularity of random
networks with the same connectivity. These random net-
works are generated by swapping the connections between
pairs of nodes. For instance, if the real network contains the
interactions A-B and C-D, the randomized network will con-
tain A-D and B-C. In this way, the random network maintains
node degrees and connectivity.
Several algorithms have been proposed to extract modules
from networks. To test the validity of our conclusions, we
used two different methods to calculate modules and modu-
larity coefficients. The algorithm of Guimerá and Nunes-
Amaral [23] is based on a simulated annealing procedure,
and it has been successfully used to decompose metabolic
networks. Newman's algorithm [24] is based on the spectral
decomposition of the eigenvectors of a modularity matrix
derived from the interactions between nodes. Both methods
claim to obtain optimal decomposition of the networks, and
the results using both algorithms are very similar (Table 1).
Guimerá's algorithm achieves slightly higher modularities,
while Newman's algorithm is considerably faster, especially
when dealing with big networks. The analysis of the resulting
modules shows that both decompositions are similar, with
70% of the interactions belonging to the same modules. The
normalized modularity coefficients are very close, regardless
of the algorithm or the data source used, indicating that they
are robust and not influenced by such factors.
Since we wanted to inspect the conservation of modularity
when the network is reduced, the modularity of Buchnera's
networks was calculated either by generating a new modular
decomposition for Buchnera, or using the same modular
decomposition obtained for E. coli such that the modules
were maintained while the nodes and interactions not present
in Buchnera were removed. In this way, we are able to study
the way in which original modules are reduced.
To check the quality and functional relevance of modules, we
used data from the STRING database [26,27]. Modules with
functional significance would be expected to be enriched in
these interactions. Therefore, we calculated the total number
of interactions per pair of proteins in STRING and, accord-
ingly, the number of interactions per pair that would be
expected within each of the modules in the network based on
the size of the module. We consider that the module is
validated if it is significantly enriched in STRING interactions
(p value < 0.1).
The networks were plotted with the Cytoscape software [28].
The evaluation of functions over-represented in each of the
modules (using Gene Ontology [29] 'biological process' cate-
gory) was performed using the BiNGO plug-in [30]
Additional data files
The following additional data are available with the online
version of this paper. Additional data file 1 includes supple-
mentary tables: Table S1 lists the composition of the main
modules in E. coli, for the modular decomposition of the But-
land dataset using Guimerá's algorithm; Table S2 shows the
different motifs with three or four nodes found in the real net-
Q
l
L
d
L
Ss
s
K
=−
⎛
⎝
⎜
⎞
⎠
⎟
⎡
⎣
⎢
⎢
⎤
⎦
⎥
⎥
=
∑
2
2
1
R94.8 Genome Biology 2007, Volume 8, Issue 5, Article R94 Tamames et al. />Genome Biology 2007, 8:R94
works and randomized networks; Table S3 shows the results
of the modular decomposition of the Butland dataset by
means of a k-means clustering algorithm, as an additional
confirmation of the validity of the results; Table S4 lists the
main conserved hubs in Buchnera, and their functions in the
Butland dataset. Additional data file 2 shows the relationship
between the connectivity of the nodes and their deletion in
Buchnera's network (Butland dataset), and the probability of
the deletion of nodes as a function of the probable number of
connections. Additional data file 3 illustrates three examples
of hub deletion in Buchnera.
Additional data file 1Supplementary tablesTable S1 lists the composition of the main modules in E. coli, for the modular decomposition of the Butland dataset using Guimerá's algorithm. Table S2 shows the different motifs with three or four nodes found in the real networks and randomized networks. Table S3 shows the results of the modular decomposition of the Butland dataset by means of a k-means clustering algorithm, as an addi-tional confirmation of the validity of the results. Table S4 lists the main conserved hubs in Buchnera, and their functions in the But-land dataset.Click here for fileAdditional data file 2Relationship between the connectivity of the nodes and their dele-tion in Buchnera's network (Butland dataset), and the probability of the deletion of nodes as a function of the probable number of connectionsRelationship between the connectivity of the nodes and their dele-tion in Buchnera's network (Butland dataset), and the probability of the deletion of nodes as a function of the probable number of connections.Click here for fileAdditional data file 3Three examples of hub deletion in BuchneraThree examples of hub deletion in Buchnera.Click here for file
Acknowledgements
JT wishes to acknowledge Roger Guimerá and Mark Newman. JT is the
recipient of a contract from the FIS programme, ISCIII, Ministerio de Sani-
dad y Consumo (Spain). This work has been supported by grant BMC2003-
00305 from Ministerio de Educación y Ciencia (Spain), to A.M., and EU
grants DIAMONDS: LSHG-CT-2004-512143 and EMERGENCE, to A.V.
References
1. van Ham RC, Kamerbeek J, Palacios C, Rausell C, Abascal F, Bastolla
U, Fernandez JM, Jimenez L, Postigo M, Silva FJ, et al.: Reductive
genome evolution in Buchnera aphidicola. Proc Natl Acad Sci USA
2003, 100:581-586.
2. Shigenobu S, Watanabe H, Hattori M, Sakaki Y, Ishikawa H: Genome
sequence of the endocellular bacterial symbiont of aphids
Buchnera sp. APS. Nature 2000, 407:81-86.
3. Gil R, Silva FJ, Zientz E, Delmotte F, Gonzalez-Candelas F, Latorre A,
Rausell C, Kamerbeek J, Gadau J, Holldobler B, et al.: The genome
sequence of Blochmannia floridanus : comparative analysis of
reduced genomes. Proc Natl Acad Sci USA 2003, 100:9388-9393.
4. Akman L, Yamashita A, Watanabe H, Oshima K, Shiba T, Hattori M,
Aksoy S: Genome sequence of the endocellular obligate sym-
biont of tsetse flies, Wigglesworthia glossinidia. Nat Genet 2002,
32:402-407.
5. Kashtan N, Alon U: Spontaneous evolution of modularity and
network motifs. Proc Natl Acad Sci USA 2005, 102:13773-13778.
6. Ito T, Chiba T, Ozawa R, Yoshida M, Hattori M, Sakaki Y: A compre-
hensive two-hybrid analysis to explore the yeast protein
interactome. Proc Natl Acad Sci USA 2001, 98:4569-4574.
7. Lee TI, Rinaldi NJ, Robert F, Odom DT, Bar-Joseph Z, Gerber GK,
Hannett NM, Harbison CT, Thompson CM, Simon I, et al.: Tran-
scriptional regulatory networks in Saccharomyces cerevisiae.
Science 2002, 298:799-804.
8. Giot L, Bader JS, Brouwer C, Chaudhuri A, Kuang B, Li Y, Hao YL,
Ooi CE, Godwin B, Vitols E, et al.: A protein interaction map of
Drosophila melanogaster. Science 2003, 302:1727-1736.
9. Butland G, Peregrin-Alvarez JM, Li J, Yang W, Yang X, Canadien V,
Starostine A, Richards D, Beattie B, Krogan N, et al.: Interaction
network containing conserved and essential protein com-
plexes in Escherichia coli
. Nature 2005, 433:531-537.
10. Gavin AC, Aloy P, Grandi P, Krause R, Boesche M, Marzioch M, Rau
C, Jensen LJ, Bastuck S, Dumpelfeld B, et al.: Proteome survey
reveals modularity of the yeast cell machinery. Nature 2006,
440:631-636.
11. Barabasi AL, Oltvai ZN: Network biology: understanding the
cell's functional organization. Nat Rev Genet 2004, 5:101-113.
12. Milo R, Shen-Orr S, Itzkovitz S, Kashtan N, Chklovskii D, Alon U:
Network motifs: simple building blocks of complex
networks. Science 2002, 298:824-827.
13. Guelzim N, Bottani S, Bourgine P, Kepes F: Topological and causal
structure of the yeast transcriptional regulatory network.
Nat Genet 2002, 31:60-63.
14. Luscombe NM, Babu MM, Yu H, Snyder M, Teichmann SA, Gerstein
M: Genomic analysis of regulatory network dynamics reveals
large topological changes. Nature 2004, 431:308-312.
15. Arifuzzaman M, Maeda M, Itoh A, Nishikata K, Takita C, Saito R, Ara
T, Nakahigashi K, Huang HC, Hirai A, et al.: Large-scale identifica-
tion of protein-protein interaction of Escherichia coli K-12.
Genome Res 2006, 16:686-691.
16. Wagner A: How the global structure of protein interaction
networks evolves. Proc Biol Sci 2003, 270:457-466.
17. Pal C, Papp B, Lercher MJ, Csermely P, Oliver SG, Hurst LD: Chance
and necessity in the evolution of minimal metabolic
networks. Nature 2006, 440:667-670.
18. Blattner FR, Plunkett G 3rd, Bloch CA, Perna NT, Burland V, Riley M,
Collado-Vides J, Glasner JD, Rode CK, Mayhew GF, et al.: The com-
plete genome sequence of Escherichia coli K-12. Science 1997,
277:1453-1474.
19. Hayashi T, Makino K, Ohnishi M, Kurokawa K, Ishii K, Yokoyama K,
Han CG, Ohtsubo E, Nakayama K, Murata T, et al.: Complete
genome sequence of enterohemorrhagic Escherichia coli
O157:H7 and genomic comparison with a laboratory strain
K-12. DNA Res 2001, 8:11-22.
20. Chen SL, Hung CS, Xu J, Reigstad CS, Magrini V, Sabo A, Blasiar D,
Bieri T, Meyer RR, Ozersky P, et al.: Identification of genes sub-
ject to positive selection in uropathogenic strains of
Escherichia coli : a comparative genomics approach. Proc Natl
Acad Sci USA 2006, 103:5977-5982.
21. Rives AW, Galitski T: Modular organization of cellular
networks. Proc Natl Acad Sci USA 2003, 100:1128-1133.
22. Newman ME, Girvan M: Finding and evaluating community
structure in networks. Phys Rev E Stat Nonlin Soft Matter Phys 2004,
69:026113.
23. Guimerá R, Nunes-Amaral LA: Functional cartography of com-
plex metabolic networks. Nature 2005, 433:895-900.
24. Newman ME: Modularity and community structure in
networks. Proc Natl Acad Sci USA 2006, 103:8577-8582.
25. Mrowka R, Patzak A, Herzel H: Is there a bias in proteome
research? Genome Res 2001, 11:1971-1973.
26. von Mering C, Jensen LJ, Snel B, Hooper SD, Krupp M, Foglierini M,
Jouffre N, Huynen MA, Bork P: STRING: known and predicted
protein-protein associations, integrated and transferred
across organisms. Nucleic Acids Res 2005, 33:D433-437.
27. STRING Database []
28. Cytoscape []
29. Harris MA, Clark J, Ireland A, Lomax J, Ashburner M, Foulger R, Eil-
beck K, Lewis S, Marshall B, Mungall C, et al.: The Gene Ontology
(GO) database and informatics resource. Nucleic Acids Res
2004, 32:D258-261.
30. Maere S, Heymans K, Kuiper M: BiNGO: a Cytoscape plugin to
assess overrepresentation of gene ontology categories in
biological networks.
Bioinformatics 2005, 21:3448-3449.