Báo cáo y học: "Mixture modeling of transcript abundance classes in natural populations" ppsx
Bạn đang xem bản rút gọn của tài liệu. Xem và tải ngay bản đầy đủ của tài liệu tại đây (523.39 KB, 14 trang )
Genome Biology 2007, 8:R98
comment reviews reports deposited research refereed research interactions information
Open Access
2007Hsiehet al.Volume 8, Issue 6, Article R98
Research
Mixture modeling of transcript abundance classes in natural
populations
Wen-Ping Hsieh
*†
, Gisele Passador-Gurgel
*
, Eric A Stone
‡
and Greg Gibson
*
Addresses:
*
Department of Genetics, Gardner Hall, North Carolina State University, Raleigh, North Carolina 27695-7614, USA.
†
Department of
Statistics, 825 General Building III, National Tsing Hua University, Kuang-Fu Road, Hsinchu, 30013, Taiwan.
‡
Department of Statistics, and
Bioinformatics Research Center, 1500 Partners II Building, 840 Main Campus Drive, North Carolina State University, Raleigh, North Carolina
27695, USA.
Correspondence: Greg Gibson. Email:
© 2007 Hsieh et al.; licensee BioMed Central Ltd.
This is an open access article distributed under the terms of the Creative Commons Attribution License ( which
permits unrestricted use, distribution, and reproduction in any medium, provided the original work is properly cited.
Bimodal transcript variation in populations<p>Expression profiling of <it>Drosophila melanogaster </it>adult female heads for 108 nearly isogenic lines from two different popula-tions, and of CEPH lymphoblastoid lines, shows that differential expression of transcripts among individuals is due to a complex interplay of cis- and trans-acting factors.</p>
Abstract
Background: Populations diverge in genotype and phenotype under the influence of such
evolutionary processes as genetic drift, mutation accumulation, and natural selection. Because
genotype maps onto phenotype by way of transcription, it is of interest to evaluate how these
evolutionary factors influence the structure of variation at the level of transcription. Here, we
explore the distributions of cis-acting and trans-acting factors and their relative contributions to
expression of transcripts that exhibit two or more classes of abundance among individuals within
populations.
Results: Expression profiling using cDNA microarrays was conducted in Drosophila melanogaster
adult female heads for 58 nearly isogenic lines from a North Carolina population and 50 from a
California population. Using a mixture modeling approach, transcripts were identified that exhibit
more than one mode of transcript abundance across the samples. Power studies indicate that
sample sizes of 50 individuals will generally be sufficient to detect divergent transcript abundance
classes. The distribution of transcript abundance classes is skewed toward low frequency minor
classes, which is reminiscent of the typical skew in genotype frequencies. Similar results are
observed in reported data on gene expression in human lymphoblast cell lines, in which analysis of
association with linked polymorphisms implies that cis-acting single nucleotide polymorphisms
make only a modest contribution to bimodal distributions of transcript abundance.
Conclusion: Population surveys of gene expression may complement genetical genomics as a
general approach to quantifying sources of transcriptional variation. Differential expression of
transcripts among individuals is due to a complex interplay of cis-acting and trans-acting factors.
Background
It is well known that the structure of genetic and phenotypic
variation within and between populations is affected in a
complex manner by drift, migration, mutation, and selection.
Because the genotype is connected to the phenotype via tran-
script abundance, it behooves us to attempt to ascertain the
population structure of transcriptional variation as well.
Although robust theory exists describing the expected
Published: 4 June 2007
Genome Biology 2007, 8:R98 (doi:10.1186/gb-2007-8-6-r98)
Received: 11 January 2007
Revised: 16 April 2007
Accepted: 4 June 2007
The electronic version of this article is the complete one and can be
found online at />R98.2 Genome Biology 2007, Volume 8, Issue 6, Article R98 Hsieh et al. />Genome Biology 2007, 8:R98
distribution of genotypic variation under a variety of evolu-
tionary scenarios [1-3], there is no theory describing the
expected distribution of transcriptional variation, and neither
are there many empirical data in this regard.
Numerous studies conducted in a range of species have dem-
onstrated that transcript abundance typically exhibits moder-
ate to high heritability [4-6]. Differential expression in the
range of 1.5-fold to 2-fold between any two individuals is
often seen for at least 10% of transcripts, whereas as many as
one half of all transcripts may be variable in a large sample of
individuals. Expression quantitative trait locus (QTL) studies
demonstrate a genetic component to much of this variation
that is due both to cis-acting and trans-acting factors, and fre-
quently more than 25% of the transcriptional variance can be
attributed to single regulatory QTLs (for review [7,8]).
Because it is now believed that regulatory polymorphism is
prevalent in eukaryotic genomes [9], it follows that there is
ample opportunity for the distribution of transcript abun-
dance to diverge between populations within a species [10,11].
The rate of divergence should be proportional to the level of
variation within populations, and this observation motivates
the development of quantitative measures of transcriptional
variation among individuals.
Transcriptional population structure can be described using
parameters that capture the mean, range, variance, and skew-
ness of the frequency distribution of each transcript meas-
ured by microarray analysis of individuals or inbred lines.
Whereas allele frequencies involve discrete entities, namely
single nucleotide polymorphisms (SNPs) or indels, that can
be counted and compared, transcript abundance is continu-
ous. It is therefore subject to measurement error, and robust
statistical approaches are needed to compare distributions,
preferably using likelihood-based measures. It turns out that
measurement of the descriptive parameters is strongly
affected by experimental methods as well as analytical
approaches such as normalization methods, and conse-
quently epistemologic issues must be confronted in the
description of transcriptional population structure.
To the extent that transcript abundance is strongly affected by
major regulatory factors, it may also be possible to observe
bimodal or even multimodal distributions. The relative
weight of these modes should vary among populations as a
result of divergence in allele frequency of the regulatory fac-
tors. Thus, if a promoter polymorphism that reduces tran-
scription measurably in homozygotes is at a frequency of 0.2
in one population and 0.5 in another, then the relative abun-
dance of the low transcript abundance class will be expected
to be less than 5% in the first and as much as 25% in the sec-
ond population. Depending on the degree of dominance of the
effect, two or three 'transcript abundance classes' (TACs) will
be detected. If the regulatory polymorphism affects the abun-
dance or activity of a trans-acting factor, then the abundance
of numerous target genes should be affected in parallel,
resulting in 'transcriptional cliques' that exhibit correlated
patterns of gene expression across a sample of individuals [6].
In this report we document the existence of TACs in a large
sample of two North American populations of Drosophila
melanogaster, as well as in previously published data on gene
expression in lymphoblast cell lines from the Centre d'Etude
du Polymorphisme Humain (CEPH) grandparents [12,13]
(also see the CEPH website [14]). In both cases the distribu-
tion of minor TAC frequencies is observed to approximate the
expected distribution of allele frequencies under an infinite
sites model, because there is an excess of minor TACs with
frequencies less than 10%. This observation is consistent with
the hypothesis that a considerable proportion of transcrip-
tional variation might be attributed to segregating neutral or
nearly neutral alleles, but follow-up association tests in the
CEPH data indicate that only a small proportion of the bimo-
dality is actually attributable to cis-acting polymorphisms.
Population profiling should be considered a complement to
genetical genomics [8] for dissecting the quantitative genetics
of gene expression.
Results
Transcriptional divergence between North Carolina
and California populations
Population-based gene expression profiling of adult female
Drosophila heads was performed using cDNA microarrays, as
part of a study of the quantitative genetic basis for nicotine
resistance in Drosophila melanogaster [15]. A total of 216
hybridizations were performed, with each array contrasting
RNA from control and nicotine-treated flies derived from two
different lines from either a North Carolinian (NC) sample of
58 lines or a Californian (CA) sample of 50 lines. A rand-
omized loop design [16] was used with just two replicates of
each line and drug treatment, one for each of the Cy3 and Cy5
fluorescent dyes. Each array contains 4,385 unique expressed
sequence tag amplicons that were initially isolated by the Ber-
keley Drosophila Genome Project [17].
Following quality control and normalization (as described in
Materials and methods [see below]), two-way hierarchical
clustering was performed to visualize the overall structure of
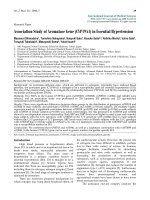
variation in the entire sample. In Figure 1 each row is a tran-
script, and each column a line of flies. Magenta signifies rela-
tively high transcript abundance and blue low abundance.
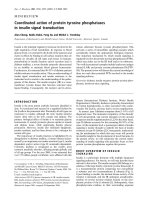
Two results are immediately obvious. First, lines from each of
the two populations form two distinct clusters, due largely to
hundreds of genes that apparently have different relative
abundance between the NC and CA samples, many of which
are indicated by thick lines to the right of the heatmap. Sec-
ond, some genes are more variable among lines than others,
in both populations, and some of these that cluster together
are highlighted with thin vertical lines.
Genome Biology 2007, Volume 8, Issue 6, Article R98 Hsieh et al. R98.3
comment reviews reports refereed researchdeposited research interactions information
Genome Biology 2007, 8:R98
The apparent, striking divergence between NC and CA is
almost certainly over-estimated by this analysis, because the
population of origin of each line was confounded by an exper-
imental batch effect. For reasons unrelated to this study, the
NC and CA hybridizations were performed 4 months apart. In
an attempt to confirm the differentiation, after the initial
analysis was completed a series of hybridizations was per-
formed contrasting lines from each population on the same
microarrays. These new samples did not separate the popula-
tions cleanly, and cluster as their own group within the NC
cluster, when they are analyzed together with the main data-
set (data not shown). The reasons for the batch effect are
unclear, because two slide printing runs and batches of
enzyme were performed with each sample, and the same per-
son (GPG) performed all of the hybridizations. It may pertain
to an ozone effect or some other seasonal variable [18]. In any
case, the mean differences in inferred transcript abundance
across the 58 NC and 50 CA lines are not a reliable indicator
of transcriptional divergence between the populations in this
dataset.
By contrast, there are several interesting patterns of variation
among lines that may be more informative indicators of tran-
scriptional population structure. Figure 2 plots the relative
fluorescence intensity, averaged across all four measure-
ments for each NC line (that is, two dyes and two drug condi-
tions), for one gene that exhibits strong variance among lines
(Figure 2a) and for one that is fairly uniform (Figure 2b). As
noted by others, the power to detect line effects in an experi-
ment with low replication is low [4,5] but, depending on the
method of normalization and the population, between 3%
and 11% of the 4,385 transcripts exhibit a random line effect
that is greater than the residual error in an analysis of vari-
ance (Table 1). This is likely to be an underestimate of the
number of genes that exhibit significant heritability for tran-
scription, because replicated comparison of the most extreme
lines for each gene would indicate many more significant
differences.
For most individual genes, the range and variance of tran-
script abundance are very similar between the two popula-
tions. Comparison of these parameters does not provide any
evidence for divergence in variability between the popula-
tions. Although the mean transcript abundance for each pop-
ulation is often significantly different, as described above, this
may be attributed to batch and normalization artifacts. A
more robust approach to detecting transcriptional divergence
is to define first the structure of variation within each popula-
tion, focusing on the distribution of variation within the NC
and CA samples considered separately.
Mixture modeling of bimodal transcript distributions
If major effect alleles influence gene expression, then tran-
script abundance might be expected to split into two or more
Two-way hierarchical clustering of abundance of all transcripts in NC and CA samplesFigure 1
Two-way hierarchical clustering of abundance of all transcripts in NC and
CA samples. The heat map indicates relatively high abundance in magenta
and low abundance in blue, with each row corresponding to one gene and
each column one line of flies. Thick bars to the right indicate genes that
appear to differentiate the NC and CA samples, whereas the thin bars
highlight genes that have polymorphic expression in both samples. CA,
California; NC, North Carolina.
California North Carolina
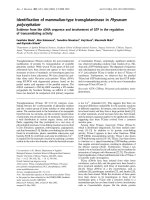
Line means for two typical transcripts across the NC sampleFigure 2
Line means for two typical transcripts across the NC sample. Each plot
shows the mean relative fluorescence intensity on a log base-2 scale for
the four samples (two control and two nicotine-treated) of each line in
random order (± 1 standard deviation unit). (a) CG7843 (unknown gene
that is predicted to be involved in defense/toxin response) is an example
of a gene with bimodal abundance, with the minor transcript abundance
class centered approximately fourfold more abundant than the average
transcript on the array (relative fluorescence intensity = +2), and the
major transcript abundance class (TAC) twofold less abundant than the
average (relative fluorescence intensity = -1). (b) CG12141 (encoding
Lysyl tRNA synthetase) is a gene with a single mode of transcript
abundance, given the variance among and within lines.
-5
-4
-3
-2
-1
0
1
2
3
4
5
-5
-4
-3
-2
-1
0
1
2
3
4
5
(a)
(b)
Line
Line
Transcript abundanceTranscript abundance
R98.4 Genome Biology 2007, Volume 8, Issue 6, Article R98 Hsieh et al. />Genome Biology 2007, 8:R98
modes. Rather then asking whether the frequency distribu-
tion of abundance deviates from a single normal distribution,
we employed mixture modeling [19] to evaluate whether the
data are explained better by superposition of multiple distri-
butions. This analysis was performed on each population sep-
arately to avoid confounding by the overall population/batch
effects. Mclust software [20,21] was used to identify the opti-
mal weighting of and deviation between n modes that maxi-
mizes the likelihood. A Bayesian Information Criterion was
then employed to choose the best model with n = 1, 2, 3, 4, or
5 modes. Simulations assuming a single normal distribution
of expression values established a false-positive rate of 4% for
identification of bimodal distributions. By contrast, evaluat-
ing each population separately, we detected between 7% and
10% of transcripts as having bimodal or trimodal abundance
distributions in both the NC and CA populations. Table 1
shows the number of transcripts assigned to multiple modes
for population as well as combined analyses. The percentage
of genes common to both populations is approximately 12% of
the number in either population alone, implying significant
overlap, with 48 genes at least bimodal in both the NC and CA
samples following mixed model normalization, and 33 follow-
ing loess normalization. Several examples of transcripts with
bimodal distributions that have similar shapes in both popu-
lations are provided in Figure 3.
Given this evidence that almost twice as many genes are
expressed bimodally than expected by chance, we can assign
transcripts to TACs. Figure 4 panels a and b show the distri-
bution of differences between the means of the major and
minor TACs for each transcript in the NC and CA samples
respectively; panels c and d show the proportion of alleles in
the minor TAC. Most TACs diverge between 1.5-fold and 4-
fold, but differences as great as 16-fold are observed occasion-
ally; these typically involve just a handful of lines in the minor
TAC. There is also some suggestion that expression differ-
ences tend to be greater in the CA sample.
The distribution of minor TAC proportions is decidedly L-
shaped; the majority of minor modes contain fewer than 10%
of the transcript abundance measures, but there is a range of
values up to equal frequency of the low and high classes. This
observation is reminiscent of the distribution of genotype fre-
quency classes known as the Ewens sampling distribution
[22,23]. The most parsimonious explanation for this similar-
ity would be that rare alleles segregating under neutrality act
in cis to drive the observed bimodality of transcription. In
Figure 4d we have superimposed the expected distribution of
SNP frequencies under an infinite sites model for three differ-
ent values of the population parameter 4N
μ
on the observed
distributions of minor transcript abundance classes in the CA
sample. The lower two curves represent expected values for
Drosophila melanogaster [24], and the histogram of the
transcript distribution lies within this range, which is consist-
ent with this simple explanation. Unfortunately, there is no
current theory by which to derive an expected distribution of
TACs under alternative models of regulation. Trans-acting
polymorphisms under some scenarios may produce a similar
distribution of TACs.
In evaluating the relationship between the TAC and SNP fre-
quency distributions, there are numerous issues of ascertain-
ment bias that remain to be addressed. There appears to be a
slight excess of minor TACs in the range of 0.05 to 0.1 in both
populations, but this may be a result of a strong tendency to
underestimate the number of rare TACs observed in just one
or two lines, as well as failure to detect TACs with only small
mean differences. We used simulations to estimate the false-
negative rate for each of these two classes of error, and used
those estimates to infer more realistic true distributions of
Table 1
Number of bimodally expressed genes
Sample Model
a
Line effect
b
Bimodal
c
NC Raw data 297 206
Mixed model normalization 192 324
Loess normalization 470 304
Both mixed and loess 188 162
CA Raw data 285 243
Mixed model normalization 119 409
Loess normalization 406 319
Both mixed and loess 114 131
Common to both CA and NC 204 69
d
a
'Raw data' refers to analysis directly on the log transformed raw fluorescence intensity measures, without normalization to remove array effects.
'Mixed model' refers to gene-specific models after mixed model normalization (as described in Materials and methods). 'Loess normalization' refers
to analysis after loess treatment of the arrays. Note that loess increases the number of genes with significant line effects, but it reduces the number
with apparent bimodality.
b
The number of genes exhibiting greater line variation than the residual when treating the line effect as a random factor.
c
The number of genes for which the mixture modeling indicates a greater likelihood that the distribution of transcript abundance across lines has
two or more modes.
d
The total number of genes with bimodal expression in both populations, either from the mixed (48 genes), loess (33 genes), or
both modes of analysis (12 genes). CA, California, NC, North Carolina.
Genome Biology 2007, Volume 8, Issue 6, Article R98 Hsieh et al. R98.5
comment reviews reports refereed researchdeposited research interactions information
Genome Biology 2007, 8:R98
TACs (see Figure 2c for the NC sample). The precise shape of
these distributions is heavily influenced by error in the detec-
tion of rare TACs, and so there is little point in performing
tests of goodness-of-fit between TAC and SNP distributions,
but it is clear that there is a heavy skew toward an excess of
rare or intermediate frequency TACs.
In Drosophila, the high level of polymorphism combined with
a low level of linkage disequilibrium, and hence haplotype
block structure, impedes association mapping using tagging
SNPs [25-27]. To test whether cis-acting SNPs might account
for TACs, we sequenced, from 43 of the NC lines, a short 1.8
kilobase (kb) gene (CG31231) that is sandwiched tightly
between two other genes and that exhibits transcriptional
bimodality in both populations. Three out of 16 common,
independently segregating SNPs were observed to correlate
with transcript abundance, one being a synonymous substitu-
tion with a rare allele frequency of 0.23 that explains 9% of
the transcript abundance at P = 0.03 (t-test) on both control
and nicotine diets. This SNP accounts for less than half of the
bimodality of CG31231 expression and would not be detected
in a genome scan for association with expression.
Power to detect transcriptional abundance classes
Many truly multimodal distributions will appear as skewed
single normal distributions. This is most likely to occur where
the expression is noisy, the magnitude of expression differ-
ence between the abundance classes is small, or the frequency
of the minor class is small. To investigate the effects of sample
size, the magnitude of differentiation, and proportion of
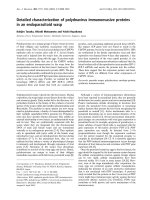
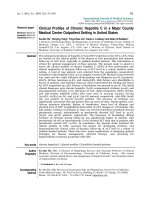
Six examples of bimodal TACs in both populationsFigure 3
Six examples of bimodal TACs in both populations. Each plot shows the frequency distribution in the North Carolina (NC) sample (solid curve) and
California (CA) sample (dashed curve). Units along the x-axis are log base-2 relative fluorescence intensity after mixed model normalization. The top two
rows show transcripts with similar distributions in both populations. The bottom two rows show two transcripts with apparently different distributions in
NC and California (CA), both encoding larval serum proteins. TAC, transcript abundance class.
Lsp1β
1.5
1.0
0.5
0.0
-4 -2 0 2 4
CG9489
1.5
1.0
0.5
0.0
-4 -2 0 2 4
CG11869
1.5
1.0
0.5
0.0
-4 -2 0 2 4
Su(UR)ES
1.5
1.0
0.5
0.0
-4 -2 0 2 4
CG10814
1.5
1.0
0.5
0.0
-4 -2 0 2 4
Lsp1γ
1.5
1.0
0.5
0.0
-4 -2 0 2 4
Transcript abundance Transcript abundance
Relative frequency Relative frequency Relative frequency
R98.6 Genome Biology 2007, Volume 8, Issue 6, Article R98 Hsieh et al. />Genome Biology 2007, 8:R98
abundance classes on power to detect bimodal expression,
Monte Carlo simulations were performed. The standard devi-
ation of the line means was held constant at 0.2 log base-2
units (based on the average standard deviation in the Dro-
sophila experiments) and 3,000 datasets were simulated.
Power is estimated as the detection rate of bimodality using
the mixture modeling approach. The results are presented in
Figure 5.
Sample sizes of at least 50 lines appear to be quite adequate
for detection of bimodality across a range of minor TAC fre-
quencies (Figure 5a). Whereas 30 lines is insufficient for a
minor proportion of 0.05, 80% detection rate is achieved for
a twofold difference in magnitude between the minor and
major TAC means so long as at least 50 lines are surveyed.
This threshold reduces to 1.7-fold for surveys of 100 lines. For
equal proportions of the two TACs, a similar power is
observed irrespective of the sample size. Consequently, if at
least three out of a sample of 50 or more lines are 1.7-fold dif-
ferentially expressed relative to the remainder of the sample
whose standard deviation is less than 1.2-fold, there is good
power to detect differential expression. Clearly, satisfaction of
these criteria is more likely as the quality of the microarrays
improves and more replication is performed.
Furthermore, detection rates are only strongly affected when
the frequency of the minor TAC drops below 10% (Figure 5b).
For a 1.5-fold difference in abundance (that is, 0.6 log base-2
units), the detection rate ranges from 30% to 70% as sample
size increases from 30 to 100 lines and the proportion of the
minor TAC is greater than 0.1. Subsets of fewer than five lines
are only assigned to a separate mode if they are at least
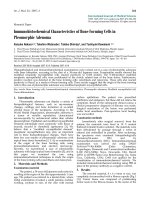
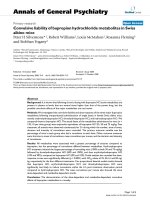
Parameters of bimodal transcription abundance classes in Drosophila by populationFigure 4
Parameters of bimodal transcription abundance classes in Drosophila by population. (a, b) Histograms of magnitude of differences between modes of the
two transcript abundance classes (TACs), on a log base-2 scale, in North Carolina (NC) and California (CA), respectively. In both populations the median
difference is between 1.5-fold and 2-fold, but a few transcripts exhibit differences as great as 16-fold. (c) Histograms of observed (solid bars) and inferred
(open bars) minor TAC frequencies in the NC sample. (d) Histogram of observed distribution of minor TAC frequencies in the CA sample, relative to
expected minor single nucleotide polymorphism frequencies under the Ewens sampling distribution, with the population parameter θ (that is, 4Nμ)
equalling 0.05 (red line), 0.10 (blue line), or 0.20. The two curves for the most part lie within the range of expected values for D. melanogaster defined by
the red and blue curves, although there is a slight excess of minor transcript frequencies between 5% and 10%.
01234
Differences between modes
Proportion
North Carolina
01234
Differences between modes
Proportion
California
15
10
5
0
00.10.20.30.40.5
Minor allele frequency
Likelihood / Proportion
(a) (b)
(c)
(d)
Observed
Inferred
0 0.1 0.2 0.3 0.4 0.5
Minor allele frequency
100
80
60
40
20
0
Count
Genome Biology 2007, Volume 8, Issue 6, Article R98 Hsieh et al. R98.7
comment reviews reports refereed researchdeposited research interactions information
Genome Biology 2007, 8:R98
twofold divergent from the major mode. Because about half of
the observed bimodal transcript distributions have a minor
TAC less than 10%, whereas two-thirds of them have a differ-
ence greater than twofold, it follows that most of the more
divergent TACs are due to relatively rare alleles. Conversely,
rare alleles of small effect are likely to go undetected in popu-
lation surveys of expression.
Such rare alleles may still contribute to skew of normal distri-
butions; therefore, we also examined the effect of skewness
on power to detect bimodality. Samples were drawn from
gamma distributions with increasing skewness, and the false-
positive rate was found to be highly sensitive to skewness. A
gamma distribution with shape parameter 7 and scale
parameter 1 resulted in as many as 36% of datasets exhibiting
evidence for bimodality, whereas a more skewed gamma(2,1)
distribution produces nearly 90% false positives. That is to
say, skewed distributions are much more likely to provide evi-
dence for bimodal transcript abundance than are symmetric
ones. If the reason for the skew is biologic, then false positives
are not a great concern because they still identify potential
departures from uniformity that may be due to allelic
differences.
Power studiesFigure 5
Power studies. (a) Percent detection rate as a function of the difference between the modes of the two transcript abundance classes, for minor transcript
abundance class (TAC) frequencies of 0.05 (left) and 0.5 (right). Colors represent increasing sample size, from 30 lines (red) to 40 (blue), 50 (green), 70
(blue-green), 90 (orange), or 100 (light blue) lines. Power of 80% is obtained for 100 lines if the modes differ by more than 1.7-fold (1.75 log base-2 units),
and 40 lines if they differ by more than 2-fold. Thirty lines is too few to perform this type of analysis. (b) Percentage detection rates as a function of minor
TAC proportion, for four different values of the difference between median expression value of each class. Power drops quickly for minor TACs less than
10% of the sample, but it is fairly constant for all other relative abundances of the two classes.
0 0.2 0.4 0.6 0.8 1.0
100
80
60
40
20
0
0 0.2 0.4 0.6 0.8 1.0
100
80
60
40
20
0
Minor TAC = 0.05 Minor TAC = 0.5
Percent detection rate
Differences between classes Differences between classes
0.2.4.6.810.2.4.6.810.2.4.6.810.2.4.6.81
100
80
60
40
20
0
Difference = 0 = 0.6 Difference = 0.8
Difference
=1.0
Minor transcript class frequency
Percent detection rate
(a)
(b)
Difference
R98.8 Genome Biology 2007, Volume 8, Issue 6, Article R98 Hsieh et al. />Genome Biology 2007, 8:R98
However, statistical analysis of microarray data is based on
the assumption of underlying normal distributions, and
investigators typically take steps to remove skewness [28].
Logarithmic transformation is one such step, but more
aggressive procedures such as Box-Cox transformations [29]
and quantile normalization [30] explicitly transform the data
to approximate a standard normal distribution as far as pos-
sible. The implications are discussed below.
Another common data transformation is use of the loess pro-
cedure to reduce the tendency for ratios of measurements of
two dyes on a single array to be correlated with their intensity,
due to differential labeling or degradation of the two dyes
[31]. This procedure is particularly important for reference
sample designs in which the treatments and references are
labeled with different dyes. In dye-flip experiments dye
effects will tend to cancel out, but the loess transformation
should reduce the within-sample variance, often increasing
power. It may not improve the accuracy of estimation of sam-
ple means, and under some circumstances loess transforma-
tion markedly reduces the detection rate of differential
expression [32]. This is the case here, because the right-hand
side of Table 1 shows a 20% decrease in the rate of detection
of multimodal transcription, after loess transformation. Only
50% of the NC multiple mode assignments (and just 32% of
the CA) agreed between the raw and loess analyses. Although
these cases allow some confidence in the interpretation, they
also highlight sensitivity to data analysis approaches.
Transcriptional bimodality in CEPH lymphoblast cell
lines
To determine whether the relatively high frequency of less
common minor TACs is unique to Drosophila, a similar anal-
ysis of transcript abundance in lymphoblast cell lines derived
from 40 grandparents in the CEPH pedigrees [12,13] was per-
formed. As shown in Figure 6a, the same general left-shift in
the TAC frequency distribution is observed in the 831 bimo-
dally expressed genes. Unlike the Drosophila inbred lines, the
human cell lines segregate three genotypes at most loci, and
most of the minor homozygote classes are likely to be seen in
fewer than 5% of the lines. Consequently, bimodality might be
expected to be more commonly associated with the compari-
son of heterozygotes with the major homozygote class. The
predicted distribution of these genotype groupings, given the
observed allele frequencies for the SNP that shows the strong-
est association with expression in each of the bimodally
expressed genes, is shown in the histogram in Figure 6b. Once
again, there is some correspondence between the shape of the
TAC frequency distribution and that of the expected genotype
distribution. Note that 50 more transcripts exhibit multimo-
dality, but the third and fourth transcript abundance classes
are almost always rare, and power to detect these types of
sample is low.
The availability of a dense SNP map for the CEPH samples
[33] allowed us to scan for association between SNPs and
transcript abundance in the bimodally expressed genes. Sur-
prisingly, there is little overlap between our list of bimodally
expressed genes and the transcripts associated with strong
cis-regulatory polymorphisms reported by others [13,34].
This clearly indicates that only a fraction of cis-regulatory
polymorphisms result in bimodal distributions of transcript
abundance.
Transcript abundance classes in human cell linesFigure 6
Transcript abundance classes in human cell lines. (a) The frequency
distribution of transcript abundance classes (TACs) in the Centre d'Etude
du Polymorphisme Humain data for 831 bimodally expressed genes. Open
bars show the detected frequency of transcripts in each bin, and solid bars
the reconstituted distribution adjusted for the false-negative detection
rate for each bin. (b) The distribution of genotype frequencies for single
nucleotide polymorphism (SNP) within 100 kilobases of each of the 831
transcripts that shows the strongest association with transcript
abundance. Genotype is represented as the lesser of the common
homozygote class or the sum of the heterozygotes and less common
homozygote classes. This distribution is therefore right-shifted relative to
the minor allele frequency distribution (and selection of SNPs with strong
association statistics also biases the analysis toward common SNPs).
Minor TAC frequency
Count
120
100
80
60
40
20
0
0 0.1 0.2 0.3 0.4 0.5
(a)
Observed
Inferred
0 0.1 0.2 0.3 0.4 0.5
Minor genotype frequency
Count
120
100
80
60
40
20
0
(b)
Genome Biology 2007, Volume 8, Issue 6, Article R98 Hsieh et al. R98.9
comment reviews reports refereed researchdeposited research interactions information
Genome Biology 2007, 8:R98
On the other hand, comparison with the distribution of cis
associations in the set of bimodal TACs implies some
enrichment for locally acting regulatory polymorphisms. Fig-
ure 7 shows the observed quantile distributions of the strong-
est association statistic for each gene in (panel a) our sample
of 818 bimodal transcripts, (panel b) a random sample of 838
transcripts, (panel c) a random permutation of genotypes
against transcripts, and (panel d) the best possible TAC asso-
ciations, assuming that each TAC is due to a single genotype
class (see Materials and methods, below). The distributions in
panels a and b are similar overall, expect for the long tail
encompassing the top 2.5% of the bimodal TAC sample, iden-
tifying 20 genes for which the two TACs are largely explained
by single cis-acting SNPs. By contrast with panel c, random
sets of genes are also heavily enriched for cis-acting SNPs,
whose effects are not strong enough to exceed an experiment-
wide significance threshold, but nevertheless strongly suggest
that the majority of genes are regulated in part by cis-SNPs
that have stronger associations than are observed if geno-
types are randomly matched to transcript frequencies. Figure
7d indicates that most of the detected associations only
explain a small portion of the bimodality of transcript abun-
dance, because the association statistics are in general much
smaller than would be observed if there were tight corre-
spondence between genotype and transcript abundance.
Evidence for involvement of trans-acting factors in regulating
gene expression would be found in a higher than expected
incidence of sharing of TACs across lines. Because it is not
trivial to estimate the expected proportion of sharing for
abundance classes of hundreds of transcripts at different fre-
quencies, we focused on rare TACs (those observed in just two
or three lines). As described in Additional data file 1, in gen-
eral these rare TACs are dispersed randomly across most of
the lines. However, in all three datasets (the NC and CA sam-
ples of flies and the CEPH cell lines) a handful of individuals
exhibit an excess of rare TACs, as well as a significant ten-
dency for such rare abundance classes to be shared. This may
be indicative of co-regulation by a trans-acting factor,
although the phenomenon might also be due to an uncharac-
terized technical artifact.
Discussion
What is the distribution of transcriptional variance within
and among populations, and why does it matter? The short
answers are that we have very little idea, but that because
transcription provides a link between genotype and pheno-
type, an understanding of the complex mapping of these two
attributes requires knowledge of the relationship between
genetic and gene expression variation. We have good tools for
quantifying genotypic variation, and an established popula-
tion genetic theory describing the expected distribution of
polymorphism. No such tools or theory yet exist to help us to
evaluate the contributions of drift, mutation, selection, and
admixture to shaping variation in gene expression. Conse-
quently, there is a large gap in our appreciation of the molec-
ular basis of phenotypic evolution and the population
structure of disease susceptibility.
Mixture modeling appears to be a useful tool for detecting
transcripts that are variable in abundance within
populations, although its utility for comparing distributions
between populations is yet to be established. Unfortunately, a
large batch effect confounded the comparison of the two
populations, and this limited our ability to apply an alterna-
tive analytical approach, namely Q
ST
analysis [6,35]. Q
ST
is a
quantitative analog of the inbreeding coefficient, F
ST
, which is
commonly used to quantify divergence between populations
based on allele frequencies [36]. Simultaneous measurement
of Q
ST
and F
ST
with genotypic markers at the same locus has
the potential to facilitate tests of selection. Two recent studies
of mutation accumulation in nematodes and Drosophila
[37,38] both imply that stabilizing selection is pervasive at the
transcriptional level, because natural isolates appear to har-
bor less variation than would be predicted based on the rate
of genetic divergence of laboratory lines. Consequently,
simultaneously high Q
ST
and F
ST
values may indicate adaptive
divergence caused by linked regulatory polymorphism. Dis-
cordance between the parameters could have numerous
causes, including the role played by trans-acting polymor-
phism in transcriptional variation and the possibility that
major effect haplotypes accentuate population differences in
transcript abundance.
Is there evidence for divergence between the NC and CA sam-
ples of flies? Batch effects may influence any large-scale
microarray experiment, and so it is preferable that two popu-
lations be measured at the same time. Reduced costs and
increased availability of single channel platforms for model
organisms will soon allow parallel measurement of thousands
of samples, which should facilitate comparisons based on
mean transcript abundance. Here, though, we have focused
on measures based on the variance and distribution of abun-
dance among lines. Because only 14% of bimodal NC tran-
scripts are also bimodal in CA, it might be argued that
divergence in the frequency of polymorphisms that contrib-
ute to the bimodality is common. However, 50 lines per sam-
ple is at the lower limit of power, particularly given that half
of the cases are due to relatively rare minor TACs. The exam-
ples presented in Figure 3 demonstrate that the proportions
of the two major TACs are preserved between the populations
at least in some cases. Drosophila melanogaster has tradi-
tionally been regarded as a panmictic species, with most of
the variation shared among populations (for comparison, see
[39]). However, as sequences replace allozyme studies, it has
become apparent that, as in humans, a few percent of the var-
iation does exhibit population structure, and that rare private
alleles are not uncommon [40,41]. Although the bulk of the
transcriptome is undifferentiated between the two North
American populations, it is likely that further studies will con-
firm subtle divergence for a subset of transcripts.
R98.10 Genome Biology 2007, Volume 8, Issue 6, Article R98 Hsieh et al. />Genome Biology 2007, 8:R98
Figure 7 (see legend on next page)
0 5 10 15 20 25 30
0 5 10 15 20 25 30 35 40 45
0 5 10 15 20 25 30
0 5 10 15 20 25 30
Association statistic (-log P)
(a)
(b)
(c)
(d)
Genome Biology 2007, Volume 8, Issue 6, Article R98 Hsieh et al. R98.11
comment reviews reports refereed researchdeposited research interactions information
Genome Biology 2007, 8:R98
Statistical analysis is often regarded as an objective enterprise
that is guaranteed to arrive at an unambiguous test of a
hypothesis. However, philosophical issues have impacts on
interpretation of functional genomic studies. Frequentist and
Bayesian analyses are not always in agreement [42,43],
whereas disputes also arise over the adoption of false-positive
or false-discovery rates as the most appropriate approach to
identification of candidate genes [44,45]. This study
highlights another analytical issue, namely the degree of
aggressiveness in data normalization, which actually gives
rise to an epistemological problem. It is obviously good prac-
tice to remove sources of bias and noise in data as much as
possible without disrupting the biologic content, before
model fitting. A major source of bias in gene expression pro-
files, whether contrasting population samples or tissues and
treatments, is skew away from normality. Recognizing that
skewness will tend toward false attribution of multiple mix-
tures, it could be argued that quantile normalization or some
equivalent procedure should be used to force the data toward
symmetric normal distributions. The trouble with doing this
is that it will tend to 'throw the baby out with the bathwater';
skew is actually an expected property of distributions that
arise from mixtures of two or more underlying distributions.
We thus arrive at a biologic uncertainty principle, insofar as
the process of measurement may destroy the signal.
What is the cause of the bias toward low frequencies of minor
transcript abundance classes? For genotypes, it is well known
that observed distributions approximate well to expectations
under mutation-drift equilibrium, implying that a large pro-
portion of molecular polymorphism segregates at or near
neutrality. The loose correspondence between genotype and
TAC frequency distributions is consistent with an extension
of this principle, namely that a large proportion of bimodal
transcriptional variation is due to the effect of nearly neutral
cis-acting polymorphisms. However, the error associated
with detection and measurement of TACs precludes rigorous
testing of this hypothesis, and evidence was presented that
cis-acting effects only account for a small proportion of bimo-
dality. Across the 818 genes in the CEPH data, and for the one
Drosophila gene examined closely, SNPs linked to the tran-
scripts do not define transcript abundance classes. Consistent
with results from expression QTL experiments [46], these
results provide further evidence that expression tends to be
regulated by a complex mixture of cis-acting and trans-acting
factors. The shape of the TAC distributions in our data could
be explained either by combination of the effects of relatively
rare alleles or by low frequency combinations of independ-
ently segregating common alleles.
Conclusion
Population profiling complements expression QTL analysis
[7,8] as an approach to identification of candidate QTLs,
because crosses derived from just two lines will tend to miss
rare alleles in a population. Even in a common disease/com-
mon variant model of disease susceptibility, differential
expression may only be expected in a small percentage of
individuals. Mixture modeling appears to lose efficiency for
detecting minor TACs that constitute less than 10% of the
sample, but it nevertheless provides evidence for distinct
abundance classes for between 5% and 10% of transcripts.
The enrichment for transcripts regulated in cis is clearly only
modest, with just 20 transcripts in the CEPH dataset showing
more highly significant associations with linked SNPs than
those observed for a random set of genes of the same size. On
the other hand, both the bimodal and randomly chosen sam-
ples of genes exhibit an excess of significant associations rel-
ative to SNPs chosen from unlinked genes, providing further
evidence for the pervasive contribution of cis-regulatory pol-
ymorphism to regulation of gene expression. The collection of
strongly bimodally expressed transcripts from population
sampling provides a sample of candidate genes that can be
assessed for regulation of quantitative traits in targeted
crosses or carefully chosen pedigrees.
Materials and methods
Experimental design
This experiment was conceived initially to evaluate transcrip-
tional variation for response to nicotine in D. melanogaster
[14]. Briefly, 58 isofemale lines from NC and 50 from CA were
inbred by between 15 and 50 generations of sib-pair mating.
These were chosen from a large sample of nearly isogenic
lines that were described previously [41]. Residual heterozy-
gosity is typically on the order of 0.1. The flies were reared in
vials with standard cornmeal (control). Nicotine treatment
was administered by transfer for 8 hours to standard corn-
meal supplemented with a trace of nicotine. Because the
majority of transcripts are relatively unaffected by the drug
treatment, we simply averaged the two control and two nico-
tine treatments to obtain the line means. Analysis by drug
treatment separately yields similar results.
Strength of association between cis-SNPs and transcript abundanceFigure 7 (see previous page)
Strength of association between cis-SNPs and transcript abundance. Frequency histograms in bins of increasing order of magnitude of significance, with
number of genes indicated on the y-axis. (a) The distribution of significance measures (negative logarithm of the P value) for the most strongly associated
single nucleotide polymorphism (SNP) within 100 kilobases of each of the 818 bimodally expressed transcripts. (b) The same distribution for SNPs linked
to a set of 835 randomly selected transcripts. Note the excess of outliers in the bimodal sample. (c) The distribution of strongest associations for a typical
permutation of SNPs against unlinked transcripts, clearly showing much reduced significance relative to those observed for linked SNPs. (d) The 'best
possible' distribution of associations, assuming that a single SNP explains all of the observed bimodality of each transcript. Single dots in panels A and D
represent outlier significance values.
R98.12 Genome Biology 2007, Volume 8, Issue 6, Article R98 Hsieh et al. />Genome Biology 2007, 8:R98
RNA was extracted from flash-frozen heads of 50 adult 3-day
to 5-day females for each line. For each population, collection
was spread over 2 months, and the collections were per-
formed 6 months apart. Hybridizations were performed with
a pool of two separate linear amplification labeling reactions
with either dye, Cy5 or Cy3. A randomized loop design
ensured that each microarray contrasted a control to a nico-
tine sample, each drawn from a different line from the NC or
CA sample (see Additional data file 2). There are a total of 216
microarrays, such that each of the 108 lines is represented by
two control and two nicotine treatments with one dye-flip
each.
The cDNA arrays were printed on glass slides at the NC State
University Genome Research Laboratory using clones sup-
plied by the Berkeley Drosophila Genome Project. A total of
223 of the 4,608 spots on the array lack polymerase chain
reaction products or were missing for other technical reasons.
Another group of spots consistently showed low intensity
comparable to the empty spots, presumably because they rep-
resent genes that are not expressed in adult female heads.
They were also excluded from analysis so as not to skew the
distribution of effects across the whole array, resulting in
4,212 spots in our final analysis.
Data transformation
The expression level for each transcript was estimated after
first transforming the raw intensity measures with a log base-
2 function. A global normalization for all arrays was per-
formed using a linear mixed model of the following form:
y
ijk
= μ + D
i
+ T
j
+ (D × T)
ij
+ A
k
+ ε
ijk
Where y is the log 2 intensity, μ is the overall mean, D
i
is the
ith dye effect, T
j
is the jth treatment effect, and (D × T)
ij
is their
interaction effect. Each of these terms is specified as a fixed
effect, whereas A
k
is the random effect of the kth array and is
assumed to be normally distributed with a mean of zero and
variance σ
a
2
.
Subsequently, a second gene-specific model was fit to esti-
mate the true line effect for each gene effect, as follows:
rfi
ijkl
= G + (GD)
i
+ (GT)
j
+ (GD × GT)
ij
+ (GA)
k
+ (GL)
l
+ ε
ijkl
where rfi is the relative fluorescence intensity, namely the
residual from the global normalization; G is the overall mean;
(GD)
i
is the ith gene-specific dye effect; (GT)
j
is the jth gene-
specific treatment effect; (GD × GT)
ij
is their interaction term;
and (GL)
l
is the gene-specific line effect for the lth line. All of
these main effects are specified as fixed effects, as is the pair-
wise interaction term. (GA)
k
is the gene-specific random
effect for array variation. Least squares means of the gene-
specific line effect are derived to represent the expression
level of each line. It should be noted that use of a randomized
loop will tend to reduce the total among line variance, because
if two lines with high (or low) abundance happen to be
hybridized on the same array, then part of the differential
expression will be absorbed into the estimate of the array
effect, (GA)
k
.
Mixture modeling
A simple one-dimensional multi-mixture model was con-
structed for each gene based on the least squares means of the
line effect from the mixed model described above. Each
model assumes a weighted sum of normal distributions,
which are called mixtures:
Where f(l) is the distribution of least squares mean line
effects, and w is the weighting of each normal distribution,
namely the proportion of samples classified into that compo-
nent. The sum of the w
i
s should be equal to 1. The μ
i
and σ
i
2
are the mean and variance of the normal distribution, and m
is the number of mixtures fitted. We used the EMclust EM
algorithm within a package in R called Mclust for the mode-
ling [17]. This package also allows choice of the number of
mixtures that provides the optimal fit to the data, based on a
Bayesian Information Criterion that accounts for the
difference in degrees of freedom associated with each model.
The maximum number of mixtures was restricted to 5.
The allelic frequency spectrum in Figure 4 was derived as
described in Ewens' 1972 paper [19] as following: f(x) = θ x
-1
(1
- x)
θ-1
, where θ = 4Nμ. In other words, f(x)δ × is the probabil-
ity that an allele in the population will be in the frequency
range (x, x + δ) for small δ. Based on the generally accepted
range θ for Drosophila, we choose 0.05, 0.1, and 0.2 for dem-
onstration. For θ → 0, f(x) is approximately a symmetric
function with respect to 0.5, so the minor allele frequency can
be formulated as twice the function f with the range of (0,0.5).
Transcriptional bimodality
Genes were classified as bimodally expressed when the opti-
mal number of mixtures fitted by Mclust was m = 2. For each
such gene, the frequency of the minor TAC was defined as the
smaller of the weights w
1
and w
2
in the estimated two-compo-
nent mixture model w
1
× N(μ
1
,σ
1
2
) + w
2
× N(μ
2
, σ
2
2
). Because
we expected that the parameters of the underlying mixture
distribution would influence the resolution of bimodality, we
anticipated an ascertainment bias in the empirical distribu-
tion of TAC frequencies; to recover the latent TAC frequency
distribution, we sought a simulation-based estimate of this
bias. For each gene classified as bimodally expressed, we used
the estimated two-component mixture model to generate
10,000 samples of 58 observations. We then used Mclust on
each of the 10,000 samples, recording the proportion of suc-
cessful mixture resolutions. This approach, reminiscent of the
parametric bootstrap, yielded a gene-specific estimate β of
f( )= w N(m ,s )
iii
2
i=1
m
l ϫ
∑
Genome Biology 2007, Volume 8, Issue 6, Article R98 Hsieh et al. R98.13
comment reviews reports refereed researchdeposited research interactions information
Genome Biology 2007, 8:R98
the power to detect bimodality; we attributed the false-nega-
tive rate 1 - β to a latent class of bimodally expressed genes
that went undetected by Mclust. In other words, a bimodally
expressed gene with a power estimate of β stands a probabil-
ity of 1 - β of going undetected, and to correct for this ascer-
tainment bias we counted the gene 1/β times. In particular, by
weighting the minor TAC frequency of each gene by the recip-
rocal of its simulated power, we obtained a TAC frequency
distribution that has been disentangled from the discovery
process.
Tests of association in the CEPH data
In order to evaluate the level of association between cis-SNPs
and bimodality, we extracted from the HapMap database all
SNPs within 100 kb of each of the 881 multimodal transcripts
from the mixture modeling. Sixty-three of these transcripts
either had more than two modes or are not annotated suffi-
ciently well to identify linked SNPs, resulting in a final set of
818 genes. A random sample of 881 other genes resulted in
838 genes with well annotated linked SNPs within 100 kb. We
then performed a t-test of the difference in estimated tran-
script abundance between the major homozygote class and
the joint set of heterozygotes and minor homozygotes, and
simply report the distribution of strongest associations for
each SNP and transcript. Neither a tagging strategy nor a
minor allele frequency cutoff was employed, and nor was a
multiple correction factor used. Either of these would cer-
tainly be important were we to make any claims about a spe-
cific association, but Figure 7 deals only with the distribution
of all the statistics obtained as described, and the conclusions
would not be affected greatly by alternate analyses.
Additional data files
The following additional data are available with the online
version of this paper. Additional data file 1 summarizes the
analysis of the distribution of rare TACs among lines within
each of the three experimental datasets. Additional data file 2
illustrates the experimental design.
Additional data file 1Analysis of the distribution of rare TACsThis document summarizes the analysis of the distribution of rare TACs among lines within each of the three experimental datasets.Click here for fileAdditional data file 2Experimental designThe experimental design is illustrated. Each line is represented by four measurements: two involving control samples and two nico-tine-treated samples. These were obtained from four microarrays, with a balance of Cy3 and Cy5 dyes, and a randomized loop. For example, line 2 was hybridized as control Cy3 to line 5 nicotine Cy5 on one array, and control Cy5 to line 1. Two different loops were generated, one for each population.Click here for file
All expression data are available from the MIAME compliant
public repository at ArrayExpress [47], expression profile
number E-TABM-109, and from our laboratory supplemen-
tary information site [48], which provides various other sup-
port files including SAS scripts, data analysis summaries, and
array annotation files.
Acknowledgements
We thank Philip Awadalla, Russ Wolfinger, Dennis Boos, Dahlia Nielsen,
and Bruce Weir for discussions; Priscilla Hunt for sequencing of Drosophila
lines; and Sergey Nuzhdin for the CA sample of inbred lines. This work was
supported by NIH award P01-GM45344 to GG.
References
1. Ewens W: A hundred years of population genetics theory. J
Epidemiol Biostat 2000, 5:17-23.
2. Ohta T, Gillespie JH: Development of neutral and nearly neu-
tral theories. Theor Popul Biol 1996, 49:128-142.
3. Orr HA: The genetic theory of adaptation: a brief history. Nat
Rev Genet 2005, 6:119-127.
4. Monks SA, Leonardson A, Zhu H, Cundiff P, Pietrusiak P, Edwards S,
Phillips JW, Sachs A, Schadt EE: Genetic inheritance of gene
expression in human cell lines. Am J Hum Genet 2004,
75:1094-1105.
5. Cheung VG, Conlin LK, Weber TM, Arcaro M, Jen K-Y, Morley M,
Spielman RS: Natural variation in human gene expression
assessed in lymphoblastoid cells. Nat Genet 2003, 33:422-425.
6. Gibson G, Weir B: The quantitative genetics of transcription.
Trends Genet 2005, 21:616-623.
7. Stamatoyannopoulos JA: The genomics of gene expression.
Genomics 2004, 84:449-457.
8. de Koning DJ, Haley CS: Genetical genomics in humans and
model organisms. Trends Genet 2005, 21:377-381.
9. Rockman MV, Wray GA: raw material for cis Abundant -regula-
tory evolution in humans. Mol Biol Evol 2002, 19:1991-2004.
10. Dermitzakis ET, Clark AG: Evolution of transcription factor
binding sites in Mammalian gene regulatory regions: conser-
vation and turnover. Mol Biol Evol 2002, 19:1114-1121.
11. Wittkopp PJ, Haerum BK, Clark AG: Evolutionary changes in cis
and trans gene regulation. Nature 2004, 430:85-88.
12. Morley M, Molony C, Weber T, Devlin J, Ewens WK, Spielman RS,
Cheung VG: Genetic analysis of genome-wide variation in
human gene expression.
Nature 2004, 430:743-747.
13. Cheung VG, Spielman RS, Ewens KG, Weber TM, Morley M, Burdick
JT: Mapping determinants of human gene expression by
regional and genome-wide association. Nature 2005,
437:1365-1369.
14. Fondation Jean Dausset - CEPH []
15. Passador-Gurgel G, Hsieh WP, Hunt P, Deighton N, Gibson G:
Quantitative trait transcripts for nicotine resistance in Dro-
sophila melanogaster. Nat Genet 2007, 39:264-268.
16. Churchill GA: of experimental design for cDNA microarrays.
Nat Genet 2002:490-495.
17. Stapleton M, Liao G, Brokstein P, Hong L, Carninci P, Shiraki T, Hay-
ashizaki Y, Champe M, Pacleb J, Wan K, et al.: The Drosophila gene
collection: identification of putative full-length cDNAs for
70% of D. melanogaster genes. Genome Res 2002, 12:1294-1300.
18. Fare TL, Coffey EM, Dai H, He YD, Kessler DA, Kilian KA, Koch JE,
LeProust E, Marton MJ, Meyer MR, et al.: Effects of atmospheric
ozone on microarray data quality. Anal Chem 2003,
75:4672-4675.
19. Pearson K: Contributions to the mathematical theory of
evolution. Phil Trans Roy Soc A 1894, 185:75-110.
20. Fraley C, Raftery AE: Mclust: software for model-based cluster
analysis. J Classification 1999, 16:297-306 [hing
ton.edu/tech.reports/tr342.ps].
21. Yeung KY, Fraley C, Murua A, Raftery AE, Ruzzo WL: Model-based
clustering and data transformations for gene expression
data. Bioinformatics 2001, 17:977-987.
22. Ewens W: The sampling theory of selectively neutral alleles.
Theor Popul Biol 1972, 3:87-112.
23. Griffiths RC, Lessard S: Ewens' sampling formula and related
formulae: combinatorial proofs, extensions to variable pop-
ulation size and applications to ages of alleles. Theor Popul Biol
2005, 68:167-177.
24. Aquadro CF, Bauer DuMont V, Reed FA: Genome-wide variation
in the human and fruitfly: a comparison. Curr Opin Genet Dev
2001, 11:627-634.
25. Palsson A, Gibson G: Association between nucleotide variation
in Egfr and wing shape in Drosophila melanogaster. Genetics
2004, 167:1187-1198.
26. Nikoh N, Duty A, Gibson G: Effects of population structure and
sex on association between serotonin receptors and Dro-
sophila heart rate. Genetics 2004, 168:1963-1974.
27. Macdonald SJ, Pastinen T, Long AD: The effect of polymorphisms
in the enhancer of split gene complex on bristle number var-
iation in a large wild-caught cohort of Drosophila
melanogaster. Genetics 2005, 171:1741-1756.
28. Quackenbush J: Microarray data normalization and
transformation. Nat Genet 2002:496-501.
29. Durbin B, Rocke DM: of transformation parameters for micro-
array data. Bioinformatics 2003, 19:1360-1367.
30. Bolstad BM, Irizarry RA, Astrand M, Speed TP: A comparison of
normalization methods for high density oligonucleotide
array data based on variance and bias. Bioinformatics 2003,
R98.14 Genome Biology 2007, Volume 8, Issue 6, Article R98 Hsieh et al. />Genome Biology 2007, 8:R98
19:185-193.
31. Yang YH, Dudoit S, Luu P, Lin DM, Peng V, Ngai J, Speed TP: Nor-
malization for cDNA microarray data: a robust composite
method addressing single and multiple slide systematic
variation. Nucl Acids Res 2002, 30:e15.
32. Dabney AR, Storey JD: Normalization of two-channel microar-
rays accounting for experimental design and intensity-
dependent relationships. Genome Biol 2007, 8:R44.
33. International HapMap Consortium: A haplotype map of the
human genome. Nature 2005, 437:1299-1320.
34. Stranger BE, Forrest MS, Clark AG, Minichiello MJ, Deutsch S, Lyle R,
Hunt S, Kahl B, Antonarakis SE, Tavare S, et al.: Genome-wide asso-
ciations of gene expression variation in humans. PLoS Genet
2005, 1:e78.
35. Ritland K: Marker-inferred relatedness as a tool for detecting
heritability in nature. Mol Ecol 2000, 9:1195-1204.
36. Weir BS, Hill WG: Estimating F-statistics. Annu Rev Genet 2002,
36:721-750.
37. Denver DR, Morris K, Streelman JT, Kim SK, Lynch M, Thomas WK:
The transcriptional consequences of mutation and natural
selection in Caenorhabditis elegans. Nat Genet 2005, 37:544-548.
38. Rifkin SA, Houle D, Kim J, White KP: A mutation accumulation
assay reveals a broad capacity for rapid evolution of gene
expression. Nature 2005, 438:220-223.
39. Dieringer D, Nolte V, Schlotterer C: Population structure in Afri-
can Drosophila melanogaster revealed by microsatellite
analysis. Mol Ecol 2005, 14:563-573.
40. Spicer GS, Fleming JE: Genetic differentiation of Drosophila mel-
anogaster
populations as assessed by two-dimensional
electrophoresis. Biochem Genet 1991, 29:389-401.
41. Palsson A, Rouse A, Riley-Berger R, Dworkin I, Gibson G: Nucle-
otide variation in the Egfr locus of Drosophila melanogaster.
Genetics 2004, 167:1199-1212.
42. Efron B, Tibshirani R: Empirical bayes methods and false discov-
ery rates for microarrays. Genet Epidemiol 2002, 23:70-86.
43. Ranz JM, Namgyal K, Gibson G, Hartl DL: Anomalies in the
expression profile of interspecific hybrids of Drosophila mela-
nogaster and Drosophila simulans. Genome Res 2004, 14:373-379.
44. Qian HR, Huang S: Comparison of false discovery rate methods
in identifying genes with differential expression. Genomics
2005, 86:495-503.
45. Broberg P: A comparative review of estimates of the propor-
tion unchanged genes and the false discovery rate. BMC
Bioinformatics 2005, 6:199.
46. Brem RB, Kruglyak L: The landscape of genetic complexity
across 5,700 gene expression traits in yeast. Proc Natl Acad Sci
USA 2005, 102:1572-1577.
47. ArrayExpress [ />48. Supplementary Information for Hsieh, Passador-Gurgel,
Stone and Gibson [http://statgen.n csu.edu/ggibson/SupplInfo/
SupplInfo12.htm]