Báo cáo y học: "The human phylom" docx
Bạn đang xem bản rút gọn của tài liệu. Xem và tải ngay bản đầy đủ của tài liệu tại đây (490.69 KB, 16 trang )
Genome Biology 2007, 8:R109
comment reviews reports deposited research refereed research interactions information
Open Access
2007Huerta-Cepaset al.Volume 8, Issue 6, Article R109
Research
The human phylome
Jaime Huerta-Cepas, Hernán Dopazo, Joaquín Dopazo and Toni Gabaldón
Address: Bioinformatics Department, Centro de Investigación Príncipe Felipe, Autopista del Saler, 46013 Valencia, Spain
Correspondence: Toni Gabaldón. Email:
© 2007 Huerta-Cepas, et al.; licensee BioMed Central Ltd.
This is an open access article distributed under the terms of the Creative Commons Attribution License ( which
permits unrestricted use, distribution, and reproduction in any medium, provided the original work is properly cited.
The human phylome <p>The human phylome, which includes evolutionary relationships of all human proteins and their homologs among thirty-nine fully sequenced eukaryotes, is reconstructed.</p>
Abstract
Background: Phylogenomics analyses serve to establish evolutionary relationships among
organisms and their genes. A phylome, the complete collection of all gene phylogenies in a genome,
constitutes a valuable source of information, but its use in large genomes still constitutes a technical
challenge. The use of phylomes also requires the development of new methods that help us to
interpret them.
Results: We reconstruct here the human phylome, which includes the evolutionary relationships
of all human proteins and their homologs among 39 fully sequenced eukaryotes. Phylogenetic
techniques used include alignment trimming, branch length optimization, evolutionary model
testing and maximum likelihood and Bayesian methods. Although differences with alternative
topologies are minor, most of the trees support the Coelomata and Unikont hypotheses as well as
the grouping of primates with laurasatheria to the exclusion of rodents. We assess the extent of
gene duplication events and their relationship with the functional roles of the protein families
involved. We find support for at least one, and probably two, rounds of whole genome duplications
before vertebrate radiation. Using a novel algorithm that is independent from a species phylogeny,
we derive orthology and paralogy relationships of human proteins among eukaryotic genomes.
Conclusion: Topological variations among phylogenies for different genes are to be expected,
highlighting the danger of gene-sampling effects in phylogenomic analyses. Several links can be
established between the functions of gene families duplicated at certain phylogenetic splits and
major evolutionary transitions in those lineages. The pipeline implemented here can be easily
adapted for use in other organisms.
Background
The complete sequencing of the human genome represented
a major breakthrough for the genome era [1,2]. Since then, a
number of genome wide experimental and computational
analyses have been performed that capture different aspects
of the biology of the human cell. These analyses include,
among many others, those of the so-called transcriptome [3],
proteome [4], interactome [5] and metabolome [6]. The avail-
ability of such large datasets have added new dimensions to
the study of the human organism; not only are they useful in
elucidating the function of otherwise uncharacterized pro-
teins, but they also provide information on the system-level
properties of the cell [7]. The reconstruction of the evolution-
ary histories of all genes encoded in a genome, the so-called
phylome [8], constitutes another source of genome-wide
information. Analyses of complete phylomes, however, have
Published: 13 June 2007
Genome Biology 2007, 8:R109 (doi:10.1186/gb-2007-8-6-r109)
Received: 30 November 2006
Revised: 16 March 2007
Accepted: 13 June 2007
The electronic version of this article is the complete one and can be
found online at />R109.2 Genome Biology 2007, Volume 8, Issue 6, Article R109 Huerta-Cepas et al. />Genome Biology 2007, 8:R109
traditionally been prevented by their large demands on time
and computer power. Only recently have faster computers
and algorithms paved the way for the application of phyloge-
netics to whole genomes. Such analyses have proven to be a
very useful tool for the detection of specific evolutionary sce-
narios [9] and for the functional characterization of genes and
biological systems [10,11]. Other large-scale phylogenetic
analyses have focused on the establishment of orthology rela-
tionships among genes in model species. Most remarkably,
the Ensembl database now includes phylogenetic trees [12],
and the TreeFam [13] and HOVERGEN [14] databases pro-
vide automatically derived and curated phylogenies of animal
gene families. Other such databases focus on specific aspects
of the evolution of gene families, such as the detection of
adaptive events [15]. These databases follow a family-based
approach, since they first group the genes into families and
subsequently build a single phylogeny for each family.
Using a different, gene-based approach that aims at maximiz-
ing both the coverage over the human genome and the taxon-
sampling among fully sequenced eukaryotic genomes, we
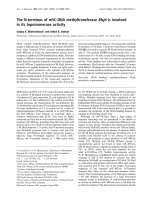
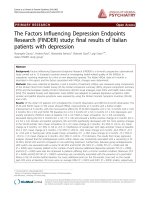
have developed a fully automated pipeline (Figure 1) to recon-
struct the phylogenies of every protein encoded in the human
genome and its homologs in 39 eukaryotic species. Such a
pipeline aims at resembling, as much as possible, the manual
procedure used by phylogeneticists while remaining a fully
automated process. In the search for a compromise between
time and reliability, we always tried to adjust the balance
towards the latter, thus assuring high quality in the resulting
phylogenies. In contrast to the abovementioned TreeFam and
Ensembl phylogenetic pipelines, our approach includes evo-
lutionary model testing using maximum likelihood (ML),
model parameter estimation and alignment trimming steps.
Moreover, besides using neighbor joining (NJ) and ML
approaches for phylogenetic reconstruction, our pipeline also
implements a Bayesian phylogenetic reconstruction
approach to provide posterior probabilities of every partition
in the tree. As a result, building the human phylome pre-
sented here took two months on a total of 140 64-bit proces-
sors, which is roughly equivalent to 23 years in a single
processor. To our knowledge, this represents the most sophis-
ticated phylome reconstruction pipeline and the largest com-
puting time investment for a single phylome reported to date.
The availability of such a comprehensive collection of evolu-
tionary histories of protein-coding human genes constitutes a
valuable source of information that allows us to test several
evolutionary hypotheses. For this purpose, we investigated
the consistency of the individual phylogenies within the phy-
lome with alternative evolutionary scenarios, namely those
involving the relative positions of rodents and primates,
amoebozoans and opisthokonts and, finally, insects, nema-
todes and chordates. We also scanned the human phylome for
cases of putative horizontally transferred genes and found
that such topologies are never highly supported, indicating
that they are rather the result of phylogenetic artifacts. More-
over, we provide estimates for the number of gene duplica-
tions that have occurred at different evolutionary stages in the
eukaryotic lineages leading to hominids and found several
over-represented functional classes in the different duplica-
tion events. Finally, we explored an alternative, fully auto-
mated algorithm to infer orthology relationships from
phylogenetic trees that does not require a fully resolved spe-
cies phylogeny and, therefore, is less sensitive to topological
variations. The choice for this novel methodology for orthol-
ogy prediction is based on the fact that alternative tree recon-
ciliation methods have difficulties in accounting for inherent
phylogenetic noise, divergences in evolutionary histories for
different genes and the low resolution level of available spe-
cies trees. As will be shown below, the high degree of topolog-
ical variation found in the human phylome for all scenarios
considered also supports the choice of alternatives to classic
tree reconciliation methods. All in all, the results presented
here constitute a preliminary but broad overview of the evo-
lutionary history of the human genome, which is not taken as
an average or represented by a limited number of genes, but
instead is regarded as a complex mosaic of thousands of indi-
vidual phylogenies.
Results and discussion
Phylome scope and phylogenetic pipeline
The human phylome presented here is derived from the pro-
teins encoded by 39 publicly available eukaryotic genomes
(Table 1). This set is particularly rich in metazoan species (19
species, 50%), including 14 chordates, 3 arthropods and 2
nematodes. The second largest group is that of fungi, com-
prising 11 species and thus making a total of 30 opisthokons.
The remaining group includes eight species from diverse
phyla, among which are one amoebozoan (Dictyostellum dis-
coideum), two plants (Arabiopsis thaliana and
Chlamydomonas reinhardti), two apicomplexans (Plasmo-
dium falciparum and Plasmodium briggsae), and three exca-
vates (the diplomonad Guillardia theta and the
kinetoplastids Leishmania major and Paramecium tetraure-
lia). This distribution of species makes our set especially suit-
able for addressing the evolution of protein families among
the opisthokonts. It covers, therefore, a period that is rich in
important evolutionary innovations, from the origin of apop-
totic pathways [16] to the emergence of complex communica-
tion patterns [17].
To derive a phylome from the abovementioned proteome
database we applied a phylogenetic pipeline to each human
protein. This fully automated pipeline (described in more
detail in the Materials and methods section) emulates the
manual workflow used by phylogeneticists: from sequence,
through alignment, to phylogenetic reconstruction. It starts
with a sequence search against the proteome database to
retrieve groups of significantly similar proteins that are then
aligned. Alignments are automatically trimmed to remove
gap-rich regions. The subsequent phylogenetic
Genome Biology 2007, Volume 8, Issue 6, Article R109 Huerta-Cepas et al. R109.3
comment reviews reports refereed researchdeposited research interactions information
Genome Biology 2007, 8:R109
reconstruction combines NJ, ML and Bayesian methods.
Firstly, a NJ tree is constructed with BioNJ [18], and sec-
ondly, this NJ tree is used as a seed in a ML analysis using
PhyML [19]. In the ML analysis, up to five different evolution-
ary models were tested for each tree (see below) using a dis-
crete gamma-distribution model with four rate categories
plus invariant positions. Both the gamma shape parameter
and the fraction of invariant positions were estimated from
the data. Finally, the ML tree rendered by the model best fit-
ting the data, as determined by the Akaike Information Crite-
rion (AIC) [20], was further refined with a Bayesian approach
as implemented in MrBayes [21]. After the Bayesian analysis,
a consensus tree was produced by using the 'halfcompat'
option of MrBayes, which produces a topology in which all
partitions are compatible with at least 50% of the trees pro-
duced by the Monte Carlo Markov Chain analysis (see Mate-
Schematic representation of the phylogenetic pipeline used to reconstruct the human phylomeFigure 1
Schematic representation of the phylogenetic pipeline used to reconstruct the human phylome. Each protein sequence encoded in the human genome is
compared against a database of proteins from 39 fully sequenced eukaryotic genomes (Table 1) to select putative homologous proteins. Groups of
homologous sequences are aligned and subsequently trimmed to remove gap-rich regions. The refined alignment is used to build a NJ tree, which is then
used as a seed tree to perform a ML likelihood analysis as implemented in PhyML, using four different evolutionary models (five in the case of
mitochondrially encoded proteins). The ML tree with the maximum likelihood is further refined with a Bayesian analysis using MrBayes. Finally, different
algorithms are used to search for specific topologies in the phylome or to define orthology and paralogy relationships.
Quick but less accurate approach
Seed for ML trees
BioNJ [8]
NJ Tree
ML Trees
Estimation of gamma distribution
Try different evolutionary models
(JTT, WAG, Blosum62, VT, MtREV)
PhyML v2.4.4 [7]
Topology and branch length refinement
Branch support values
MrBayes v3.1.2 [9]
Multiple alignment. Muscle 3.6 [6]
Gap trimming
Alignments
MrBayes Tree
Smith−Waterman Blast search
E−value and overlap cut−off
Homologs search
HUMAN PHYLOME
For every human gene
R109.4 Genome Biology 2007, Volume 8, Issue 6, Article R109 Huerta-Cepas et al. />Genome Biology 2007, 8:R109
Table 1
Species included in the present phylome and their genomic coverage
Group Code Species name Source Proteins included (%) Trees (%)
Primates Hsa Homo sapiens Ensembl 21,726 (99.1%) 21,588 (100.0%)
Ptr Pan troglodytes Ensembl 17,113 (79.3%) 19,577 (90.7%)
Mmu Macaca mulatta Ensembl 19,285 (89.2%) 19,765 (91.6%)
Placental mammals Mms Mus musculus Ensembl 19,934 (78.9%) 18,825 (87.2%)
Rno Rattus norvegicus Ensembl 18,675 (85.7%) 18,585 (86.1%)
Cfa Canis familiaris Ensembl 16,657 (91.8%) 18,834 (87.2%)
Bta Bos taurus Ensembl 18,457 (79.9%) 18,736 (86.8%)
Mammals Mdo Monodelphis domestica Ensembl 17,004 (80.7%) 18,013 (83.4%)
Vertebrates Gga Gallus gallus Ensembl 12,325 (66.5%) 15,758 (73.0%)
Xtr Xenopus tropicalis Ensembl 14,721 (60.6%) 15,787 (73.1%)
Tni Tetraodon nigroviridis Ensembl 14,896 (53.4%) 14,585 (67.6%)
Fru Fugu rubripes Ensembl 15,834 (72.3%) 15,155 (70.2%)
Dre Danio rerio Ensembl 16,042 (74.9%) 14,808 (68.6%)
Chordates Cin Ciona intestinalis Ensembl 5,588 (50.9%) 9,421 (43.6%)
Metazoa Aga Anopheles gambiae Ensembl 6,131 (43.0%) 9,310 (43.1%)
Dme Drosophila melanogaster Ensembl 6,812 (49.6%) 9,771 (45.3%)
Ame Apis mellifera Ensembl 4,484 (33.4%) 8,616 (39.9%)
Cel Caenorhabditis elegans Ensembl 5,826 (29.8%) 8,190 (37.9%)
Cbr Caenorhabditis briggsae Integr8 5,171 (39.2%) 7,899 (36.6%)
Opisthokonts Ago Ashbya gossypii Integr8 2,020 (42.8%) 3,603 (16.7%)
Cal Candida albicans Other 2,733 (33.8%) 3,899 (18.1%)
Cgl Candida glabrata Integr8 2,129 (41.1%) 3,627 (16.8%)
Cne Cryptococcus neoformans Integr8 2,532 (38.5%) 4,102 (19.0%)
Dha Debaromyces hansenii Integr8 2,302 (36.5%) 3,885 (18.0%)
Ecu Encephalitozoon cuniculi Integr8 626 (32.8%) 1,203 (5.6%)
Gze Giberella zeae Integr8 3,076 (26.4%) 4,412 (20.4%)
Kla Kluyveromyces lactis Integr8 2,077 (39.1%) 3,715 (17.2%)
Ncr Neurospora crassa Other 2,521 (23.7%) 4,221 (19.6%)
Sce Saccharomyces cerevisiae Ensembl 2,317 (35.1%) 3,769 (17.5%)
Spb Schizosaccharomyces pombe Integr8 2,421 (48.8%) 4,102 (19.0%)
Yli Yarrowia lipolytica Integr8 2,487 (38.1%) 4,152 (19.2%)
Amoebozoa Ddi Dictyostelium discoideum Integr8 3,843 (29.4%) 5,165 (23.9%)
Plants Ath Arabidopsis thaliana Integr8 9,450 (26.6%) 5,390 (25.0%)
Cre Chlamydomonas reinhardtii
Other 2,303 (11.7%) 3,504 (16.2%)
Diplomonad Gth Gillardia theta Integr8 161 (35.7%) 458 (2.1%)
Apicomplexa Pfa Plasmodium falciparum Integr8 1,330 (25.3%) 2,507 (11.6%)
Pyo Plasmodium yoelii Integr8 1,188 (15.3%) 2,272 (10.5%)
Kinetoplastida Lma Leishmania major Integr8 2,082 (26.0%) 3,130 (14.5%)
Pte Paramecium tetraurelia Integr8 140 (30.2%) 345 (1.6%)
For each species: the 'Proteins included' column indicates the number of proteins present in trees of the human phylome and the percentage they represent; and the 'Trees'
column indicates the number of trees in the phylome with proteins from that species (and the percentage from the phylome it represents). 'Source' indicates the database from
which the protein data for that species were retrieved.
Genome Biology 2007, Volume 8, Issue 6, Article R109 Huerta-Cepas et al. R109.5
comment reviews reports refereed researchdeposited research interactions information
Genome Biology 2007, 8:R109
rials and methods). Unless stated otherwise, this tree was
used in all subsequent analyses. The resulting 21,588 align-
ments and 129,510 trees from the different phylogenetic
approaches are available as supplementary material accom-
panying this article [22].
Evolutionary model selection
Both ML and Bayesian analyses are model-based approaches
that can provide divergent results when different evolution-
ary models are assumed. Several authors have shown that the
use of an appropriate model is crucial for the reconstruction
of correct phylogenies and that the origin of the sequences
involved (that is, the range of organisms involved) is not
always a good predictor of the most appropriate model
[23,24]. Applying a wrong evolutionary model to a given data-
set might even lead to the reconstruction of wrong phyloge-
nies with a high support [25]. To avoid such pitfalls, we tested
using the ML approach several models that are complemen-
tary in their scope, namely: JTT [26], a general model for
globular, nuclear-encoded proteins; BLOSUM62 [27],
inferred from protein blocks of 62% sequence identity; WAG,
derived from a database of globular proteins with a broad
range of evolutionary distances [28]; and VT, based on amino
acid replacement rates suited for distantly related sequences
[29]. Additionally, phylogenies of the proteins encoded in the
mitochondrial genome were also reconstructed using mtREV,
a model that has been specifically designed for this kind of
data [30]. In all cases, a discrete gamma-distribution model
with four rate categories plus invariant positions was used.
The gamma parameter and the fraction of invariant positions
were estimated from the data.
Among the models tested, JTT was chosen as the best fitting
model in a majority of the trees (14,683, 68.0%), followed by
WAG (6,388, 29.6%), Blosum62 (461, 2.1%) and VT (26,
0.1%). MtREV was chosen as the best model in ten out of the
thirteen mitochondrial-encoded human proteins. Surpris-
ingly, the phylogenies of subunit 6 of NADH dehydrogenase
and subunits 1 and 2 of cytochrome oxidase were best fitted
by JTT, Blosum62 and WAG models, respectively.
To assess whether a tree produced by the NJ approach has
sufficient predictive value for the model selection step, we
compared the model chosen by the full ML approach (that is,
reconstructing a ML phylogeny for every model) to the model
selected when the likelihood of the seed NJ tree was assessed
under different models, allowing for branch-length optimiza-
tion. In 86.7% of the cases the model chosen by both methods
was the same. This confirms and extends earlier results [23]
and, more importantly, suggests that the pipeline can be sim-
plified by basing the model selection on the tree produced by
BioNJ.
The tree of eukaryotes and the topological diversity
within the human phylome
Recent advances in resolving the tree of eukaryotes are con-
verging into a model that comprises a few large super-groups
[31]. Despite the general agreement on the classification of
these major groups, several relationships, both among and
within the different groups, remain controversial. In recent
years, a number of large-scale approaches have been devel-
oped that combine the information obtained from several
genes to resolve evolutionary relationships. Among these, the
construction of super-trees and trees based on concatenated
alignments are among the most widely used [32]. These trees
are useful in that they constitute a straightforward way of vis-
ualizing the combined phylogenetic signal of genes that are
widespread in the species considered. However, it has been
claimed that these trees are representative of only a small
fraction of the genes encoded in a given genome, and that
gene-sampling effects might lead to biased results supporting
a specific species phylogeny [33,34].
A phylome represents a broader, yet more complex to inter-
pret, reconstruction of the evolution of an organism, since it
comprises the phylogenies of all its genes. Most notably, the
availability of a phylome opens the possibility for studying the
relationships among species in a different way: that of quan-
tifying the fraction of individual phylogenies whose topolo-
gies are consistent with a given hypothesis. Here we explored
this methodology by specifically contrasting a number of
evolutionary relationships that are controversial to some
extent. We chose three different scenarios for which there is
some level of controversy in the literature and that involve
three different depths of the eukaryotic tree (Figure 2).
Namely, the relative positions of nematodes, chordates and
arthropods, the relationships among rodents, primates and
laurasatherians, and, lastly, the grouping of opisthokonts
with amoebozoans. To scan for phylogenies compatible with
the different hypotheses, we adapted a previously described
algorithm [9] (see also Materials and methods).
Ecdysozoa versus coelomata hypotheses
Perhaps one of the most debated issues regarding the tree of
eukaryotes is the relative position of arthropods, nematodes
and chordates. Traditionally, comparative anatomy placed
arthropods and chordates in the coelomata clade, which con-
tained animals with a true body cavity, while pseudocoelo-
mates such as nematodes occupied a more basal position.
However, phylogenetic analyses of 18S and 28S rRNAs sup-
ported an alternative view that grouped nematodes and
arthropods, dubbed ecdysozoa, to the exclusion of chordates
[35]. Since then, numerous multi-gene phylogenetic studies
that support either of the hypotheses have been published
(see, among others, [36-39]).
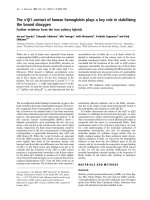
Our results (Figure 2) show a preponderance of genes whose
phylogeny is consistent with the Coelomata hypothesis. Of
the 7,080 phylogenies in the human phylome with represent-
R109.6 Genome Biology 2007, Volume 8, Issue 6, Article R109 Huerta-Cepas et al. />Genome Biology 2007, 8:R109
atives from the three groups, 3,151 (44.5%) support the Coe-
lomata hypothesis, placing nematodes at a basal position,
compared to 2,620 (37%) and 1,309 (18.5%) that group nem-
atodes with arthropods (Ecdysozoa hypothesis) or with chor-
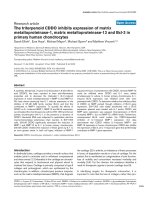
The alternative phylogenetic relationships among the taxa involved in the three evolutionary hypotheses consideredFigure 2
The alternative phylogenetic relationships among the taxa involved in the three evolutionary hypotheses considered. (a) Placental mammals: primates,
laurasatheria and rodents. (b) Ecdysozoa versus Coelomata hypothesis: relationships among arthropods, chordates and nematodes. And (c) the Unikont
hypothesis: relationship among opisthokonts, amoebozoans and other eukaryotic groups. The numbers indicate the number of trees supporting each
topology. For each alternative topology numbers on the top row refer to the total number of trees with a given topology, and what percentage of the total
it represents; numbers in the middle row refer to those trees for which the posterior probabilities of the two partitions shown in the figure are 0.9 or
higher. Numbers in the bottom row refer to the number and percentage of gene families supporting each topology.
Primates
Laurasatherians
Rodents
Primates
Laurasatherians
Rodents
Primates
Laurasatherians
Rodents
Chordates
Arthropods
Nematodes
(a)
Other groups
Chromalveolates
Opisthokonts
(b)
(c)
Chordates
Arthropods
Nematodes
Chordates
Arthropods
Nematodes
Other groups
Plants
Opisthokonts
Other groups
Amoebozoans
Opisthokonts
6589 (44.3%)
4806 (41.7%)
1966 (44.9%)
4859 (32.6%)
3459 (35.3%)
1444 (33%)
3435 (23.1%)
2258 (23%)
967 (23.1%)
3151 (44.5%)
2431 (46.5%)
1067 (43.9%)
2620 (37%)
1759 (33.6%)
810 (33.3%)
1309 (18.5%)
1040 (19.9%)
553 (22.8%)
64 (39.5%)
42 (61.7%)
34 (68%)
58 (35.8%)
13 (19.1%)
8 (16%)
31 (19.1%)
11 (16.2%)
6 (12%)
Genome Biology 2007, Volume 8, Issue 6, Article R109 Huerta-Cepas et al. R109.7
comment reviews reports refereed researchdeposited research interactions information
Genome Biology 2007, 8:R109
dates, respectively. The relative fraction of trees supporting
each topology is similar if we consider only the 5,230 trees
with the highest topology support (posterior probabilities
higher than 0.9 in the nodes grouping the considered taxa
(Figure 2). Since the algorithm treats each gene individually,
a certain level of redundancy exists because protein families
with many members in the human genome contribute more
trees to the phylome. These would affect the topological anal-
ysis if there are great differences in the distribution of family
sizes supporting each topology. To correct for this redun-
dancy we grouped the individual gene-trees into families if
their seed sequences appeared together in a tree. Then each
family was considered to support a single topology. If more
than a single topology was supported, the one supported by a
majority of members was chosen. As shown in Figure 2 (bot-
tom row), the percentage of families supporting each topol-
ogy is similar to the results obtained when genes are treated
individually.
The finding that all three possible topologies, including the
one widely considered as wrong in the literature, are sup-
ported by a significant number of trees illustrates the inher-
ent difficulty of resolving the species phylogeny from gene
phylogenies. We have found similar topological diversity in
the three scenarios considered (see below) and also, to
smaller degrees, in apparently undisputed evolutionary rela-
tionships (results not shown). Similar results showing varia-
bility in the relative positions of arthropods, nematodes and
chordates have also been found in topological analyses of the
phylogenies of 507 eukaryotic orthologous groups [38] and of
100 protein families [40]. These deviances from the species
phylogeny might be the result of different processes, includ-
ing convergent evolution or varying evolutionary rates. In the
case of the Ecdysozoa and Coelomata hypotheses, the acceler-
ated rate of evolution in the nematode sequences has been
proposed as the main cause preventing the acceptance of the
Ecdysozoa hypothesis. For instance, some studies have
shown that when fast evolving genes are removed from the
dataset, the ecdysozoa group is accepted with high confidence
[36,39]. Therefore, the relative abundance of the different
topologies should be considered with caution, since differ-
ences in evolutionary rates, if they are widespread, could
result in a majority of the gene trees supporting a wrong spe-
cies phylogeny.
Relationships among placental mammals
The phylogenetic relationship among placental mammals has
attracted great interest in recent years [41]. A still open ques-
tion is the relative grouping and branching order of the
groups rodentia, primates, lagomorpha, artyodactyla and car-
nivora. Four of these groups are represented in the present
phylome, namely primates (human, chimpanzee and
macaque), artyodactyla (cow), carnivora (dog) and rodents
(rat and mouse). While the monophily of artyodactyla and
carnivores, both belonging to laurasatheria, is largely undis-
puted, the crucial question is whether rodents have a basal
position relative to the other groups or whether they join pri-
mates on a common node. Analyses of concatenated align-
ments from nuclear genes are consistent with the rodents
being a basal group and primates being monophyletic with
laurasatheria [42,43]. However, phylogenies based on mito-
chondrial genes as well as the common presence of several
mutational events and the insertion of MLTA0 elements sup-
port the clustering of primates and rodents to the exclusion of
laurasatheria [41,44].
In our analyses the results seem to favor the basal position of
rodents, although the difference with the alternative hypoth-
esis of a clade grouping rodents and primates is not great
(Figure 2). From the 14,883 trees in the human phylome with
representatives for the three groups (Figure 2), 6,589 (44.3%)
show a topology in which rodents are basal, compared to
4,859 (32.6%) and 3,435 (23.1%) trees in which rodents are
monophyletic with primates and laurasatheria, respectively.
As in the case of arthropods, nematodes and chordates, all
possible topologies are fairly represented. Here too, differ-
ences in the relative evolutionary rates, and the possible long-
branch attraction effect, might have an effect on the high pro-
portion of trees showing rodents at a basal position, since
rodent sequences have been shown to have the highest rates
of substitutions when compared with primates and artiodac-
tyls [45,46].
Unikont hypothesis
Among the most difficult problems in the evolution of eukary-
otes is resolving the relative branching order of the major
eukaryotic groups. The evolutionary distances and the level of
sequence divergence involved results in a star-like tree with
the major eukaryotic groups branching out in a poorly
defined order. Nevertheless, phylogenetic analyses have been
used to cluster some of the groups. One such case is the union
of amoebozoans and opisthokonts, dubbed the unikonts [47].
Evidence supporting this group comes from phylogenies
based on concatenated alignments of up to 149 genes [39] as
well as from morphological data. However, this grouping is
still not widely accepted among systematicists. In the present
analysis a single amoebozoan genome, that of Dictyostellum
discoideum, has been included, together with representatives
from three other major groups, including excavates (L.
major, P. tetraurelia, G. thetha), plants (A. thaliana, C. rein-
ardthii) and chromoalveolates (P. falciparum, P. yoelii). We
scanned the phylome for trees supporting the grouping of
opisthokonts with each of the other major groups, provided
that at least four of the five major groups were represented in
the tree (Figure 2). Of the 165 trees in the human phylome
including at least four of the five major groups, 64 (39.5%)
supported the Unikont hypothesis. The alternative hypothe-
ses of opisthokots being monophyletic with either plants,
chromoalveolates or excavates are supported by 58 (35.8%),
31 (19.1%) and 9 (5.6%) trees, respectively. However, differ-
ences between the Unikont and the alternative hypotheses are
greater when only the 68 trees with high (>0.9) posterior
R109.8 Genome Biology 2007, Volume 8, Issue 6, Article R109 Huerta-Cepas et al. />Genome Biology 2007, 8:R109
probability in the partition supporting the monophyly are
considered. In this case the Unikont hypothesis is consistent,
with 42 (61.7%) trees compared to 13, 11 and 2 trees support-
ing the alternative hypotheses of opisthokonts grouping with
plants, chromoalveolates and excavates, respectively.
Lineage-specific gene duplication
During the course of evolution, gene families can increase
their size through events of gene duplication [48]. These
events may correspond to massive duplications affecting
many genes in the genome at the same time, such as in whole
genome duplications (WGDs) or may be restricted to chromo-
somal segments or specific genes. The idea that gene duplica-
tion has played a major role in evolution, acting as a source
for novel functions, was originally developed by Ohno [49].
Accumulating evidence now supports this idea. Not only
recent genomics surveys have provided evidence for the
abundance of duplicated genes in all organisms [50], but it
has also been observed that gene duplication is often associ-
ated with processes of neo-functionalization and/or sub-
functionalization [51].
To quantify the extent of gene duplication that has occurred
in the lineages leading to human, we scanned the trees to find
duplication events (see Materials and methods) and subse-
quently mapped them onto a species phylogeny that marks
the major branching points in the lineage leading to hominids
(Figure 3). The relative number of duplication events per gene
at each branching point was estimated by dividing the
number of duplication events detected at that stage by the
number of trees rooted at a deeper branching point; for exam-
ple, from a tree rooted on a fungal sequence, only duplications
following the split of fungi and metazoans were taken into
account.
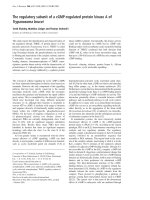
The highest peak in gene duplication events corresponds to
the base of chordate evolution, after the split of urochordates
(Ciona intestinalis) and vertebrates. This observation is con-
sistent with previous results supporting the existence of at
least one round, and probably two rounds, of whole genome
duplications before the radiation of vertebrates [52,53],
which could explain the increase in phenotypic complexity of
vertebrates relative to other chordates such as cephalochor-
dates (amphioxus) and urochordates (Ciona). The second
largest peak appears at the base of the metazoans, after their
split with fungi. The relatively large duplication rate (0.58
duplications per tree) at this point could be interpreted as a
result of a WGD at the base of metazoan evolution or, alterna-
tively, an accumulation of smaller scale duplications. To the
best of our knowledge, the possibility of a WGD at the base of
metazoan evolution has not been proposed in the literature
[54] and we believe it deserves some deeper consideration in
future analyses. If the WGD scenario is considered, then an
extensive gene loss should have followed it, since the
duplication rate here is lower than the one found at the base
of vertebrate evolution. The alternative scenario would
assume a high number of smaller scale duplications that
affected more than 50% of the genes. These duplication
events would have accumulated over the period of time
extending from the split of fungi and metazoans to the split of
chordates and other metazoans.
Also remarkable is the relatively high duplication rates found
in the lineages leading to mammals, primates and hominids.
This suggests that duplications have played a major role in the
evolution of these groups, something that has already been
noted from comparisons of primate genomes [55].
Functional trends among duplicated gene sets
The duplication of genes might result in the amplification
and/or diversification of the biological processes in which
they play a role; if this provides a selective advantage, the
duplicated copies will likely be retained. Therefore, inspect-
ing the functions of gene families that have undergone dupli-
cation at different evolutionary stages may provide clues
about the processes that played roles in the major transitions
that occurred during those stages. To detect such functional
trends we searched for Gene Ontology (GO) terms that are
significantly over-represented in the set of genes that under-
went duplications during the different stages of eukaryotic
evolution. We performed this analysis automatically with the
aid of the program Fatigo+, from the Babelomics suite [56].
At each evolutionary stage (Figure 3) we compared the
annotations of the duplicated human genes with those of the
rest of the human genome. We selected those terms whose
over-representation was significant based on a false discovery
rate test (adjusted p-value < 0.00001). Due to space limita-
tions we represent only a fraction of the over-represented
terms for the category 'biological process' (Figure 3). A com-
plete list of enriched terms in each stage is given in the sup-
plementary material [22]. The present analysis detects over-
represented functional categories among genes duplicated at
different evolutionary periods. It is, therefore, different from
complementary analyses that detect functional shifts and dif-
ferent patterns of amino acid replacement among duplicated
pairs [57,58]. Interestingly, these complementary analyses
also show differences among functional classes.
In most evolutionary stages, we found several terms from dif-
ferent GO levels and categories that are significantly over-
represented. Of these, some are specific to a given evolution-
ary transition (for example, lipid metabolism in vertebrates),
while others are over-represented in a series of consecutive
stages (for example, small GTPase signaling cascade). Provid-
ing links between the over-represented terms and the
functional or morphological transitions characteristic of each
stage is not straightforward. Nevertheless, some terms do
suggest the expansion of some physiological processes at a
given evolutionary time. Terms related to maintenance of
complex cellular structures, such as 'organelle organization
and biogenesis', 'cytoskeleton', 'cellular organization' or
'cellular localization', are over-represented in genes dupli-
Genome Biology 2007, Volume 8, Issue 6, Article R109 Huerta-Cepas et al. R109.9
comment reviews reports refereed researchdeposited research interactions information
Genome Biology 2007, 8:R109
cated before the divergence of fungi and metazoans, suggest-
ing major transitions in cellular organization common to all
opisthokonts. The expansion of the process 'small GTPase
signal transduction' in almost all major stages from the origin
of opisthokonts to the vertebrates indicates a continuous
expansion of signaling cascades that is likely related to the
increasing level of multi-cellularity and tissue differentiation
observed at these evolutionary stages. Similarly, protein fam-
ilies related to 'G-protein coupled receptor signaling pathway'
were expanded before the amniota and mammalian radia-
tions. Also remarkable are the consecutive waves of expan-
sion observed for the 'immune response' and related terms.
They have occurred at every split from the origin of tetrapods
to the origin of primates and suggest an increasing sophisti-
cation of the immune system. Xenobiotic metabolism terms
are also over-represented in genes duplicated in primates. As
noted before [55], the sophistication of the immune response
and xenobiotic recognition and detoxification might have
facilitated adaptation to changes in food sources and infec-
tious agents.
Estimates for the number of duplication events occurred at each major transition in the evolution of the eukaryotesFigure 3
Estimates for the number of duplication events occurred at each major transition in the evolution of the eukaryotes. Species abbreviations are the same as
in table 1. Horizontal bars indicate the average number of duplications per gene. Boxes on the right list some of the GO terms of the biological process
category that are significantly over-represented compared to the rest of the genome in the set of gene families duplicated at a certain stage. A full list of
significantly over represented terms is given as a table in the supplementary material [22].
Primates
Hominids
Mammals
Vertebrates
Chordates
Amniota
Tetrapods
Metazoa
Opisthokonts
Other primates:
Mmu, Ptr
Birds:
Gga
Fishes:
Tni, Fru, Dre
Other metazoans:
Dme, Aga
Ame, Cel, Cbr
Fungi:
Ago, Cal, Cgl
Cne, Cha, Ecu,
Gze, Kla, Sce,
Spb, Yil
Other:
Ath, Cre, Pfa, Pyo,
Ddi, Gth, Lma, pte
Urochordates:
Cin
Amphibians:
Xtr
Other mammals:
Mdo, Mms, Rno,
Cfa, Bta
Human
Hsa
Over-represented GO terms
Duplications/tree
DNA metabolism, DNA recombination, DNA transposition
Defense response to biotic stimulus, xenobiotic
metabolism, antigen processing/presentation, sensory
perception of smell, DNA transposition.
Response to biotic stimulus, immune/defense response,
sensory perception, cell surface receptor linked signal
transduction, G-protein coupled receptor signaling
pathway, nucleosome assembly, chromatin (dis)assembly.
Immune/defense response, respond to pathogen/parasite,
respond to virus, antigen processing/presentation, sensory
perception, G-protein coupled receptor signaling pathway.
Tissue development, immune/defense response, ectoderm/
epidermis development, antigen processing/presentation.
Nervous system development, cell adhesion, intracellular
signaling cascade, morphogenesis, establishment of
localization, lipid metabolism, ion transport, small GTPase
signal transduction, transmission of nerve impulse.
Ion and amine transport, cell adhesion, establishment of
localization.
Organelle organization and biogenesis, protein metabolism,
phosphorylation, cellular localization, intracellular transport,
cytoskeleton organization and biogenesis, small GTPase
signal transduction.
0.0 0.2 0.4 0.6 0.8 1.0 1.2 1.4
FatiGO+ results
Cellular localization, regulation of enzyme activity, ion
transport, protein metabolism, small GTPase signal
transduction, posphorylation, carbohydrate metabolism.
R109.10 Genome Biology 2007, Volume 8, Issue 6, Article R109 Huerta-Cepas et al. />Genome Biology 2007, 8:R109
The specific association of terms such as 'transmission of
nerve pulse' or 'nervous system development' with families
duplicated just before the vertebrate expansion is consistent
with the development of a complex nervous system as com-
pared to that of simpler chordates. Later on, the expansion of
'sensory perception' and related terms in the lineages leading
to amniota, mammals and primates indicates increasing
sophistication of the senses. Similarly, the term 'epidermis
development' is over-represented in genes duplicated in
tetrapods. This might be related to major skin modifications,
which potentially allowed the conquering of the terrestrial
environment by this group.
Absence of horizontal transfers of eukaryotic genes in
the human lineage
The extent and scope of horizontal gene transfer (HGT)
events among organisms has been the subject of intense
debate [59]. The emerging view is that HGT constitutes an
important process of evolution in prokaryotes and that it is
more restricted, if not virtually absent, in eukaryotes. How-
ever, as more eukaryotic genomes are being sequenced, the
number of putative cases of gene transfers in eukaryotes is
growing. Reported cases include acquisition of prokaryotic
genes [60-62] and transfers of mitochondrial genes between
plants [63] and between animals [64]. Horizontal gene trans-
fer in the human genome has been addressed in the past. For
instance, after the initial sequencing of the human genome
the claim was made that up to 223 bacterial genes, likely
acquired by HGT, could be found in the human genome [65].
This claim, however, was later rejected on the basis of phylo-
genetic analysis [66]. The existence of horizontally trans-
ferred genes from other eukaryotes in the human genome has
never been reported despite the fact that integrative viral
sequences can migrate between vertebrate species and that
these viruses can sometimes carry genes within their
sequences, making the hypothesis theoretically plausible
[67].
The species represented in our phylome include organisms
that are tightly linked to human, either because they are path-
ogens (plasmodium and several fungi), or used as a source of
food (cow, yeast). A recent transfer from any of these species
to the human genome could, in principle, be detected as a
human protein being placed in a 'wrong' phylogenetic con-
text. However, caution must be taken when interpreting phy-
logenies, since such topologies can also be explained by
alternative processes such as multiple gene-loss or lack of
phylogenetic resolution.
To find such putative cases we scanned the human phylome
to detect trees in which the phylogenetic position of the
human seed protein could suggest a possible HGT event. For
this purpose we applied a series of increasingly stringent fil-
ters. These filters consisted in identifying trees in which: the
human seed protein has non-primate proteins as nearest phy-
logenetic neighbors; such topology cannot be explained sim-
ply by the loss of the orthologous sequences in the other
primates or multiple losses in mammalian groups; the parti-
tion suggesting the HGT is supported by a high posterior
probability (>0.9) in the Bayesian analysis; and that partition
is also supported by ML analysis. This methodology bears
some similarity to that proposed by Hallet et al. [68] in that it
specifically defines possible scenarios for HGT.
A total of 99 trees (0.47%) passed the first two filters, thus
having a topology that could be explained by an HGT event.
However, only 8 of these trees had a posterior probability
supporting the HGT partition of 0.9 or higher in the Bayesian
analysis, and none of these was supported by the ML analy-
ses, indicating that the partitions suggesting the horizontal
transfer are not strongly supported.
We interpret these results as a lack of evidence supporting the
existence of human genes originating from recent horizontal
transfers from the lineages considered and argue that the
observed HGT-like topologies are rather the result of phylo-
genetic artifacts. This interpretation is consistent with the
generally adopted view that horizontal gene transfers among
multi-cellular eukaryotes is virtually absent due to the exist-
ing natural barriers that prevent transferred genes from
reaching the germ-line [69].
Towards a complete catalogue of orthology and
paralogy relationships
Although an increasing number of genome-wide experimen-
tal datasets is becoming available for human, most experi-
mental analyses are performed in model species such as
mouse, fruit fly, yeast and the nematode Caenorhabditis ele-
gans. Additionally, for historical or practical reasons, alterna-
tive model species are used to investigate specific systems or
pathways. Such is the case with the use of Neurospora crassa,
Yarrowia lipolytica and Bos taurus models in the character-
ization of the multiprotein enzyme NADH:Ubiquinone oxi-
doreductase (Complex I), in which an intricate evolution and
the use of different naming schemas in the various species
complicate the transfer of knowledge among investigators
studying the different model species [70].
Comparative genomics can be used for transferring func-
tional information across species, a process that requires the
establishment of evolutionary relationships among genes
encoded in the different genomes. Such relationships are best
established by means of detecting orthology, rather than just
homology. Orthologs are a special case of homologous genes
that diverged from a common ancestor through speciation
events, in contrast to paralogs, which originate from duplica-
tion events [71]. Since orthologs are, relative to paralogs,
more likely to share a common function, the correct determi-
nation of orthology has deep implications for the transfer of
functional information across organisms. This is not, how-
ever, the only application of orthology determination. For
instance, the establishment of equivalences among genes in
Genome Biology 2007, Volume 8, Issue 6, Article R109 Huerta-Cepas et al. R109.11
comment reviews reports refereed researchdeposited research interactions information
Genome Biology 2007, 8:R109
different genomes is a pre-requisite for comparing genomics
data, something that, in turn, allows the detection of evolu-
tionarily conserved functional associations [72].
The need for detecting orthology at a genome-scale has trig-
gered the development of a variety of automatic approaches
that identify orthology relationships by means of similarity
searches. The first and still most widely used such method is
based on the detection of best reciprocal hits (BRHs), that is,
pairs of sequences from different species that are, recipro-
cally, the best hit of each other in a sequence search [73].
Extensions of the BRH approach include the definition of 'tri-
angular' BRH relationships across a minimum of three spe-
cies [48], and recent implementations thereof, such as Inpar-
anoid [74] or OrthoMCL [75], that include closely related
paralogs in the orthologous groups. Although these methods
perform reasonably well in most cases, they have been shown
to present many drawbacks that can lead to annotation errors
or misinterpretation of data [76,77]. More recently, in an
attempt to approximate the classic, phylogeny-based
approach, several automatic methods have been proposed
that delineate orthology relationships from phylogenetic
trees. Generally, these methods rely on the detection of dupli-
cation and speciation events by comparing the gene tree with
the species tree [78]. Several databases have been developed
that employ such algorithms to derive orthology relationships
from automatically reconstructed trees [79-81]. However,
these methods are very sensitive to slight variations in the
topology of the gene tree and, when applied at a large-scale,
they may perform similarly or even worse than standard pair-
wise methods [82]. Some recent developments that use soft-
parsimony [83] and model-based approaches [84] for tree-
reconciliation allow some level of uncertainty in both the
gene-tree and the species-tree.
Considering the high degree of topological diversity observed
in the human phylome (see above), we reasoned that any
algorithm based on reconciliation with a specific species tree
would inevitably infer false duplication events in the trees
showing topologies that depart from the canonical species
tree. Therefore, we decided to explore an alternative, fully
automated approach that does not require a fully resolved
species phylogeny and a reconciliation phase. The algorithm
(see Materials and methods) uses the level of overlap in the
species connected to two related nodes to decide whether
their parental node represents a duplication or speciation
event. The full list of predicted ortology and paralogy rela-
tionships is provided as supplementary material [22].
We compared our predictions with those from other algo-
rithms by using a recent reference dataset comprising 67
human-mouse and 45 human-worm orthologous pairs from
five multi-gene families [82]. Considering the size of the fam-
ilies and the intricate evolutionary histories involved, this ref-
erence set should be considered a highly stringent test. For
each of the methods compared we computed the sensitivity,
which is a measure of the coverage over the reference set, and
the positive predictive value, which is the proportion of cor-
rect orthology predictions, that is, the number of true posi-
tives over the sum of true positives and false negatives. The
results of the benchmark showed narrow differences in terms
of sensitivity (Figure 4). All methods are able to predict only
about half (40% to 66%) of the orthologous pairs in the refer-
ence set. Our method scores second best, with 61.6% sensitiv-
ity compared to 66.1% for the clusters of eukaryotic
orthologous genes (KOG) method; Ensembl reaches a cover-
age of 55.57%. As we noted before, this low coverage reflects
the inherent difficulty of the reference set, in which manual
orthology assignments have taken into account domain
organization analysis and other sources of information.
Most remarkable are the big differences encountered in the
positive predictive values. These range from 2.8% (KOG) to
86.61% (our algorithm) and 95.24% (Ensembl). Altogether,
the results show that phylogeny-based orthology detection
methods can provide substantial improvement in terms of
positive predictive value when sophisticated phylogenetic
pipelines are implemented. Note that the other phylogeny-
based method included (Phylogenetic tree, PGT), uses NJ
trees. The low rate of false positive prediction achieved by
sophisticated phylogeny-based methods makes them espe-
Benchmarking comparison of different orthology inference algorithmsFigure 4
Benchmarking comparison of different orthology inference algorithms.
The reference set used in the benchmark of Hulsen et al. [82] is taken as a
gold standard to compute the number of true positives (TP), false positives
(FP) and false negatives (FN) yielded by each method. For each method the
sensitivity (S = TP/(TP+FN)) and the positive predictive value (P = TP/(TP
+ FP)) are computed. Methods described in [82] are indicated as BBH
(Best reciprocal hits), MCL (OrthoMCL), ZIH (Z-score 1-hundred.), INP
(Inparanoid), PGT (phylogeny-based algorithm used in [95]), KOG
(Clusters of eukaryotic orthologous goups). 'Phylome' represents the
results of our pipeline and algorithm, and Ensbl the orthology relationships
predicted by Ensembl database.
0 20406080100
0 20406080100
Percentage sensitivity (TP/TP+FN)
Percentage positive predictive value (TP/TP+FP)
BBH
INP
KOG
MCL
PGT
ZIH
Phylome
Ensbl
R109.12 Genome Biology 2007, Volume 8, Issue 6, Article R109 Huerta-Cepas et al. />Genome Biology 2007, 8:R109
cially suited for cases in which orthology prediction is used for
the transfer of functional annotations among model species.
In such cases, minimizing the level of wrong assignments,
which will lead to wrong annotations, is more important than
reaching a high coverage at a cost of many false assignments.
Conclusion
We have shown the feasibility of reconstructing complex phy-
lomes, comprising the evolutionary histories of all genes from
a given species and their homologs in dozens of other
genomes. The pipeline and genome sampling is fully auto-
mated and can easily be tailored for specific needs, therefore
paving the way for the reconstructions of other phylomes
using different parameters or species sampling. Because of its
significance, we have initially applied this pipeline to the
human genome. The resulting phylome constitutes a valuable
dataset that can be explored by the research community. In
the near future we are planning to implement this and other
phylomes in a fully searchable database. To illustrate the
potential of the human phylome we have performed several
analyses, but many others can be envisaged. Overall, our
results indicate that there is a great topological diversity
affecting the three unresolved scenarios that we have dis-
cussed (ecdysozoa versus coelomata, relationships among
rodents, primates and laurasatheria and the unikont hypoth-
esis). This and other recent findings [85] reinforce the older
view [86] that topological differences among phylogenies of
proteins are to be expected even in the absence of HGT and
underscore the danger of gene-sampling effects when com-
bining the phylogenetic signals of several genes [34]. We
share the view of others [87] that there is an urgent need for
improved models of molecular evolution that account for the
inherent phylogenetic noise in the protein record and of new
genomic characters that are less prone to homoplastic effects.
We have found that such noise may eventually produce HGT-
like topologies, highlighting the need for stringent cut-offs
and alternative tests before an HGT event is assumed.
Mapping speciation and duplication events on the complete
phylome has allowed us to derive a comprehensive set of
orthology and paralogy relationships among the genomes
involved. The results obtained in the benchmark analysis
show that although automatic methods for phylogeny-based
detection of orthology are progressing in the right direction,
there is still room for improvement both in the algorithms
and the quality of the trees. Taking into account the levels of
topological diversity mentioned above, it follows that the
algorithms for phylogeny-based orthology detection need to
cope with levels of topological uncertainty.
The results obtained in the present analysis are consistent
with the existence of at least one round of whole genome
duplication occurring before the radiation of verebrates [49].
If a relatively high level of gene loss in eukaryotic genomes is
assumed [88], the finding of an average level of duplication
events per tree higher than one would indeed favor the
scenario of two rounds of whole genome duplication at that
evolutionary stage (2R hypothesis).
Materials and methods
Sequence data
Proteomes derived from 39 fully sequenced eukaryotic
genomes (Table 1) were downloaded from Ensembl v36 [12]
and the Integr8 database at EBI [89], except those of Candida
albicans [90]N. crassa [91] and C. reinhardtii [92]. Wher-
ever mitochondrial proteins were not included in the gene set
per species, these were downloaded separately from the NCBI
eukaryotic organelles site. Mitochondrial genomes from
Caenorhabditis briggsae, Giberella zeae, Debaromyces
hansenii and Leishmania major have apparently not been
deposited in the public databases and, therefore, are missing
from this study. The final proteome database contains
542,423 unique protein sequences from 39 different genomes
(Table 1).
Database searches
For each human protein a Smith-Waterman [93] search was
performed against the above-mentioned proteome database
to retrieve a set of proteins with a significant similarity (E-
value < 10
-3
). Only sequences that aligned with a continuous
region longer than 50% of the query sequence were selected.
Multiple sequence alignment and phylogenetic
reconstructions
Sets of homologous protein sequences were aligned using
MUSCLE 3.6 [94]. Positions in the alignment with gaps in
more than 10% of the sequences were eliminated before the
phylogenetic analysis, unless this procedure removed more
than one-third of the positions in the alignment. In such cases
the percentage of sequences with gaps allowed was automati-
cally increased until at least two-thirds of the initial positions
were conserved.
NJ trees were derived using scoredist distances as imple-
mented in BioNJ [18]. ML trees were derived from the align-
ments using PhyML v2.4.4 [19]. For each protein family ML
trees were reconstructed with four different evolutionary
models (JTT, WAG, BLOSUM62 and VT), except for the 13
mitochondrially encoded proteins in which the mtREV model
was also used. In all cases a discrete gamma-distribution
model with four rate categories plus invariant positions was
used, the gamma parameter and the fraction of invariant
positions were estimated from the data. The evolutionary
model best fitting the data was determined by comparing the
likelihood of the used models according to the AIC criterion
[20].
To obtain support values of all tree partitions, the ML tree
produced by the best-fitting model was used as a seed for a
Bayesian analysis by running Mr Bayes [21] for 100,000 gen-
Genome Biology 2007, Volume 8, Issue 6, Article R109 Huerta-Cepas et al. R109.13
comment reviews reports refereed researchdeposited research interactions information
Genome Biology 2007, 8:R109
erations in two runs of two chains each, using the best-fitting
model, as determined in the ML analysis, but allowing branch
swapping and re-estimation of the gamma distribution
parameters. The posterior probability of each tree partition
was estimated by sampling the trees every 100 generations
after discarding the first 25%. This approach to obtain sup-
port values was faster than performing standard bootstrap
analysis with PhyML. Starting the MrBayes runs with an
already optimized tree resulted in fair levels of convergence
being reached after fewer generations than in standard
MrBayes analyses.
A final tree produced by this Bayesian reconstruction consists
of a consensus phylogeny, using the 'halfcompat' option in
MrBayes, in which partitions with a posterior probability
lower than 0.5 are collapsed. The alignments and all trees
produced for each human protein are made available as sup-
plemental information [22]. Unless stated otherwise the con-
sensus tree produced by MrBayes analysis was used in all
analyses.
Inference of duplication and speciation events and
orthology assignment using a novel algorithm
independent of species-tree reconciliation
We used a phylogeny-based algorithm to detect duplication
and speciation events on the trees. In contrast to alternative
phylogeny-based methods that use reconciliation of the gene
tree with the species tree to infer duplication events, our
approach does not require any previous fully resolved species
topology. The only evolutionary information required is that
used to root the trees to define a polarity so each internal node
is connected to two children nodes. The orthology prediction
algorithm was run independently for each human gene using
the tree generated using its protein sequence as a seed. The
algorithm was implemented in a series of python scripts spe-
cifically developed for this project.
To map duplication and speciation events on an internal node
of the tree, the algorithm proceeds as follows. First, two tree
partitions are defined that contain the sequences connected
to each of the two children nodes. Second, a species-overlap
score is defined between the two partitions as follows: species
common to both partitions/species in any of the partitions.
Third, if the score is higher than a given threshold the node is
mapped as a duplication event, otherwise it is considered a
speciation event. In the present study the species-overlap
threshold was set to 0.0 - that is, no common species between
the two partitions were allowed - because this produced the
best results in the benchmark. The algorithm does so for all
internal nodes in the tree. Once all the nodes in the tree are
marked as a duplication or speciation event, the algorithm
establishes orthology relationships between the seed protein
and other proteins in the tree. For each protein, the algorithm
tracks the nodes that connect it to the seed protein and estab-
lishes an orthology relationship only if this connection pro-
ceeds exclusively through speciation nodes, disregarding
intra-specific duplications. After mapping speciation and
duplication nodes onto the phylogeny, several situations may
arise in which orthology relationships are not one-to-one
relationships, but rather one-to-many or many-to-many.
To root the trees the following procedure was used. The spe-
cies present in the tree were grouped according to the branch-
ing pattern of the tree in Figure 3; thus, non-opisthokont
species constitute the deepest group, followed by 'fungi',
'other metazoans', 'urochordates', and so on. Among the
sequences belonging to the deepest group with representa-
tives in the tree, the one with the longest distance to the seed
protein was chosen as the out-group.
Assigning duplications to different evolutionary periods
The duplication events detected by the algorithm described
above can be assigned to different evolutionary periods by
examining the species represented after the duplication
event. To do so we used as a reference a set of clearly defined
phylogenetic relationships that mark the major branching
points in the lineage leading to hominids (Figure 3). For each
duplication event, all the species represented after the dupli-
cation node are tracked and the duplication is assigned to the
deepest branching point in the reference tree that contains all
these species. For instance, if only sequences from mammals
and fishes are found after the duplication event, this duplica-
tion is assigned to the branching point that is at the base of
vertebrates.
The orthology detection algorithm can detect only duplica-
tions that occurred after the root of the tree; for example, if a
tree is rooted in a fungal sequence, only duplications that
occurred in the metazoan lineage could be detected. There-
fore, to compare the results obtained at the different evolu-
tionary stages we computed the relative number of
duplication events per gene at each branching point. This was
done by dividing the number of duplication events mapped at
a particular evolutionary stage by the number of trees rooted
at a deeper branching point; for example, duplications that
occurred at the base of metazoans were divided by the
number of trees rooted on either a fungal or a non-
opisthokont sequence.
Topology scanning algorithm
The algorithm used here to search for specific topologies
within the phylome is described elsewhere [9]. In brief, from
an un-rooted tree the algorithm generates all possible parti-
tions that contain the seed sequence. That is, the algorithm
proceeds sequentially throughout all internal edges of the
tree. At each internal edge it generates two partitions, of
which only one contains the seed sequence. The species rep-
resented in each such partition are tracked and those trees
with a partition fulfilling a set of rules defined by the user are
selected. The set of rules defined by the user are defined as a
set of species that are allowed in a partition, and rules can be
combined so that specific evolutionary scenarios are defined.
R109.14 Genome Biology 2007, Volume 8, Issue 6, Article R109 Huerta-Cepas et al. />Genome Biology 2007, 8:R109
For instance, a partition supporting the grouping of rodents
and primates to the exclusion of laurasatherians can be
defined as a partition containing any sequence (s) from pri-
mates (Homo sapiens, Macacca mulata, Pan troglodites)
and any sequence (s) from rodents (Mus musculus, Rattus
norvergicus) within a larger partition that contains these
sequence plus any sequence (s) from Laurasatherians (Canis
familiaris, Bos taurus). Sequences from other species are not
allowed in the partition and the presence of the seed sequence
in the partition is required. This algorithm has been imple-
mented in a series of Python scripts developed for this
project.
In the topology scanning analyses presented here we dis-
carded the trees based on alignments in which less than 100
columns were left after applying the gap filter. This procedure
eliminated 1,714 (7.9%) from the total phylome.
Benchmarking
The reference set used in a recent benchmark of orthology
assignment methods [82] is used to compute the number of
true positives (TPs), false positives (FPs) and false negatives
(FNs) yielded by each method. For each method the sensitiv-
ity, S = TP/(TP + FN), and the positive predictive value, P =
TP/(TP + FP), were computed.
Additional data files
The following additional data are available with the on-line
version of this paper. Additional data file 1 is a table listing the
over-represented GO terms in the duplicatons depicted in
Figure 3. Additional data file 2 is a table listing the orthologs
predicted for every human protein.
Additional data file 1Over-represented GO terms in the duplicatons depicted in Figure 3Over-represented GO terms in the duplicatons depicted in Figure 3Click here for fileAdditional data file 2Orthologs predicted for every human proteinOrthologs predicted for every human proteinClick here for file
Acknowledgements
A significant part of the computational analysis presented in this paper has
been performed at the Mare Nostrum supercomputer (Barcelona Super-
computing Center). JHC is supported by a grant from the Fundación
Genoma España and the Instituto Nacional de Bioinformática. TG is a recip-
ient of an EMBO long-term fellowship (LTF 402-2005). Part of this study is
funded by grants from the Spanish Science Ministry BFU2006-15413-C02-
02 and Generalitat Valenciana GV06/080 and the National Institute of Bio-
informatics a platform of Genoma España. We acknowledge Tim Hulsen for
kindly providing the predicted orthologous pairs used in the benchmark.
We are grateful to Jordi Burguet and Anibal Bueno Amorós for providing
technical support and to Leo Arbiza and other members of the department
for discussions.
References
1. McPherson JD, Marra M, Hillier L, Waterston RH, Chinwalla A, Wallis
J, Sekhon M, Wylie K, Mardis ER, Wilson RK, et al.: A physical map
of the human genome. Nature 2001, 409:934-941.
2. Venter JC, Adams MD, Myers EW, Li PW, Mural RJ, Sutton GG, Smith
HO, Yandell M, Evans CA, Holt RA, et al.: The sequence of the
human genome. Science 2001, 291:1304-1351.
3. Suzuki Y, Sugano S: Transcriptome analyses of human genes
and applications for proteome analyses. Curr Protein Pept Sci
2006, 7:147-163.
4. Humphery-Smith I: A human proteome project with a begin-
ning and an end. Proteomics 2004, 4:2519-2521.
5. Gandhi TK, Zhong J, Mathivanan S, Karthick L, Chandrika KN, Mohan
SS, Sharma S, Pinkert S, Nagaraju S, Periaswamy B, et al.: Analysis of
the human protein interactome and comparison with yeast,
worm and fly interaction datasets. Nat Genet 2006, 38:285-293.
6. Nielsen J, Oliver S: The next wave in metabolome analysis.
Trends Biotechnol 2005, 23:544-546.
7. Benner SA: Interpretive proteomics - finding biological mean-
ing in genome and proteome databases. Adv Enzyme Regul
2003, 43:271-359.
8. Sicheritz-Ponten T, Andersson SG: A phylogenomic approach to
microbial evolution. Nucleic Acids Res 2001, 29:545-552.
9. Gabaldón T, Huynen MA: Reconstruction of the proto-mito-
chondrial metabolism. Science 2003, 301:609.
10. Gabaldón T: Evolution of proteins and proteomes, a phyloge-
netics approach. Evolutionary Bioinformatics Online 2005, 1:51-56.
11. Huynen MA, Gabaldon T, Snel B: Variation and evolution of bio-
molecular systems: searching for functional relevance. FEBS
Lett 2005, 579:1839-1845.
12. Birney E, Andrews D, Caccamo M, Chen Y, Clarke L, Coates G, Cox
T, Cunningham F, Curwen V, Cutts T, et al.: Ensembl 2006. Nucleic
Acids Res 2006:D556-561.
13. Li H, Coghlan A, Ruan J, Coin LJ, Heriche JK, Osmotherly L, Li R, Liu
T, Zhang Z, Bolund L, et al.: TreeFam: a curated database of phy-
logenetic trees of animal gene families. Nucleic Acids Res
2006:D572-580.
14. Duret L, Mouchiroud D, Gouy M: HOVERGEN: a database of
homologous vertebrate genes. Nucleic Acids Res 1994,
22:2360-2365.
15. Roth C, Betts MJ, Steffansson P, Saelensminde G, Liberles DA: The
Adaptive Evolution Database (TAED): a phylogeny based
tool for comparative genomics. Nucleic Acids Res
2005:D495-497.
16. Blackstone NW, Green DR: The evolution of a mechanism of
cell suicide. Bioessays 1999, 21:84-88.
17. Fisher SE, Marcus GF: The eloquent ape: genes, brains and the
evolution of language. Nat Rev Genet 2006, 7:9-20.
18. Gascuel O: BIONJ: an improved version of the NJ algorithm
based on a simple model of sequence data. Mol Biol Evol 1997,
14:685-695.
19. Guindon S, Gascuel O: A simple, fast, and accurate algorithm
to estimate large phylogenies by maximum likelihood. Syst
Biol 2003, 52:696-704.
20. Akaike H: Information theory and extension of the maximum
likelihood principle. In Proceedings of the 2nd International Sympo-
sium on Information Theory: 1973; Budapest, Hungary Edited by: Institute
of Electrical & Electronics Engineers. Piscataway, NJ; 1973:267-281.
21. Ronquist F, Huelsenbeck JP: MrBayes 3: Bayesian phylogenetic
inference under mixed models. Bioinformatics 2003,
19:1572-1574.
22. Supplementary material [ />human_phylome/human_phylome.html]
23. Keane TM, Creevey CJ, Pentony MM, Naughton TJ, McLnerney JO:
Assessment of methods for amino acid matrix selection and
their use on empirical data shows that ad hoc assumptions
for choice of matrix are not justified. BMC Evol Biol 2006, 6:29.
24. Bruno WJ, Halpern AL: Topological bias and inconsistency of
maximum likelihood using wrong models. Mol Biol Evol 1999,
16:564-566.
25. Buckley TR, Cunningham CW: The effects of nucleotide substi-
tution model assumptions on estimates of nonparametric
bootstrap support. Mol Biol Evol 2002, 19:394-405.
26. Jones DT, Taylor WR, Thornton JM: The rapid generation of
mutation data matrices from protein sequences. Comput Appl
Biosci 1992, 8:275-282.
27. Henikoff S, Henikoff JG: Amino acid substitution matrices from
protein blocks. Proc Natl Acad Sci USA 1992, 89:10915-10919.
28. Whelan S, Goldman N: A general empirical model of protein
evolution derived from multiple protein families using a
maximum-likelihood approach. Mol Biol Evol 2001, 18:691-699.
29. Müller T, Vingron M: Modeling amino acid replacement. J Com-
put Biol 2000, 7:761-776.
30. Adachi J, Hasegawa M: Model of amino acid substitution in pro-
teins encoded by mitochondrial DNA. J Mol Evol 1996,
42:459-468.
31. Keeling PJ, Burger G, Durnford DG, Lang BF, Lee RW, Pearlman RE,
Roger AJ, Gray MW: The tree of eukaryotes. Trends Ecol Evol
2005, 20:670-676.
32. Delsuc F, Brinkmann H, Philippe H: Phylogenomics and the
reconstruction of the tree of life. Nat Rev Genet 2005, 6:361-375.
Genome Biology 2007, Volume 8, Issue 6, Article R109 Huerta-Cepas et al. R109.15
comment reviews reports refereed researchdeposited research interactions information
Genome Biology 2007, 8:R109
33. Jeffroy O, Brinkmann H, Delsuc F, Philippe H: Phylogenomics: the
beginning of incongruence? Trends Genet 2006, 22:225-231.
34. Dagan T, Martin W: The tree of one percent. Genome Biol 2006,
7:118.
35. Aguinaldo AM, Turbeville JM, Linford LS, Rivera MC, Garey JR, Raff
RA, Lake JA: Evidence for a clade of nematodes, arthropods
and other moulting animals. Nature 1997, 387:489-493.
36. Dopazo H, Dopazo J: Genome-scale evidence of the nematode-
arthropod clade. Genome Biol 2005, 6:R41.
37. Ciccarelli FD, Doerks T, von Mering C, Creevey CJ, Snel B, Bork P:
Toward automatic reconstruction of a highly resolved tree
of life. Science 2006, 311:1283-1287.
38. Wolf YI, Rogozin IB, Koonin EV: Coelomata and not Ecdysozoa:
evidence from genome-wide phylogenetic analysis. Genome
Res 2004, 14:29-36.
39. Philippe H, Snell EA, Bapteste E, Lopez P, Holland PW, Casane D:
Phylogenomics of eukaryotes: impact of missing data on
large alignments. Mol Biol Evol 2004, 21:1740-1752.
40. Blair JE, Hedges SB: Molecular phylogeny and divergence times
of deuterostome animals. Mol Biol Evol 2005, 22:2275-2284.
41. Murphy WJ, Pevzner PA, O'Brien SJ: Mammalian phylogenomics
comes of age. Trends Genet 2004, 20:631-639.
42. Kullberg M, Nilsson MA, Arnason U, Harley EH, Janke A: House-
keeping genes for phylogenetic analysis of eutherian
relationships. Mol Biol Evol 2006, 23:1493-1503.
43. Misawa K, Janke A: Revisiting the Glires concept - phylogenetic
analysis of nuclear sequences. Mol Phylogenet Evol 2003,
28:320-327.
44. Thomas JW, Touchman JW, Blakesley RW, Bouffard GG, Beckstrom-
Sternberg SM, Margulies EH, Blanchette M, Siepel AC, Thomas PJ,
McDowell JC, et al.: Comparative analyses of multi-species
sequences from targeted genomic regions. Nature 2003,
424:788-793.
45. Ohta T: Synonymous and nonsynonymous substitutions in
mammalian genes and the nearly neutral theory. J Mol Evol
1995, 40:56-63.
46. Zhang J: Rates of conservative and radical nonsynonymous
nucleotide substitutions in mammalian nuclear genes. J Mol
Evol 2000, 50:56-68.
47. Cavalier-Smith T: The phagotrophic origin of eukaryotes and
phylogenetic classification of Protozoa. Int J Syst Evol Microbiol
2002, 52:297-354.
48. Tatusov RL, Koonin EV, Lipman DJ: A genomic perspective on
protein families. Science 1997, 278:631-637.
49. Ohno S: Evolution by Gene Duplication London: Allen and Unwin; 1970.
50. Vogel C, Chothia C: Protein family expansions and biological
complexity. PLoS Comput Biol 2006, 2:e48.
51. Roth C, Rastogi S, Arvestad L, Dittmar K, Light S, Ekman D, Liberles
DA: Evolution after gene duplication: models, mechanisms,
sequences, systems, and organisms. J Exp Zoolog B Mol Dev Evol
2007, 308B:58-73.
52. Panopoulou G, Hennig S, Groth D, Krause A, Poustka AJ, Herwig R,
Vingron M, Lehrach H: New evidence for genome-wide duplica-
tions at the origin of vertebrates using an amphioxus gene
set and completed animal genomes. Genome Res 2003,
13:1056-1066.
53. Blomme T, Vandepoele K, De Bodt S, Simillion C, Maere S, Van de
Peer Y: The gain and loss of genes during 600 million years of
vertebrate evolution. Genome Biol 2006, 7:R43.
54. Meyer A: Molecular evolution: Duplication, duplication.
Nature 2003, 421:
31-32.
55. Bailey JA, Eichler EE: Primate segmental duplications: crucibles
of evolution, diversity and disease. Nat Rev Genet 2006,
7:552-564.
56. Al-Shahrour F, Minguez P, Tarraga J, Montaner D, Alloza E, Vaquerizas
JM, Conde L, Blaschke C, Vera J, Dopazo J: BABELOMICS: a sys-
tems biology perspective in the functional annotation of
genome-scale experiments. Nucleic Acids Res 2006:W472-476.
57. Abhiman S, Sonnhammer EL: FunShift: a database of function
shift analysis on protein subfamilies. Nucleic Acids Res
2005:D197-200.
58. Seoighe C, Johnston CR, Shields DC: Significantly different pat-
terns of amino acid replacement after gene duplication as
compared to after speciation. Mol Biol Evol 2003, 20:484-490.
59. Kurland CG, Canback B, Berg OG: Horizontal gene transfer: a
critical view. Proc Natl Acad Sci USA 2003, 100:9658-9662.
60. Andersson JO, Sjogren AM, Davis LA, Embley TM, Roger AJ: Phylo-
genetic analyses of diplomonad genes reveal frequent lateral
gene transfers affecting eukaryotes. Curr Biol 2003, 13:94-104.
61. Ricard G, McEwan NR, Dutilh BE, Jouany JP, Macheboeuf D, Mit-
sumori M, McIntosh FM, Michalowski T, Nagamine T, Nelson N, et al.:
Horizontal gene transfer from Bacteria to rumen Ciliates
indicates adaptation to their anaerobic, carbohydrates-rich
environment. BMC Genomics 2006, 7:22.
62. Goldsmith MR, Shimada T, Abe H: The genetics and genomics of
the silkworm, Bombyx mori. Annu Rev Entomol 2005, 50:71-100.
63. Bergthorsson U, Adams KL, Thomason B, Palmer JD: Widespread
horizontal transfer of mitochondrial genes in flowering
plants. Nature 2003, 424:197-201.
64. Alvarez N, Benrey B, Hossaert-McKey M, Grill A, McKey D, Galtier
N: Phylogeographic support for horizontal gene transfer
involving sympatric bruchid species. Biol Direct 2006, 1:21.
65. Lander ES, Linton LM, Birren B, Nusbaum C, Zody MC, Baldwin J,
Devon K, Dewar K, Doyle M, FitzHugh W, et al.:
Initial sequencing
and analysis of the human genome. Nature 2001, 409:860-921.
66. Salzberg SL, White O, Peterson J, Eisen JA: Microbial genes in the
human genome: lateral transfer or gene loss? Science 2001,
292:1903-1906.
67. Bromham L: The human zoo: endogenous retroviruses in the
human genome. Trends Ecol Evol 2002, 17:160.
68. Hallet M, Lagergren J, Tofigh A: Simultaneous identification of
duplications and lateral transfers. In Proceedings of the Eighth
Annual International Conference on Research In Computational Molecular
Biology: 2004; San Diego, California, USA ACM press. New York;
2004:347-356.
69. Kurland CG: What tangled web: barriers to rampant horizon-
tal gene transfer. Bioessays 2005, 27:741-747.
70. Gabaldón T, Rainey D, Huynen MA: Tracing the evolution of a
large protein complex in the eukaryotes, NADH:ubiquinone
oxidoreductase (Complex I). J Mol Biol 2005, 348:857-870.
71. Fitch WM: Distinguishing homologous from analogous
proteins. Syst Zool 1970, 19:99-113.
72. Gabaldón T, Huynen MA: Prediction of protein function and
pathways in the genome era. Cell Mol Life Sci 2004, 61:930-944.
73. Huynen MA, Bork P: Measuring genome evolution. Proc Natl
Acad Sci USA 1998, 95:5849-5856.
74. O'Brien KP, Remm M, Sonnhammer EL: Inparanoid: a compre-
hensive database of eukaryotic orthologs. Nucleic Acids Res
2005:D476-480.
75. Li L, Stoeckert CJ Jr, Roos DS: OrthoMCL: identification of
ortholog groups for eukaryotic genomes. Genome Res 2003,
13:2178-2189.
76. Eisen JA: Phylogenomics: improving functional predictions for
uncharacterized genes by evolutionary analysis. Genome Res
1998, 8:163-167.
77. Koonin EV:
Orthologs, paralogs, and evolutionary genomics.
Annu Rev Genet 2005, 39:309-338.
78. Zmasek CM, Eddy SR: A simple algorithm to infer gene dupli-
cation and speciation events on a gene tree. Bioinformatics
2001, 17:821-828.
79. Zmasek CM, Eddy SR: RIO: analyzing proteomes by automated
phylogenomics using resampled inference of orthologs. BMC
Bioinformatics 2002, 3:14.
80. Dehal PS, Boore JL: A phylogenomic gene cluster resource: the
Phylogenetically Inferred Groups (PhIGs) database. BMC
Bioinformatics 2006, 7:201.
81. Chiu JC, Lee EK, Egan MG, Sarkar IN, Coruzzi GM, DeSalle R:
OrthologID: automation of genome-scale ortholog identifi-
cation within a parsimony framework. Bioinformatics 2006,
22:699-707.
82. Hulsen T, Huynen MA, de Vlieg J, Groenen PM: Benchmarking
ortholog identification methods using functional genomics
data. Genome Biol 2006, 7:R31.
83. Berglund-Sonnhammer AC, Steffansson P, Betts MJ, Liberles DA:
Optimal gene trees from sequences and species trees using
a soft interpretation of parsimony. J Mol Evol 2006, 63:240-250.
84. Arvestad L, Berglund AC, Lagergren J, Sennblad B: Bayesian gene/
species tree reconciliation and orthology analysis using
MCMC. Bioinformatics 2003, 19(Suppl 1):I7-I15.
85. Rokas A, Williams BL, King N, Carroll SB: Genome-scale
approaches to resolving incongruence in molecular
phylogenies. Nature 2003, 425:798-804.
86. Penny D, Foulds LR, Hendy MD: Testing the theory of evolution
by comparing phylogenetic trees constructed from five dif-
ferent protein sequences. Nature 1982, 297:197-200.
87. Rokas A, Carroll SB: Bushes in the tree of life. PLoS Biol 2006,
R109.16 Genome Biology 2007, Volume 8, Issue 6, Article R109 Huerta-Cepas et al. />Genome Biology 2007, 8:R109
4:e352.
88. Gabaldón T, Huynen MA: Lineage-specific gene loss following
mitochondrial endosymbiosis and its potential for function
prediction in eukaryotes. Bioinformatics 2005, 21(Suppl
2):ii144-ii150.
89. Pruess M, Kersey P, Apweiler R: The Integr8 project - a resource
for genomic and proteomic data. In Silico Biol 2005, 5:179-185.
90. Candida Genome Database []
91. Neurospora crassa at MIT [ />fungi/neurospora]
92. Chlamydomonas genome at JGI [ />chlamy]
93. Smith TF, Waterman MS: Identification of common molecular
subsequences. J Mol Biol 1981, 147:195-197.
94. Edgar RC: MUSCLE: a multiple sequence alignment method
with reduced time and space complexity. BMC Bioinformatics
2004, 5:113.
95. van Noort V, Snel B, Huynen MA: Predicting gene function by
conserved co-expression. Trends Genet 2003, 19:238-242.
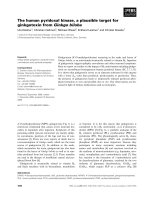
![Báo cáo Y học: The membrane-bound [NiFe]-hydrogenase (Ech) from Methanosarcina barkeri : unusual properties of the iron-sulphur clusters docx](https://media.store123doc.com/images/document/14/rc/ee/medium_eeh1395026426.jpg)