Báo cáo y học: "Departments of Medicine, and Cell and Developmental Biology, Vanderbilt University and" potx
Bạn đang xem bản rút gọn của tài liệu. Xem và tải ngay bản đầy đủ của tài liệu tại đây (1.69 MB, 26 trang )
Genome Biology 2007, 8:R131
comment reviews reports deposited research refereed research interactions information
Open Access
2007Kaiseret al.Volume 8, Issue 7, Article R131
Research
Transcriptional recapitulation and subversion of embryonic colon
development by mouse colon tumor models and human colon
cancer
Sergio Kaiser
¤
*
, Young-Kyu Park
¤
†
, Jeffrey L Franklin
†
, Richard B Halberg
‡
,
Ming Yu
§
, Walter J Jessen
*
, Johannes Freudenberg
*
, Xiaodi Chen
‡
,
Kevin Haigis
¶
, Anil G Jegga
*
, Sue Kong
*
, Bhuvaneswari Sakthivel
*
,
Huan Xu
*
, Timothy Reichling
¥
, Mohammad Azhar
#
, Gregory P Boivin
**
,
Reade B Roberts
§
, Anika C Bissahoyo
§
, Fausto Gonzales
††
, Greg C Bloom
††
,
Steven Eschrich
††
, Scott L Carter
‡‡
, Jeremy E Aronow
*
, John Kleimeyer
*
,
Michael Kleimeyer
*
, Vivek Ramaswamy
*
, Stephen H Settle
†
, Braden Boone
†
,
Shawn Levy
†
, Jonathan M Graff
§§
, Thomas Doetschman
#
, Joanna Groden
¥
,
William F Dove
‡
, David W Threadgill
§
, Timothy J Yeatman
††
,
Robert J Coffey Jr
†
and Bruce J Aronow
*
Addresses:
*
Biomedical Informatics, Cincinnati Children's Hospital Medical Center, Cincinnati, OH 45229, USA.
†
Departments of Medicine,
and Cell and Developmental Biology, Vanderbilt University and Department of Veterans Affairs Medical Center, Nashville, TN 37232, USA.
‡
McArdle Laboratory for Cancer Research, University of Wisconsin, Madison, WI 53706, USA.
§
Department of Genetics and Lineberger Cancer
Center, University of North Carolina, Chapel Hill, NC 27599, USA.
¶
Molecular Pathology Unit and Center for Cancer Research, Massachusetts
General Hospital, Charlestown, MA 02129, USA.
¥
Division of Human Cancer Genetics, The Ohio State University College of Medicine,
Columbus, Ohio 43210-2207, USA.
#
Institute for Collaborative BioResearch, University of Arizona, Tucson, AZ 85721-0036, USA.
**
University
of Cincinnati, Department of Pathology and Laboratory Medicine, Cincinnati, OH 45267, USA.
††
H Lee Moffitt Cancer Center and Research
Institute, Tampa, FL 33612, USA.
‡‡
Children's Hospital Informatics Program at the Harvard-MIT Division of Health Sciences and Technology
(CHIP@HST), Harvard Medical School, Boston, Massachusetts 02115, USA.
§§
University of Texas Southwestern Medical Center at Dallas,
Dallas, TX 75390, USA.
¤ These authors contributed equally to this work.
Correspondence: Bruce J Aronow. Email:
© 2007 Kaiser et al.; licensee BioMed Central Ltd.
This is an open access article distributed under the terms of the Creative Commons Attribution License ( which
permits unrestricted use, distribution, and reproduction in any medium, provided the original work is properly cited.
Colon tumours recapitulate embryonic transcription<p>Colon tumors from four independent mouse models and 100 human colorectal cancers all exhibited striking recapitulation of embry-onic colon gene expression from embryonic days 13.5-18.5.</p>
Abstract
Background: The expression of carcino-embryonic antigen by colorectal cancer is an example of
oncogenic activation of embryonic gene expression. Hypothesizing that oncogenesis-recapitulating-
ontogenesis may represent a broad programmatic commitment, we compared gene expression
patterns of human colorectal cancers (CRCs) and mouse colon tumor models to those of mouse
colon development embryonic days 13.5-18.5.
Published: 5 July 2007
Genome Biology 2007, 8:R131 (doi:10.1186/gb-2007-8-7-r131)
Received: 22 August 2006
Revised: 12 February 2007
Accepted: 5 July 2007
The electronic version of this article is the complete one and can be
found online at />R131.2 Genome Biology 2007, Volume 8, Issue 7, Article R131 Kaiser et al. />Genome Biology 2007, 8:R131
Results: We report here that 39 colon tumors from four independent mouse models and 100
human CRCs encompassing all clinical stages shared a striking recapitulation of embryonic colon
gene expression. Compared to normal adult colon, all mouse and human tumors over-expressed
a large cluster of genes highly enriched for functional association to the control of cell cycle
progression, proliferation, and migration, including those encoding MYC, AKT2, PLK1 and SPARC.
Mouse tumors positive for nuclear β-catenin shifted the shared embryonic pattern to that of early
development. Human and mouse tumors differed from normal embryonic colon by their loss of
expression modules enriched for tumor suppressors (EDNRB, HSPE, KIT and LSP1). Human CRC
adenocarcinomas lost an additional suppressor module (IGFBP4, MAP4K1, PDGFRA, STAB1 and
WNT4). Many human tumor samples also gained expression of a coordinately regulated module
associated with advanced malignancy (ABCC1, FOXO3A, LIF, PIK3R1, PRNP, TNC, TIMP3 and
VEGF).
Conclusion: Cross-species, developmental, and multi-model gene expression patterning
comparisons provide an integrated and versatile framework for definition of transcriptional
programs associated with oncogenesis. This approach also provides a general method for
identifying pattern-specific biomarkers and therapeutic targets. This delineation and categorization
of developmental and non-developmental activator and suppressor gene modules can thus facilitate
the formulation of sophisticated hypotheses to evaluate potential synergistic effects of targeting
within- and between-modules for next-generation combinatorial therapeutics and improved mouse
models.
Background
The colon is composed of a dynamic and self-renewing epi-
thelium that turns over every three to five days. It is generally
accepted that at the base of the crypt, variable numbers
(between 1 and 16) of slowly dividing, stationary, pluripotent
stem cells give rise to more rapidly proliferating, transient
amplifying cells. These cells differentiate chiefly into post-
mitotic columnar colonocytes, mucin-secreting goblet cells,
and enteroendocrine cells as they migrate from the crypt base
to the surface where they are sloughed into the lumen [1]. Sev-
eral signaling pathways, notably Wnt, Tgfβ, Bmp, Hedgehog
and Notch, play pivotal roles in the control of proliferation
and differentiation of the developing and adult colon [2].
Their perturbation, via mutation or epigenetic modification,
occurs in human colorectal cancer (CRC) and the instillation
of these changes via genetic engineering in mice confers a cor-
respondingly high risk for neoplasia in the mouse models.
Moreover, tumor cell de-differentiation correlates with key
tumor features, such as tumor progression rates, invasive-
ness, drug resistance and metastatic potential [3-5].
A variety of scientific and organizational obstacles make it a
challenging proposition to undertake large-scale compari-
sons of human cancer to the wide range of genetically engi-
neered mouse models. To evaluate the potential of this
approach to provide integrated views of the molecular basis of
cancer risk, tumor development and malignant progression,
we have undertaken a comparative analysis of a variety of
individually developed mouse colon tumor models (reviewed
in [6,7]) to human CRC. The Apc
Min/+
(multiple intestinal
neoplasia) mouse model harbors a germline mutation in the
Apc tumor suppressor gene and exhibits multiple tumors in
the small intestine and colon [8]. A major function of APC is
to regulate the canonical WNT signaling pathway as part of a
β-catenin degradation complex. Loss of APC results in a fail-
ure to degrade β-catenin, which instead enters the nucleus to
act as a transcriptional co-activator with the lymphoid
enhancer factor/T-cell factor (LEF/TCF) family of transcrip-
tion factors [9]. The localization of β-catenin within the
nucleus indicates activated canonical WNT signaling. In addi-
tion to germline APC mutations that occur in persons with
familial adenomatous polyposis coli (FAP) and Apc
Min/+
mice,
loss of functional APC and activation of canonical WNT sign-
aling occurs in more than 80% of human sporadic CRCs [10].
Similar to the Apc
Min/+
model, tumors in the azoxymethane
(AOM) carcinogen model, which occur predominantly in the
colon [11], have signaling alterations marked by activated
canonical WNT signaling.
Two other mouse models that carry different genetic altera-
tions leading to colon tumor formation are based on the
observation that transforming growth factor (TGF)β type II
receptor (TGFBR2) gene mutations are present in up to 30%
of sporadic CRCs and in more than 90% of tumors that occur
in patients with the DNA mismatch repair deficiency associ-
ated with hereditary non-polyposis colon cancer (HNPCC)
[12]. In the mouse, a deficiency of TGFβ1 combined with an
absence of T-cells (Tgfb1
-/-
; Rag2
-/-
) results in a high occur-
rence of colon cancer [13]. These mice develop adenomas by
two months of age, and adenocarcinomas, often mucinous, by
three to six months of age. Immunohistochemical analyses of
these tumors are negative for nuclear β-catenin, suggesting
that TGFβ1 does not suppress tumors via a canonical WNT
signaling-dependent pathway. The SMAD family proteins are
Genome Biology 2007, Volume 8, Issue 7, Article R131 Kaiser et al. R131.3
comment reviews reports refereed researchdeposited research interactions information
Genome Biology 2007, 8:R131
critical downstream transcription regulators activated by
TGFβ signaling, in part through the TGFβ type II receptor.
Smad3
-/-
mice also develop intestinal lesions that include
colon adenomas and adenocarcinomas by six months of age
[14].
To identify transcriptional programs that are significantly
activated or repressed in different colon tumor models, we
compared gene expression profiles of 100 human CRCs and
39 colonic tumors from the four models of colon cancer to
mouse embryonic and mouse and human adult colon. The
results of these analyses demonstrate that tumors from the
mouse models extensively adopt embryonic gene expression
patterns, irrespective of the initiating mutation. Although two
of the mouse tumor subtypes were distinguishable by their
relative shifts towards early or later stages of embryonic gene
expression (driven principally by localization of β-catenin to
the nucleus versus the plasma membrane), Myc was over-
expressed in tumors from all four tumor models. Further, by
mapping mouse genes to their corresponding human
orthologs, we further show that human CRCs share in the
broad over-expression of genes characteristic of colon embry-
ogenesis and the up-regulation of MYC, consistent with a fun-
damental relationship between embryogenesis and
tumorigenesis. Large scale similarities could also be found at
the level of developmental genes that were not activated in
either mouse or human tumors. In addition, there were tran-
scriptional modules consistently activated and repressed in
human CRCs that were not found in the mouse models. Taken
together, this cross-species, cross-models analytical
approach - filtered through the lens of embryonic colon devel-
opment - provides an integrated view of gene expression pat-
terning that implicates the adoption of a broad program
encompassing embryonic activation, developmental arrest,
and failed differentiation as a fundamental feature of the biol-
ogy of human CRC.
Results
Strategy for cross-species analysis
Our strategy for the characterization of mouse models of
human CRC (Figure 1) relies on gene expression differences
and relative patterning across a range of mouse CRC models,
normal mouse colon developmental stages, and human CRCs.
Achieving this comparison was facilitated by the use of refer-
ence RNAs from whole-mouse and normal adult colon refer-
ence RNAs for both mouse and human measurements. Mouse
tumor samples were profiled on cDNA microarrays using the
embryonic day (E)17.5 whole mouse reference RNA identical
to that used previously [15] to examine embryonic mouse
colon gene expression dynamics from E13.5 to E18.5, during
which time the primitive, undifferentiated, pseudo-stratified
colonic endoderm becomes a differentiated, single-layered
epithelium. This strategy allowed us to construct a gene
expression database of mouse colon tumors in which gene
expression levels of the tumors could be referenced, ranked,
and statistically compared to an average value among the
tumors or to embryonic or adult colon gene expression levels
on a per-gene basis. First, we compared the four models with
each other, then to mouse colon development, and finally to
human CRCs using gene ortholog mapping (Figure 1).
Mouse colon tumors partition into classes reflecting
differential canonical WNT signaling activity
To discover gene expression programs underlying differences
between etiologically distinct mouse models of CRC, gene
expression level values for each transcript in each tumor sam-
ple was set to its ratio relative to its median across the series
of tumor models. Using non-parametric statistical analyses,
1,798 cDNA transcripts were identified as differentially
expressed among the four mouse models of CRC. Five major
gene patterns were identified using K-means clustering (clus-
ters C1-C5; Figure 2a, top). Genes belonging to these clusters
were strongly associated with annotated gene function cate-
gories (see Table 1 for detailed biological descriptions and
associations). For example, cluster C1, composed of tran-
scripts that exhibited lower expression in Smad3
-/-
tumors
and higher expression in AOM, Apc
Min/+
and Tgfb1
-/-
; Rag2
-/
-
tumors, contains 391 transcripts, including Cdk4, Ctnnb1,
Myc, Ezh2, Mcm2 and Tcf3. Gene list over-representation
analysis using Ingenuity Pathway Analysis applications dem-
onstrated highly significant associations to cell cycle progres-
sion, replication, post-transcriptional control and cancer.
Similarly, cluster C2, composed of 663 transcripts that exhib-
ited high expression in AOM and Apc
Min/+
tumors, but low in
Smad3
-/-
and Tgfb1
-/-
; Rag2
-/-
tumors, included transcripts
for contact growth inhibition (Metap1, Pcyox1), mitosis (Mif,
Pik1), cell cycle progression and checkpoint control (Id2,
Ptp4A2, Tp53).
From the 1,798 transcripts differentially expressed among the
four mouse models of CRC, more than 70% (n = 1265) distin-
guished Apc
Min/+
and AOM tumors versus Smad3
-/-
and
Tgfb1
-/-
; Rag2
-/-
tumors (Figure 2a, bottom). If a random or
equivalent degree of variance occurred among all classes,
there would be far less overlap. The majority of this signature
(approximately 75%, n = 904 features) derived from genes
over-expressed in Apc
Min/+
and AOM tumors relative to the
Smad3
-/-
and Tgfb1
-/-
; Rag2
-/-
tumors (cluster C6). Cluster C6
was functionally enriched for genes linked to canonical WNT
signaling (Table 1). These included genes previously identi-
fied to be part of this pathway (Cd44, Myc, Stra6, Tcf1, Tcf4
[16], Id2, Lef1, Nkd1, Nlk, Twist1 [17], Catnb, Csnk1a1,
Csnk1d, Csnk1e, Plat, Wif1) as well as genes that appear to be
novel canonical WNT signaling targets (for example, Cryl1,
Expi, Ifitm3l, Pacsin2, Sox4 [16], Ets2, Hnrnpg, Hnrpa1, Id3,
Kpnb3, Pais, Pcna, Ranbp11, Rbbp4, Yes [18], Hdac2 [19]).
Moreover, consistent with the over-expression of Myc in
tumors from the Apc
Min/+
and AOM models, we detected
enrichment of Myc targets, such as Apex, Eef1d, Eif2a, Eif4e,
Hsp90, Mif, Mitf, Npm1 [20], and the repression of Nibam
[20].
R131.4 Genome Biology 2007, Volume 8, Issue 7, Article R131 Kaiser et al. />Genome Biology 2007, 8:R131
Nuclear β-catenin expression distinguishes murine
models
To establish a molecular basis for over-expression of canoni-
cal WNT target genes in Apc
Min/+
and AOM tumors, we used
immunohistochemistry to characterize the relative cellular
distribution of β-catenin. Tumors from Apc
Min/+
(Figure 2b,
bottom left panel) and AOM (not shown) mice exhibited
strong nuclear β-catenin immunoreactivity and reduced mem-
brane staining (see inset), whereas tumors from Smad3
-/-
(Figure 2b, bottom right panel) and Tgfb1
-/-
; Rag2
-/-
(not
shown) mice showed strong plasma membrane β-catenin
staining with no nuclear accumulation (see inset). Additional
tests to confirm the microarray results were also carried out
using an independent set of C57BL/6 Apc
Min/+
colon tumor
samples analyzed by quantitative real-time PCR (qRT-PCR;
Figure 3a) and immunohistochemistry (Figure 3b). All
expression patterns identified via microarray analysis were
consistent with the qRT-PCR results (n = 9 transcripts, cho-
sen for their demonstration of a range of differential expres-
sion characteristics). In situ hybridization analyses using
C57BL/6 Apc
Min/+
colon tumor samples also validated that
Wif, Tesc, Spock2 and Casp6 were strongly expressed in dys-
plastic cells of the tumors (data not shown). At the protein
level, immunohistochemical analyses confirmed relatively
greater expression of the oncoprotein stathmin 1 in Apc
Min/+
mice and tyrosine phosphatase 4a2 in Smad3
-/-
mice (Figure
3b).
Overall, cluster C6 genes (that is, genes with greater up-regu-
lation in tumors from Apc
Min/+
and AOM models than in
Smad3
-/-
and Tgfb1
-/-
; Rag2
-/-
) were consistent with
increased tumor cell proliferation (for example, Myc, Pcna),
cytokinesis (for example, Amot, Cxcl5), chromatin remode-
ling (for example, Ets2, Hdac2, Set) as well as cell cycle pro-
gression and mitosis (for example, Cdk1, Cdk4, Cul1, Plk1). It
is important to note that Myc is up-regulated in all four
mouse tumor models relative to normal colon tissue (see
below). Biological processes showing increased transcription
in tumors from the Smad3
-/-
and Tgfb1
-/-
; Rag2
-/-
models
(cluster C7) included immune and defense responses (for
example, Il18, Irf1, Myd88), endocytosis (for example, Lrp1,
Ldlr, Rac1), transport (for example, Abca3, Slc22a5,
Slc30a4), and oxidoreductase activity (for example, Gcdh,
Prdx6, Xdh) (Table 1). Taken together, these transcriptional
observations are both consistent with and extend our under-
standing of the histological features of the CRC models [7].
For example, while Apc
Min/+
and AOM tumors are character-
ized by cytologic atypia (that is, nuclear crowding, hyperchro-
masia, increased nucleus-to-cytoplasm ratios and minimal
inflammation), tumors from Smad3
-/-
and Tgfb1
-/-
; Rag2
-/-
mice show less overt dysplastic changes but exhibit a signifi-
cant inflammatory component.
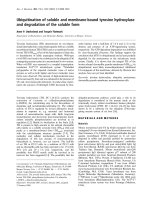
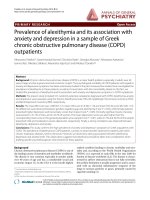
Stratification of murine colon tumor models by localization of β-catenin and plan for analysisFigure 1
Stratification of murine colon tumor models by localization of β-catenin and plan for analysis. Colon tumors from four etiologically distinct mouse models
of CRC were subjected to microarray gene expression profiling. The gene expression profiles from the different mouse model tumors were compared
and contrasted to each other, as well as to those from embryonic mouse colon development and 100 human CRCs.
Identification of differentially regulated genes
Compare tumor
models to:
Embryonic colon
development
Human colon cancer
Each other
β -catenin
AOMApc
Min /+
Smad3
-/-
Tgfb1
-/-
;
Rag2
-/-
Nuclear
Plasma
membrane
Genome Biology 2007, Volume 8, Issue 7, Article R131 Kaiser et al. R131.5
comment reviews reports refereed researchdeposited research interactions information
Genome Biology 2007, 8:R131
Table 1
Detailed cluster analysis: differential and statistically significant biological functions in clusters C1-C7
Cluster no. Number of
transcripts/
ProbeSets (PS)
Reference Pattern Biology Example genes
1 391 Global Up (A/M/T);
down (S)
RNA post-transcriptional modification, cell
cycle, DNA replication/recombination/
repair, molecular transport, post-
translational modification, cellular assembly
and organization, cellular movement,
cardiovascular system development and
function, connective tissue development
and function, cancer
Cell cycle progression (Cdk4, Ctnnb1, Id1,
Id3, Myc, Pcna, Tcf3), replication of DNA
(Idi1, Mcm2, Myc, Orc4l, Pcna, Polb, Set),
checkpoint control (Bub3, Myc, Rae1,
Smc1l1), invasion of mammary epithelial
cells (Ezh2), recovery of ATP (Hspd1,
Hspe1), hyperplasia of secretory structure
(Cdk4, Ctnnb1, Ptpre, Sdc1), cell
proliferation (Id1, Id3, Myc, Pcna)
2 663 Global Up (A/M);
down (S/T)
Cell cycle, cellular response to
therapeutics, cellular assembly and
organization, molecular transport,
connective tissue development and
function, genetic disorder, gastrointestinal
disease, cancer, Wnt-signaling pathway
Contact growth inhibition of connective
tissue cells (Metap2, Pcyox1), mitosis of
tumor cells (Mif, Plk1), cell cycle
progression (Id2, Tp53), checkpoint control
(Mad2l1, Tp53), DNA modification (Apex1,
Dnmt3a, Dnmt3b), infiltrating duct
carcinoma (Esr1, Ing4), mitosis of tumor
cells (Mif, Plk1), myotonic dystrophy
(Dmpk, Znf9), Wnt-signaling (Csnk1d,
Csnk1e, Lef1, Nlk, Tcf3, Tcf4, Wif1)
3 170 Global Up (A/S);
down (M/T)
Cancer, cell death, cellular development,
cellular growth and proliferation, cell cycle
Apoptosis of colon carcinoma cells
(Tnfsf10), sarcoma (Ewsr1, Mdm2, Tnfsf10),
hyperpoliferation (Map2k7), survival
(Mdm2, Nras, Tnfsf10), tumorigenesis
(Ewsr1, Mdm2, Nras, Tnfsf10), fibroblast
proliferation (Arid5b, E4f1, Map2k7, Mdm2,
Nras), mitosis of embryonic cells (E4f1)
4 142 Global Up (M/S);
down (A/T)
Cellular movement, hematological system
development and function, immune
response, hematological disease, immune
and lymphatic system development and
function, organ morphology, cell-to-cell
signaling and interaction, cell death,
molecular transport
Cell movement/chemotaxis (Alox5AP, C3,
Ctsb, Cxcl12, Dcn, Fcgr3a, Fgfr1, Hif1a,
Igf2, Itgb2, Lsp1, S100A9, Slp1), invasion of
tumor cell lines (Cbx5, Ctsb, Cxcl12, Fstl1,
Hif1a, Ighg1, Igf2, Itgb2), chemotaxis/
migration of leukocytes (C3, Cxcl12, Icam2,
Itgb2, Lgals1, Lsp1, S100a9, Slpi), growth of
tumor (Fgfr1, Hif1a, Igf2, Igfbp5, Ighg1),
invasion of tumor cell lines (Cbx5, Ctsb,
Cxcl12, Fstl1, Hif1a, Igf2, Ighg1, Itgb2)
5 432 Global Up (S/T);
down (A/M)
Cell death, neurological disease, drug
metabolism, endocrine system
development and function, cancer, drug
metabolism, lipid metabolism,
gastrointestinal disease, organismal
functions, organismal injury and
abnormalities
Gut epithelium differentiation (Chgb, Klf4,
Klf6, Sst), cell death/apoptosis of microglia
(Btg1, Casp3, Casp9, Cx3cl1, Grin1,
Myd88), uptake of prostaglandin E2
(Slco2a1), tumorigenesis of brain tumor
(Nf2, Stat2), tumorigenesis of polyp (Asph,
Smad4), aggregatability of colon cancer cell
lines (Cd82), cell spreading of colon cancer
cell lines (Smad4), contact inhibition of
colon cancer cell lines (Prkg1)
6 904 Global Up (A/M);
down (S/T)
Cell proliferation, cell cycle progression and
mitosis, DNA replication/recombination/
repair, molecular transport, RNA post-
transcriptional modification, post-
translational modification, cellular growth
and proliferation, connective tissue
development and function, cancer,
gastrointestinal disease, digestive system
development and function
Cell cycle progression/proliferation (Cdk4,
Clu, Id2, Mki67, Magoh, Myc, Pcna, Tcf3,
Tp53), tumor cell mitosis (Mif, Plk1), DNA
excision repair (Apex1, Ddb1, Hmgb1,
Polb), DNA methylation (Dnmt3a,
Dnmt3b), accumulation of colonocytes
(Clu, Myc), tumorigenesis (Cd44, Cdk4,
Ctnnb1, Esr1, Myc, Prkar1a, Tp53), Wnt-
signaling pathway (Csnk1a1, Cskn1d,
Cskn1e, Ctnnb1, Lef1, Myc, Nlk, Ppp2cb,
Tcf3, Tcf4, Wif1)
R131.6 Genome Biology 2007, Volume 8, Issue 7, Article R131 Kaiser et al. />Genome Biology 2007, 8:R131
Large-scale activation of the embryonic colon
transcriptome in mouse tumor models
We hypothesized that comparisons of genes over-expressed
in both colon tumors and embryonic mouse colon could
provide valuable insights into tumor programs important for
fundamental aspects of tumor growth and regulation of dif-
ferentiation. To identify genes and observe regulatory pat-
terns that were shared or differed between colon tumors and
embryonic development, we applied a global quantitative ref-
erencing strategy to both tumor and embryonic samples by
calculating the relative expression of each gene as the ratio of
its expression in any sample as that relative to its mean level
in adult colon. From this adult baseline reference, genes over-
expressed in the four mouse tumor models appeared strik-
ingly similar. Moreover, the vast majority of genes over-
expressed in tumors were also over-expressed in embryonic
colon (Figure 4a). If the fraction of fetal over-expressed genes
from the entire microarray (5,796 of 20,393 features; 28.4%)
was maintained at a similar occurrence frequency in the
tumor over-expressed fraction (8,804 of 20,393), one would
expect an overlap of 2,502 transcripts ((8,804/20,393) ×
28.4%). Rather, 4,693 out of the 5,796 fetal over-expressed
transcripts were observed to be over-expressed in the 8,804
tumor over-expressed genes (Figure 4b). The probability cal-
culated by Fisher's exact test is p < 1
-300
, and thus represents
highly significant over-representation of fetal genes among
the tumor over-expressed genes. Similarly, genes under-
expressed in developing colon were disproportionately
underexpressed in tumors relative to normal adult colon
(3,282 of 3,541; p < 1
-300
). Combining these results, approxi-
mately 85% of the developmentally regulated transcripts
(7,975 out of 9,337 features) were recapitulated in tumor
expression patterns relative to adult colon (Figure 4a,b, green
and red markers represent the corresponding 7,975 features).
To explore the potential biological significance of genes over-
expressed in both embryonic colon development and mouse
tumors, we used K-means clustering to generate C8-C10 clus-
ter patterns as shown in a hierarchical tree heatmap (Figure
4c; Table 2). Several sub-patterns were evident, some of
which clearly separated Apc
Min/+
and AOM from Smad3
-/-
and
Tgfb1
-/-
; Rag2
-/-
tumors. One strong cluster, cluster C8, con-
sisted of genes more strongly expressed in Apc
Min/+
and AOM
than Smad3
-/-
and Tgfb1
-/-
; Rag2
-/-
tumors. This group of
genes represented a large fraction of all differences found
between nuclear β-catenin-positive (Apc
Min/+
and AOM) and
negative (Smad3
-/-
and Tgfb1
-/-
; Rag2
-/-
) tumors (approxi-
mately 45%; 1,636 out of 3,592 features), as well as differ-
ences detected between early (that is, E13.5-E15.5, ED) and
late (E.16.5-E18.5, LD) embryonic colon developmental
7 361 Global Up (S/T);
down (A/M)
Cell death, neurological disease, cancer,
drug metabolism, embryonic development,
endocrine system development and
function, lipid metabolism, organismal injury
and abnormalities, infectious disease,
immune response, immunological disease,
hematological disease; gastrointestinal
disease; antigen +presentation pathway
Antigen presentation (B2m, Cd74, H2-D1,
HLA-DMA, HLA-DRB, Psmb8, Tap2),
embryonic development (C3, Celsr1,
Erbb3, Impk, Mcl1), infectious disease (B2m,
Ifngr1, Irf1, Myd88, Nr3c1), mast cell
chemotaxis (C3, Cx3cl1), apoptosis of
microglia (Btg1, Casp3, Cx3cl1, Myd88),
tumorigenesis of polyp (Asph, Smad4),
transport of prostaglandin E2 (Slco2a1),
quantity of colonocytes (Guca2a),
gastrointestinal disease (Asph, Cd84,
Smad4)
A, AOM-induced; M, Apc
Min/+
; S, Smad3
-/-
; T, Tgfb1
-/-
; Rag2
-/-
.
Table 1 (Continued)
Detailed cluster analysis: differential and statistically significant biological functions in clusters C1-C7
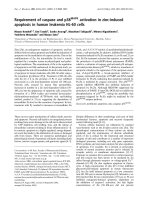
Active canonical WNT signaling (as determined by nuclear β-catenin) stratifies the four murine colon tumor models into two groupsFigure 2 (see following page)
Active canonical WNT signaling (as determined by nuclear β-catenin) stratifies the four murine colon tumor models into two groups. (a) Hierarchical
clustering of gene transcripts separates the four models into two groups. The upper panel shows 1,798 gene transcripts identified as differentially
expressed among any of the four mouse tumor models (Kruskal-Wallis test + Student-Newman-Keuls test + FDR < 5.10
-5
). Results demonstrate that
AOM (A) and Apc
Min/+
(M) tumors are transcriptionally more similar to each other than to tumors from Smad3
-/-
(S) and Tgfb1
-/-
; Rag2
-/-
(T) mice. Five
clusters have been identified (C1-C5) that correspond to the K-means functional clusters listed in Table 1. Please refer to Table 1 for an in-depth
description of the functional classification of the genes found in these clusters. The lower panel illustrates the extent of the similarity between A/M and S/
T tumors by identifying the top-ranked 1,265 transcripts of the 1,798 that were higher or lower in the two tumor super-groups (rank based on Wilcoxon-
Mann-Whitney test for between-group differences with a FDR < 5.10
-5
cutoff). Up-regulated transcripts in A/M tumors are highly enriched for genes
associated with canonical WNT signaling activity, cell proliferation, chromatin remodeling, cell cycle progression and mitosis; transcripts over-expressed in
S/T tumors are highly enriched for genes related to immune and defense responses, endocytosis, transport, oxidoreductase activity, signal transduction
and metabolism. (b) Representative histologies for each of the four tumor models. The lower panel illustrates the model-dependent localization of β-
catenin. Tumors from M (bottom left) and A (not shown) mice exhibited prominent nuclear β-catenin accumulation and reduced cell surface staining.
Conversely, tumors from S (bottom right) and T(not shown) mice exhibited retention of plasma membrane β-catenin immunoreactivity. A and M in top
panel 100× magnification; S and T 200× magnification. M and S in lower panel both 400× magnification.
Genome Biology 2007, Volume 8, Issue 7, Article R131 Kaiser et al. R131.7
comment reviews reports refereed researchdeposited research interactions information
Genome Biology 2007, 8:R131
Figure 2 (see legend on previous page)
1,265 features
[ A+M vs. S+T ]
C6C6
C7C7
3.0
0.3
1.0
1,798 features
[ any of (A vs. M vs. S vs. T) ]
C1C1
C3C3
C4C4
C2C2
C5C5
A
( AOM treatment )
M
( Apc
Min/+
)
S ( Smad3
-/-
)
T ( Tgfb1
-/-
; Rag2
-/-
)
A M S T
(a)
(b)
M S
Gene expression relative
to tumor median
R131.8 Genome Biology 2007, Volume 8, Issue 7, Article R131 Kaiser et al. />Genome Biology 2007, 8:R131
stages. Thus, the fraction of developmentally regulated genes
that are more characteristic of the earlier stages of normal
colon development (E13.5-E15.5), are clearly expressed at
higher levels in nuclear β-catenin-positive tumors. This
observation is illustrated by 750 transcripts selected solely for
stronger expression in ED versus LD (Figure 4d). Note that
most of these transcripts overlap with cluster C6 containing
230 features (Figure 2a, lower panel) and illustrate the ten-
dency of the earlier-expressed developmental genes to be
more strongly expressed in Apc
Min/+
and AOM mice. In addi-
tion, transcripts associated with increased differentiation and
maturation, observed at later stages of colon development
E16.5-E18.5 (for example, Klf4 [21], Crohn's disease-related
Slc22a5/Octn2 [22], Slc30a4/Znt4 [23], Sst [24]), were
expressed at higher levels by tumors from Smad3
-/-
and
Tgfb1
-/-
; Rag2
-/-
mice.
Human CRCs reactivate an embryonic gene signature
Since mouse tumors recapitulated developmental signatures
irrespective of their etiology, we asked whether a similar com-
mitment to embryonic gene programming was shared by spo-
radic human CRCs. Tumor classification by microarray
profiling is usually accomplished by referencing relative gene
expression levels to the median value for each gene across a
series of tumor samples. Using this 'between-tumors median
normalization' approach, as well as a gene filtering strategy
that detects significantly regulated genes in at least 10% of the
cases, led to the identification of a set of 3,285 probe sets cor-
responding to transcripts whose expression was highly varied
between independent human tumor cases. As shown in Fig-
ure 5, there was striking heterogeneity of gene expression
among 100 human CRCs. For example, cluster 15 contained a
set of genes (principally metallothionein genes) recently iden-
tified to be predictive of microsatellite instability [25,26].
This analysis indicates that human CRCs have a greater level
of complexity than the mouse colon tumors studied here
(compare Figures 2 and 5). There was no correlation between
these distinguishing clusters and the stage of the tumor (note
the broad overlapping distributions of Dukes stages A-D
across these different clusters). However, as shown in Table
3, gene ontology and network analysis of the individual gene
clusters (clusters C11-C17) that were differentially active in
subgroups of the tumors, map to genes highly associated with
a diverse set of biological functions, including lipid metabo-
lism, digestive tract development and function, immune
response and cancer
To evaluate if similar sets of genes are systematically acti-
vated or repressed in human CRC, as in the mouse colon
tumors, we undertook two procedures to align the data. First,
gene expression values for the mouse and human tumors
were separately normalized and referenced relative to their
respective normal adult colon controls; second, mouse and
human gene identifiers were reduced to a single ortholog
gene identifier. The latter is a somewhat complex procedure
that requires identifying microarray probes from each plat-
form that can be mapped to a single gene ortholog and
undertaking a procedure to aggregate redundant probes
within a platform (see Materials and methods). This
approach allowed the identification of 8,621 gene transcripts
on the HG-U133 plus2 and Vanderbilt NIA 20 K cDNA arrays
for which relative expression values could be mapped for
nearly all mouse and human samples. A clustering-based
assessment of expression across the whole mouse-human
ortholog gene set identified a large number of transcripts
behaving similarly across colon tumors, many irrespective,
but some respective of species. Notably, the great majority of
genes over-expressed in all tumors were also over-expressed
during colon development (Figure 6a). To evaluate the statis-
tical significance of this pattern, we used a Venn overlap fil-
tering strategy and Fisher's exact test analysis. Approximately
50% of the 2,212 ortholog genes over-expressed in at least
10% of the human cancers relative to adult colon were also
over-expressed in developing colon. If there was not a selec-
tion for developmental genes among those over-expressed in
tumors, the expected overlap would be (2,718/8,621) × 2,212
= 697 transcripts. Using Fisher's exact test for the significance
of the increased overlap of 1,080 versus 697 transcripts is p <
1e-300. Similarly, genes under-expressed in mouse colon
development and human CRCs also strongly overlapped (Fig-
ure 6b; 431 of 737, p < 1e-76). This result is significantly
greater than the 8-19% of genes that were estimated to be
over-expressed in human colon tumors and fetal gut morpho-
genesis based upon a computational extrapolation of SAGE
data [27]. Thus, our findings not only confirm but also signif-
icantly expand and experimentally validate the previously
suggested recapitulation of embryonic signatures by human
CRCs.
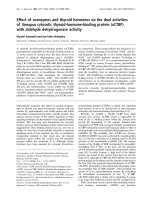
Selective validation of microarray results by qRT-PCR and immunohistochemistryFigure 3 (see following page)
Selective validation of microarray results by qRT-PCR and immunohistochemistry. Differential expression of transcripts identified by the microarray
analyses was examined using (a) qRT-PCR and (b) immunohistochemistry. Additional colon tumors from five Apc
Min/+
(M; nuclear β-catenin-positive) mice
and four Smad3
-/-
(S; nuclear β-catenin-negative) mice were harvested, and qRT-PCR was performed on nine genes that exhibited representative strong or
subtle patterns in the microarray analyses. All nine patterns detected in the microarray set were validated by the qRT-PCR results. Alox12, Arachidonate
12-lipoxygenase; Casp6, Caspase 6; Matn2, Matrilin 2; Ptplb, Protein tyrosine phosphatase-like B; Sox21, SRY (sex determining region Y)-box 21; Spock2,
Sparc/osteonectin, CWCV, and Kazal-like domains proteoglycan (testican) 2; Tesc, Tescalcin; Tpm2, Tropomysin 2; Wif1, WNT inhibitory factor; Stmn1,
stathmin 1; Ptp4a2, phosphatase 4a2. In (a), *p < 0.05 and **p < 0.01.
Genome Biology 2007, Volume 8, Issue 7, Article R131 Kaiser et al. R131.9
comment reviews reports refereed researchdeposited research interactions information
Genome Biology 2007, 8:R131
Figure 3 (see legend on previous page)
Stmn1
Ptp4a2
0
0
1
10
100
1000
ApcMin/+
Smad3-/-
1000
100
10
1
-10
-100
0
0
1
10
100
1000
ApcMin/+
Smad3-/-
0
0
1
10
100
1000
ApcMin/+
Smad3-/-
0
0
1
10
100
1000
ApcMin/+
Smad3-/-
1,000
100
10
1
-10
-100
Apc
Min
/+
Smad3
-/-
Alox12
Casp6
Matn2 Sox21 Tesc
Ptplb Spock2
Wif1
Tpm2
*
*
*
**
**
M S
M S
qRT-PCR transcript level relative to
normal adult colon
(a)
(b)
R131.10 Genome Biology 2007, Volume 8, Issue 7, Article R131 Kaiser et al. />Genome Biology 2007, 8:R131
Figure 4 (see legend on next page)
3.0
0.3
1.0
3.0
0.3
1.0
Ob s e r ve d Exp e cte d Ob se r v e d E xp e cte d
Total feature count
2,0393 5 ,7 9 6 n a 3 ,5 4 1 n /a
Over-expressed
8,804 4 ,6 9 3 * 2 ,5 0 2 5 8 8 *** 1 ,5 2 9
Under-expressed
8,018 2,0 0 4 ** 2 ,2 7 8 3 ,2 8 2 **** 1 ,3 9 2
Embryonic Colon
Murine tumor
models
Ov e r-e x p r e sse d
Under-expressed
(a)
(c)
C8C8
C9C9
C10C10
(b)
Gene expression relative
to adult colon
*
*
(d)
ED (E13.5-E15.5)
LD (E16.5-E18.5)
A
M
A
M
S
T
S
T
Gene expression
relative to adult colon
nAC
4.0
0.3
1.0
4.0
0.3
1.0
20,393 features4,693 features750 features
Genome Biology 2007, Volume 8, Issue 7, Article R131 Kaiser et al. R131.11
comment reviews reports refereed researchdeposited research interactions information
Genome Biology 2007, 8:R131
All overlaps between tumor expression and development
were pooled to form a set of 2,116 ortholog gene transcripts.
This was subjected to hierarchical tree and K-means cluster-
ing to define six expression clusters, C18-C23 (Figure 6c;
Table 4). These clusters provide an impressive partitioning of
groups of genes associated with different biological functions
critical for colon development, maturation and oncogenesis.
Cluster C22 (860 transcripts of genes strongly expressed both
developmentally and across all tumors) is highly enriched
with genes associated with cell cycle progression, replication,
cancer, tumor morphology and cellular movement. Cluster
C18 (258 transcripts down-regulated in mouse and human
tumors, as well as in development) is highly enriched in genes
associated with digestive tract function, biochemical and lipid
metabolism. This cluster is clearly composed of genes associ-
ated with the mature GI tract. Thus, as opposed to recapitu-
lating developmental gene activation, the cluster C18 pattern
indicates a corresponding arrest of differentiation in both
mouse and human tumors. Cluster C23 (142 transcripts over-
expressed in all mouse models and human CRC, but with low
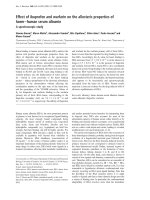
All four murine tumor models exhibit reactivation of embryonic gene expressionFigure 4 (see previous page)
All four murine tumor models exhibit reactivation of embryonic gene expression. The expression level of each gene in each sample was calculated relative
to that in adult colon. Genes and samples were subjected to unsupervised hierarchical tree clustering for similarities among genes and tumors. (a)
Heatmap shows the relative behaviors of 20,393 transcripts that passed basic signal quality filters with gene transcripts shown as separate rows and
samples as separate columns. Note that the majority of genes over-expressed in tumors (red) are also over-expressed in embryonic colon; similarly, the
genes under-expressed in tumors (blue) are under-expressed in embryonic colon. The color bars to the right indicate the position of 4,693 transcripts
over-expressed in both tumors and development (red) or under-expressed in both (green). In addition, there are genes over-expressed in embryonic
colon that are under-expressed in tumors and vice versa (asterisks). (b) The genes represented in (a) were divided into those over-expressed and under-
expressed in embryonic colon and in the tumors, respectively. Fisher's exact test was used to calculate expected overlaps between lists and confirmed
significant over-representation of development-regulated signatures among the tumors (*p < 1
-300
, **p < 1.3
-19
, ***p < 4
-296
, ****p < 1
-300
). (c) Heatmap
showing the behavior of a subset of the transcripts in (a) (n = 4,693 features) that were over-expressed in both embryonic colon and tumor samples. Refer
to Table 2 for a complete description of the genes associated with these clusters. (d) Embryonic gene expression can be further refined into genes
expressed differentially during early (ED; E13.5-15.5) and late (LD; E16.5-18.5) embryonic development. Heatmap showing the relative behaviors of 750
transcripts that are highest-ranked for early versus late embryonic regulation. Overall, transcripts with the highest early embryonic expression were
expressed at higher levels in nuclear β-catenin-positive tumors (A and M), whereas nuclear β-catenin-negative tumors (S and T) were representative of
later stages of embryonic development. Sample groups: ED, early development (E13.5-E15.5); LD, late development (E16.5-E18.5); A, AOM-induced; M,
Apc
Min/+
; T, Tgfb1
-/-
; Rag2
-/-
; S, Smad3
-/-
. Staging: nAC, normal colon. Clusters C8-C10 to the right of the heatmap correspond to the K-means functional
clusters listed in Table 2.
Table 2
Detailed cluster analysis: differential and statistically significant biological functions in clusters C8-C10
Cluster no. Number of PS Reference Biology Example genes
8 1,240 Adult RNA post-transcriptional modification, cell cycle,
cellular assembly and organization, DNA
replication/recombination/repair, cancer, molecular
transport, protein traffic and synthesis, cellular
development, gastrointestinal disease, IGF-1
signaling, Wnt-signaling
Mitosis (Ask, Birc5, Bcra1, Cdc2, Cdk4, Chek1,
Mad2l1, Mif, Plk1), DNA mismatch repair (Hgmb1,
Msh2, Pcna, Rev1l, Xrcc5), cell transformation
(Cdc37, Id2, Myc), cell proliferation (Ctnnb1, Pcna,
Plat, Plk1, Rala, Top2a), colorectal cancer (Birc5,
Brca1, Cdc37, Myc, Top53), IGF-1 signaling (Igf1,
Igfb4, Mapk1, Prkc, Ptpn11), Wnt signaling
(Csnk1a1, Csnk2a1, Ctnnb1, Gs3kb, Myc, Nlk,
Tcf3, Tcf4)
9 1,676 Adult Protein synthesis, RNA-post transcriptional
modification, cancer, connective tissue
development and function, embryonic
development, organ morphology, tissue
morphology, cell-to-cell signaling and interaction,
tissue development
Protein synthesis (Csf1, Eif5, Gadd45g, Itgb1, Sars,
Tnf, Traf6), transformation (Ccnd1), formation of
hepatoma cell line (Hras, Pin1, Shfm1), cell growth
(Nrp1, Tnf), invasion of lymphoma cell line (Itgb1,
Itgb2), proliferation of ovarian cancer cell lines (Fst,
Hras, Itgfb5, Sod2, Sparc), fibroblast cell cycle
progression (Ccnf, E2f5, Hras, Map4, Rhoa, Skil),
survival of epiblast (Dag1, Itgb1), cell adhesion
(Icam1, Itgb1, Itgb2, Lu, Rhoa, Tnf)
10 1,051 Adult Cell cycle, cellular assembly and organization, DNA
replication, recombination/repair, cellular function
and maintenance, cancer, cardiovascular system
development and function, gene expression,
immunological disease, digestive system
development and function, activin/inhibin signaling
Cell cycle (Cdk2, Ccnd3, Siah), exocytosis (Nos3,
Snap23, Stx6, Vamp2), Burkitt's lymphoma (Dmtf1),
cell transformation (Mmp2, Pecam1), angiogenesis
(Mdk, Nos3), activation of RNA (Hrsp12,
Rps6kb1), development of gastrointestinal tract
(Pdgfra, Sptbn1), activin/inhibin signaling (Acvr2b,
Bmpr1b, Inha, Map3k7, Mapk8, Tgfbr1)
PS, ProbeSets.
R131.12 Genome Biology 2007, Volume 8, Issue 7, Article R131 Kaiser et al. />Genome Biology 2007, 8:R131
Table 3
Detailed cluster analysis: differential and statistically significant biological functions in clusters C11-C17
Cluster no. Number of PS Reference Biology Example genes
11 167 Global Molecular transport, protein traffic, lipid
metabolism, small molecule biochemistry,
cardiovascular system development, dermatological
diseases and conditions, organismal development,
organismal injury and abnormalities, cancer,
digestive system development and function
Protein excretion (BF, EDNRA, KL),
corticosteroid/daunorubicin transport (ABCB1),
modification of cholesterol (ABCB1, SULT2B1),
neovasculariation of animal (TNFRSF6B, TNFSF11),
angiogenesis of granulation tissue (PTGES), blister
formation (COL17A1, FRAS1), development of
enteroendocrine cells (NEUROD1), crypt size
(FOLR1), connective tissue formation (EDNRA,
IL7, MSX2, PTGES, WT1), division of mesenchymal
cells (BMP7)
12 762 Global RNA post-translational modification, gene
expression, cancer, renal and urological disease,
RNA traffic embryonic development, cell-to-cell
signaling and interaction, estrogen receptor
signaling, EGF signaling, PI3K/AKT signaling
Processing of RNA (HNRPA2B1, HNRPD,
HNRPH1, PRPF4B, RBM6, RBPMS, SFPQ, SFRS3,
SFRS4, SNRPA1, U2AF1, ZNF638), transactivation
of glucocorticoid/thyroid hormone response
element (FOXO1A, NCOR1, NR3C1, RORA),
tumorigenesis (CD44, CTNNB1, EGFR, NF1,
PRKAR1A, PTEN, THBS1), adhesion of tumor cells
(CD44, CD47, EGFR, PTK2, THBS1), juvenile/
colonic polyposis (CTNBB1, PTEN, SMAD4),
IGF1-signalling (CTNBB1, FOXOA1, PTEN, SOS2)
13 213 Global Cell morphology, cellular development,
hematological disease, genetic disorder, embryonic
development, cellular assembly and organization,
hair and skin development and function,
cardiovascular system development and function,
cancer, digestive system development and function
Conversion of epithelial cells (ATOH1, DMBT1,
FOS), depolarization of cells (CACNA1C, FOS,
NTS), development of Goblet/Paneth/
enteroendocrine cells (ATOH1), hematological
disease (HBA1, HBA2, HBB, GIF), partington
syndrome (ARX), muchopolysaccharidosis
(HYAL1), Pfeiffer's syndrome (FGFR2), retinoic
acid synthesis (ALDH1A1, ALDH1A2), adenoma
inflammation (TFF1), density of connective tissue
(MIA, TNFRSF11B)
14 161 Global Cancer, cellular movement, skeletal and muscular
disorders, immune response, gastrointestinal
disease lipid metabolism, reproductive system
disease, small molecule biochemistry, digestive
system development and function, tissue
development
Migration/invasion of tumor cell lines (CDKN2A,
CST6, DPP4, KITLG, LAMA3, LCK, MDK,
SERPINB5, TFF2, TGFA), tumorigenesis of
intestinal polyp (ASPH), proliferation of tumor cell
lines (APRIN, CDKN2A, CST6, IMP3, LITLG,
PIWIL1, SLP1, TGFA), cytotoxic reaction
(CDKN2A, LCK), invasion of tumor cell lines
(CDKN2A, CST6, DPP4, SERPINB5, TFF2, TGFA),
tumorigenesis of small intestine (PLA2G4A), size/
tumorigenesis of polyp (ASPH, CDKN2A, TGFA)
15 366 Global Drug metabolism, endocrine system development
and function, small molecule biochemistry, lipid
metabolism, molecular transport, gene expression,
cell death, cell morphology, cancer, gastrointestinal
disease, digestive system development and
function, tissue development
Steroid metabolism (AKR1C2, CYP3A5,
UGT2B15, UGT2B17), conversion of progesterone
(AKR1C3, HSD3B2), modification of dopamine
(SULT1A3, XDH), oxidation of norepinephrine
(MAOA), drug transport (ANCB1, ABCG2),
transport of fludarabine (SLC28A2),
hydrocortisone uptake (ABCB1), formation of
aberrant crypt foci (NR5A2, PTGER4), cell death
of enteroendocrine cells (GCG, PYY), growth of
crypt cells (NKX2, NKX3)
16 221 Global Cardiovascular system development and function,
cellular movement, hematological system
development and function, immune response,
cancer, neurological disease, carbohydrate
metabolism, organismal development, digestive
system development and function, tissue
development
Cell movement/proliferation of endothelial cells
(ADIPOQ, CXCL12, ENPP2, FGF13, HGF, HHEX,
MYH11, PTN), formation of endothelial tube and
blood vessel (ADAMTS1, ANGPTL1, CCL11,
CXCL12, ENPP2, F13A1, HGF, MEF2C, MYH11,
PTEN), cell movement of cancer cells (CXCL12,
CD36, HGF, IGF1, L1CAM, SFRP1, PTN),
tumorigenesis (AGTR1, CNN1, ENPP2, FGF7,
HGF, IGF1, KIT, L1CAM), Hirschprung disease
(EDNRB, L1CAM)
Genome Biology 2007, Volume 8, Issue 7, Article R131 Kaiser et al. R131.13
comment reviews reports refereed researchdeposited research interactions information
Genome Biology 2007, 8:R131
expression in development) maps to genes highly associated
with the disruption of basement membranes, invasion and
cell cycle progression, as well as altered transcriptional con-
trol. Cluster C21 (313 transcripts in which human tumors
somewhat variably express a set of genes that are rarely
expressed by the mouse tumors) is remarkable for its compo-
sition of genes associated with cell cycle proliferation, tissue
disruption and angiogenesis. Thus, while categorically quite
similar to cluster C23, the genes in cluster C21 represent a
separately regulated module that is enriched for genes
associated with invasion. Clusters C21 and C23 reveal sets of
genes likely involved in tumor progression. Cluster C22 (with
genes over-expressed in all mouse and human tumors and
strongly expressed in embryonic colon) represents a group of
genes highly correlated with transformation. The top-ranked
transcription factor present in this cluster, with regulation
independent of β-catenin localization, is Myc/MYC (Figure
7b). Although Myc was lower in expression in the Smad3
-/-
tumors compared to tumors from the other three models, it
was elevated in all four models relative to normal adult colon.
Myc/MYC was over-expressed in all mouse and human
tumors as well as in development. This contrasts with Sox4,
which is unaltered in expression in the Smad3
-/-
and Tgfb1
-/-
;
Rag2
-/-
tumors but is up-regulated in AOM and Apc
Min/+
tumors relative to normal adult colon (Figure 7b). Myc/MYC
over-expression may be independent of nuclear β-catenin
status. Increased Myc/MYC expression may reflect both acti-
vation of canonical Wnt signaling, as it is a target of nuclear
β-catenin/TCF [28], and deregulation of TGFβ signaling, as
TGFβ1 is known to repress Myc/MYC [29-31]. These observa-
tions suggest a fundamental role for Myc/MYC in colonic
neoplasia.
Discussion
Numerous mouse models of intestinal neoplasia have been
developed, each with unique characteristics. The models con-
structed to date, however, do not fully represent the complex-
ity of human CRCs principally because most are unigenic in
origin and produce primarily adenomas and early stage can-
cers. Although models like Apc
Min/+
show molecular similari-
ties to human CRCs, such as initiation of adenoma formation
by inactivation of Apc, little is known about the molecular
similarities of tumors from the different mouse models. It is
also unknown how such common and perhaps large-scale
molecular changes in mouse models relate to the molecular
programming of human CRC. To shed light on the underlying
molecular changes in tumors from mouse models and human
CRC, we assessed the relationship at the molecular level of
four widely used, but genetically distinct, mouse models that
develop colon tumors. A subsequent analysis of the models in
the context of embryonic mouse colon development was also
undertaken. Finally, to identify consensus species-independ-
ent cancer signatures that may define gene expression
changes common to all CRCs, we projected relevant mouse
model signatures onto a large set of human primary CRCs of
varied histopathology and stage.
Differential canonical WNT signaling activity
discriminates two major classes of mouse models of
CRC with distinct molecular characteristics
Tumors from mouse models of CRC exhibit significant phe-
notypic diversity [6], and, therefore, were expected to exhibit
differential gene expression patterns. Using a combination of
inter-model and normal adult gene expression level referenc-
ing, our analysis of tumors from mouse models of CRC has
revealed a low complexity between models and strains, and
has identified common and unique transcriptional patterns
associated with a variety of biological processes and pathway-
associated activities. Our results demonstrate an imbalance
between proliferation and differentiation, with nuclear β-cat-
enin-positive tumors being more proliferative, less differenti-
ated and with lower immunogenic characteristics than
tumors from nuclear β-catenin-negative tumors. Mouse
tumors characterized by signatures of relative up-regulation
of genes associated with cell cycle progression also showed
increased canonical WNT signaling activity (Apc
Min/+
and
AOM). Tumors from mouse models not showing canonical
WNT signaling pathway activation (Smad3
-/-
and Tgfb1
-/-
;
Rag2
-/-
) were characterized by up-regulation of genes associ-
ated with inflammatory and innate immunological responses,
and intestinal epithelial cell differentiation. Recent studies
have indicated that chronic inflammation caused either by
infection with Helicobacter pylori [32] or Helicobacter
17 734 Global Immune response, cellular movement,
hematological system development and function,
cell-to-cell signaling and interaction, immune and
lymphatic system development and interaction,
tissue development, connective tissue disorders,
inflammatory disease, cancer
Cell invasion (CD14, CTSB, CTSL, ETS1, FN1,
FSCN, FST, INHBA, ITGB2, LOX, MMP2, MMP9,
MMP11, MMP12, MMP13, MYLK, OSM, PLAU,
RECK, RGS4, RUNX2, S100A4, SPP1, SULF1,
TIMP3), adhesion of tumor cells (ADAM12,
ANXA1, CCL3, CCL4, FN1, ICAM1, IL6, ITGA4,
ITGB2, PLAU, SELE, THBS1), metastasis of
carcinoma cell lines (CCL2, DAPK1, S100A4,
TWIST1, WISP1), tumor cell spreading (FN1,
PLAU, SNAI2, THBS1, TNC), progression of
gastric carcinoma (APOE, COL1A1, COL1A2)
PS, ProbeSets.
Table 3 (Continued)
Detailed cluster analysis: differential and statistically significant biological functions in clusters C11-C17
R131.14 Genome Biology 2007, Volume 8, Issue 7, Article R131 Kaiser et al. />Genome Biology 2007, 8:R131
hepaticus [13] is a prerequisite for intestinal tumor develop-
ment in Smad3
-/-
and Tgfb1
-/-
; Rag2
-/-
mice, respectively.
The activation of canonical WNT signaling in AOM tumors
was identified using a between-tumor global median normal-
ization to gene expression data. However, when tumor sam-
ple expression was referenced to that of normal adult
intestinal tissue, many more genes are up-regulated, includ-
ing developmental genes that are not dependent on nuclear β-
catenin. That canonical WNT signaling-related genes are
altered similarly in both AOM and Apc
Min/+
tumors suggests
biological similarities between the two models. In addition,
the relatively consistent programming within the AOM model
also emphasizes its value for examining the more complicated
genetics that result in strain-specific sensitivity to environ-
mental agents that induce cancer.
Activation of canonical WNT signaling leads to nuclear trans-
location of β-catenin and, through its interaction with LEF/
TCF, the regulation of genes relevant to embryonic develop-
ment and proliferation [16], as well as stem cell self-renewal
[33]. Consequently, the activated canonical WNT signaling
Human CRCs exhibit gene expression profile complexity consistent with significant tumor subclassesFigure 5
Human CRCs exhibit gene expression profile complexity consistent with significant tumor subclasses. Genes potentially able to distinguish cancer subtypes
were identified from Affymetrix HG-U133 plus2 Genechip expression profiles by filtering for 3,285 probe sets that were top-ranked by raw expression
and their differential regulation in at least 10 out of 100 human colorectal cancer tumors. Coordinately regulated transcripts and similarly behaving samples
were identified via hierarchical tree clustering. Seven different gene clusters (C11-17) were identified that distinguished ten or more tumors from the
other tumors. Gene clusters were found to be highly enriched for gene functions listed in Table 3. Data were processed using Robust Microarray Analysis
(RMA) with expression value ratios depicted as the relative expression per probe set in each sample relative to the median of its expression across the
100 CRCs. A striking heterogeneity of gene expression was observed, including metallothionein genes in cluster C15 previously shown to be predictive of
microsatellite instability (indicated by asterisk), and C17 represented by 734 probesets rich in genes associated with extracellular matrix and connective
tissue, tumor invasion and malignancy. Tissue groups: AC, adult colon; CRC, human CRC. Staging: nAC, normal colon; Dukes A-D, human tumors
obtained from individuals. Clusters C11-C17 labeled to the right of the heatmap correspond to the K-means functional clusters listed in Table 3.
3.0
0.3
1.0
C17
C17
C11
C11
C15
C15
C12
C12
C16
C16
C14
C14
Gene expression relative to
tumor median
C13
3,285 features
*
nAC
CRC
Sample type Dukes stage
nAC
A
C
B
D
Sample type
Dukes stage
Genome Biology 2007, Volume 8, Issue 7, Article R131 Kaiser et al. R131.15
comment reviews reports refereed researchdeposited research interactions information
Genome Biology 2007, 8:R131
observed in Apc
Min/+
and AOM models suggests that tumors
may arise as a consequence of proliferation of the stem cell or
'transient amplifying' compartment. In the colonic crypt, loss
of TCF4 [34] or DKK1 over-expression [35] promotes loss of
stem cells, suggesting that canonical WNT signaling is
required for the maintenance of the intestinal stem cell com-
partment [34-36]. Conversely, increased nuclear β-catenin/
TCF4 activity imposes a crypt progenitor phenotype on tumor
cells [18]. In this study, we identified transcriptional activa-
tion of the canonical WNT signaling pathway in tumors from
Apc
Min/+
and AOM mice. This was confirmed by immunohis-
tochemistry (Figure 2b).
In colon tumors and perhaps intestinal stem cells, activation
of canonical WNT signaling promotes a hyperproliferative
state. Proliferation-related characteristics of nuclear β-cat-
enin-positive tumors include increased expression of CCND1,
MYC, PCNA [18], and Sox4 [16]. These genes were also
identified as a component of our nuclear-β-catenin-positive
signatures. In turn, increased MYC decreases intestinal cell
differentiation by binding to and repressing the Cdkn1a (cod-
ing for p21
CIP1/WAF1
) promoter [37], the gene encoding Wnt-
inhibitory factor Wif1, the gene encoding the negative regula-
tor of WNT Naked1 [38], and the gene encoding the Tak1/
Nemo-like kinase, Nlk [39]. Wif1 displays a graded expres-
sion in colonic tissue, with higher expression in the stem cell
compartments and lower expression in the more differenti-
ated cells at the luminal surface, suggesting that Wif1 may
contribute to stem cell pool maintenance independent of
WNT signaling inhibition. [40].
Canonical WNT signaling not only governs intestinal cell pro-
liferation, but also cell differentiation and cell positioning
along the crypt-lumen axis of epithelial differentiation.
Increased canonical WNT signaling activity enhances
MATH1-mediated amplification of the gut secretory lineages
[41]. Canonical WNT signaling also influences cell
positioning by regulating the gradient of EPHB2/EPHB3 and
EPHB1 ligand expression [42,43]. Together, our data suggest
a complex imbalance of crypt homeostasis due to enhanced
canonical WNT activity.
Our results indicate that tumors arising in response to abnor-
mal TGFβ1/SMAD signaling [14,44] are similar to one
another in their specific gene signatures and broadly distinct
from those with activated canonical WNT signaling by their
absence of nuclear β-catenin. Unique to the dysregulated
TGFβ1/SMAD4 signaling models is the strong signature of an
immunologically altered state, with up-regulation of genes
determining immune and defense responses, such as Il18,
Irf1 and mucin pathway-associated genes. Again, these
tumors are usually characterized by a strong inflammatory
component when evaluated histopathologically, even in the
absence of T- and B-cells such as in the Tgfb1
-/-
; Rag2
-/-
back-
ground.
As shown in Figure 2a, the microarray patterns of gene
expression for AOM and Apc
Min/+
tumors are mirror images
of those for Tgfb1
-/-
; Rag2
-/-
tumors. It is perhaps not surpris-
ing that combining these two transcriptional programs
results in increased number and invasiveness of colonic
tumors as recently reported for Apc
Min/+
mice crossed to
Smad3
-/-
mice [45]. Moreover, combined activation of canon-
ical WNT signaling and inhibition of TGFβ signaling also
results in more advanced intestinal tumors in Apc
delta716/+
;
Smad4
+/-
mice [46], and intestine-specific deletion of the
type II TGFβ receptor in Apc
1638N/wt
mice [47].
The findings that shared over-expressed signatures are iden-
tifiable in all four mouse models of CRC, which are also rep-
resentative of the majority of embryonic colonic over-
expressed signatures, and that these signatures are also
present in all human CRCs, suggest that colon tumors may
arise independently of canonical WNT signaling status. A
likely candidate to impart this oncogenic signaling is Myc,
which is an embryonic up-regulated transcript that is also
upregulated in all human CRCs and mouse tumor models
independently of nuclear β-catenin status.
Embryology provides insight into the biology of mouse
and human colon tumors
It has long been suggested that cancer represents a reversion
to an embryonic state, partly based upon the observation that
several oncofetal antigens are diagnostic for some tumors
[48,49]. To assess the embryology-related aspects of tumori-
genesis and tumor progression in CRC, we analyzed and com-
pared the transcriptomes of normal mouse colon
development and models of CRC. Our data show that devel-
opmentally regulated genes represent approximately 56% of
mouse tumor signatures, and that the tumor signatures from
the four mouse models recapitulate approximately 85% of
developmentally regulated genes.
There are at least two regulatory programs that determine the
expression of developmental genes by mouse tumors (Figures
2, 4, and 8). The simpler program is evident by the over-
expression of the earliest genes of colon development by the
nuclear β-catenin-positive models. The more subtle program
could be detected only in reference to adult colon and is
highly shared by nuclear β-catenin-negative models. This
program, though modified by nuclear β-catenin status, is rep-
resented by a large scale over-expression of developmentally
expressed genes in tumors that are both positive and negative
for canonical WNT signaling. Genes found within this signa-
ture have a large overlap with those present in the colon at
later developmental stages (E16.5-E18.5).
How do genes tightly regulated during mouse colon develop-
ment become activated in colon tumors? While activated
canonical WNT signaling imparts a strong influence, its
absence in Tgfb1
-/-
; Rag2
-/-
and Smad3
-/-
tumors, as deter-
mined by the absence of nuclear β-catenin, did not prevent
R131.16 Genome Biology 2007, Volume 8, Issue 7, Article R131 Kaiser et al. />Genome Biology 2007, 8:R131
Figure 6 (see legend on next page)
(a)
2,216 features
(c)
3.0
0.3
1.0
3.0
0.3
1.0
Observed Expected Observed Expected
Ortholog genome 8,621 2,718 n/a 2,365 n/a
Over-expressed
2,212 1,080* 697 549*** 607
Under-expressed
737 156** 232 431**** 202
Embryonic colon
Human CRCs
Over-expressed
Under-expressed
8,621 features
3.0
0.3
1.0
3.0
0.3
1.0
ED
LD
nACA
M
S
T
CRC
C22C22
C18C18
C19C19
C23C23
C20C20
C21C21
ED
LD
nACA
M
S
T CRC
(b)
Gene expression relative
to adult colon
Gene expression relative
to adult colon
Genome Biology 2007, Volume 8, Issue 7, Article R131 Kaiser et al. R131.17
comment reviews reports refereed researchdeposited research interactions information
Genome Biology 2007, 8:R131
the large scale activation of developmental/embryonic gene
expression. One mechanism may be through epigenetic alter-
ations. In human CRCs, these types of alterations in gene
expression programs [50] suggest a link between cellular
homeostasis and tumorigenesis. The recruitment of histone
acetyltransferases and histone deacetylases (HDACs) are key
steps in the regulation of cell proliferation and differentiation
during normal development and carcinogenesis [51].
Induction of Hdac2 expression occurs in 82% of human CRCs
as well as in tumors from Apc
Min/+
mice [19]. Alternatively,
common regulatory controls may operate in parallel growth
and differentiation/anti-diifferentiation pathways such that a
single or small subset of regulators, such as MYC or one or
more micro RNAs, may be responsible for the control of
multiple pathways. Indeed, consistent with our observation
of nuclear β-catenin-independent activation of Myc in all
mouse models and across the board for human CRC, deletion
of Myc has recently been demonstrated to completely abro-
gate nuclear β-catenin-driven small bowel oncogenesis in
mouse models [52].
Comparative analysis reveals underlying development-
related signatures in human CRCs
As shown in Figure 5, considerable and intriguing heteroge-
neity of human CRC is observed among genes highly relevant
for differential malignant behavior. However, employing
between-tumors normalization and referencing strategies
prevents the detection of gene expression patterns that are
shared between tumors. Using the adult normal colon as a
reference, as shown in Figure 6, a large fraction of differential
gene expression relative to adult colon could be demonstrated
that recapitulated developmental gene expression by virtue of
both activating embryonic colon gene expression and failing
to express genes associated with normal colon maturation.
Within these developmentally regulated gene sets, our analy-
ses revealed little evidence of CRC subsets, including those
suggestive of nuclear β-catenin negative tumors that might
approximate the Smad3
-/-
and Tgfb1
-/-
; Rag2
-/-
signature.
Our inability to identify distinct subclasses with respect to
developmental genes in the human CRCs is perhaps not sur-
prising in that over 80% of microsatellite-unstable (MSI+)
CRCs from HNPCC families exhibit nuclear β-catenin [53]. In
addition, within the developmental genes, little evidence was
apparent for signatures related to MSI+ tumors, often associ-
ated with HNPCC, although some of this type of signature was
perhaps apparent in the median normalized depiction of the
tumors as highlighted in Figure 5.
This report constitutes a comprehensive molecular evalua-
tion and comparison of mouse and human colon tumor gene
expression profiles. We have greatly improved our ability to
compare tumor gene expression profiles between mouse and
human tumors by using a referencing strategy in which gene
expression levels in the tumor samples are analyzed in rela-
tion to gene expression in corresponding normal colon epi-
thelium. This approach has revealed that gene expression
patterns are both shared and distinct between mouse models
and human CRCs. Although several recent studies have sug-
gested that tumors recapitulate embryonic gene expression
[16,27,54,55], the present study demonstrates the magnitude
of this similarity.
Finally, our results suggest that comparisons made between
mouse tumor models, developing embryonic tissues, and
human CRCs provides a powerful biological framework from
which to observe shared and unique genetic programs associ-
ated with human cancer. While ortholog-gene based analyses
have been used previously to obtain direct comparison of the
molecular features of mouse and human hepatocellular carci-
nomas [56], our results provide striking support for the
Both human CRCs and mouse colon tumors reactivate an embryonic gene signatureFigure 6 (see previous page)
Both human CRCs and mouse colon tumors reactivate an embryonic gene signature. When human and murine tumors are compared, they both broadly
re-express an embryonic gene expression pattern. Gene expression profiles from the mouse tumor models and human CRC samples were combined into
a single non-redundant gene ortholog genome table structure and subjected to comparative profile analysis. Informative probe-sets from human and
mouse platforms were selected, mapped to corresponding ortholog genes, and used to populate a table in which normalized expression for each gene is
relative to normal adult colon. (a) Heatmap plot for all cross-species gene orthologs both present and successfully measured on both the Affymetrix Hg-
U133 and Vanderbilt Mouse NIA 20 K microarrays (n = 8,621 features). This representation suggests that a large number of human CRC signatures exhibit
similar behaviors in the mouse tumors and during embryonic mouse colon development (sidebar: 1,080 (red) and 431 (green) gene lists from (b)). (b)
Based on results in (a), four separate gene lists were generated with criteria of over- or under-expression in development or over-expression or under-
expression in human CRCs (2,718, 2,365, 2,212, and 737, respectively, with the overlaps shown as a sidebar in (a); red, 1,080 transcripts, and green, 431
transcripts). Genes over-expressed and under-expressed in embryonic mouse colon and human CRCs were found to be over-represented as determined
by Fisher's exact test analysis (*p < 7 × 10
-88
, **p < 1 × 10
-76
, ***p < 5 × 10
-4
, ****p < 1 × 10
-76
). (c) Heatmap plot of all genes co-regulated in human CRCs
and during early (ED) and late (LD) mouse embryonic colon development (n = 2,216 features). Six predominant clusters (C18-C23) characterize the
transcriptional relationship between human CRC and mouse colon tumor models and embryonic development. Two clusters (C20 and 21) primarily
distinguish human CRCs from murine tumors (A, M, S and T). For example, CRC up-regulated transcripts that are either developmentally up- or down-
regulated are represented by cluster C22 (n = 860 features) and clusters C21/C23 (n = 142 features), respectively. Conversely, CRC down-regulated
transcripts that are either down- or up-regulated during development are shown in clusters C18/C19 (n = 258 features) and cluster C20 (n = 42 features),
respectively. Interestingly, while approximately 80% and approximately 60% of genes up- and down-regulated in both human CRCs and mouse
development were also up- and down-regulated in tumors from the various mouse models, several clusters provide very interesting exceptions: cluster
C20 comprises genes down-regulated in human CRCs that are routinely over-expressed in mouse tumors and development; cluster C21 comprises genes
robustly expressed in human CRC that are rarely expressed in embryonic colon or murine tumors. Sample groups: ED, early development (E13.5-E15.5);
LD, late development (E16.5-E18.5); A, AOM-induced; M, Apc
Min/+
; T, Tgfb1
-/-
; Rag2
-/-
; S, Smad3
-/-
. Tissue groups: AC, adult colon; CRC, human CRC.
Staging: nAC, normal colon.
R131.18 Genome Biology 2007, Volume 8, Issue 7, Article R131 Kaiser et al. />Genome Biology 2007, 8:R131
Table 4
Detailed cluster analysis: differential and statistically significant biological functions in clusters C18-C23
Cluster no. Number of PS Reference Pattern Biology Example genes
18 258 Adult colon Down (D); down
(CRC); down
(A/M/S/T)
Lipid metabolism, molecular transport,
cell death, cancer, cellular movement,
drug metabolism, lipid metabolism,
digestive system development and
function, small molecule biochemistry,
endocrine system development and
function, neurological disease
Gut epithelium differentiation (CA4,
CA12, CBR1, CHGB, KLF4, KLF9,
MCOLN2, SST, TFF3), apoptosis/cell
death (CYCS, GSN, KITLG, SST, TFF3,
TGFA), cytolisis/crypt damage (ABCB1,
KLKR1, PTGER4), formation of aberrant
crypt foci (NR5A2, PTGER4), drug
transport (ABCB1, ABCG2), migration
of tumor cells (EDG2, KITLG, SST,
TGFA), quantity of colonocytes
(GUCA2A)
19 42 Adult colon Up (D); down
(CRC); down
(A/M/S/T)
Digestive system development and
function, cancer, small molecule
biochemistry, reproductive system
development and function, organ
morphology
Colon and midgut development
(EDNRB), gastrointestinal stromal
tumor (KIT), apoptosis of mesothelioma
cells (KIT), melanocyte differentiation
(EDNRB, KIT), inhibition and
morphology of melanoma cells (HSPE,
LSP1), adhesion of lymphoma cells
(HSPE)
20 91 Adult colon Up (D); down
(CRC); up
(A/M/S/T)
Cell death, hematological disease,
immunological disease, cell-to-cell
signaling and interaction, hematological
system development and function,
immune response, cancer, cell
morphology, tissue development,
gastrointestinal disease
Apoptosis of colon carcinoma, cells
(BCL2), apoptosis of lymphoma cell lines
(BCL2, IGFBP4, MAP4K1, PDGFRA),
cell-cell contact of endothelial cells
(STAB1), lymphocyte quantity (BCL2,
CCR7, CD28, ITGB7, ITK, MUC1,
WNT4), proliferation of lymphocytes
(CD28, ITK), gastrointestinal stromal
tumor (PDGFRA), metastasis (CD28,
ENPP2, FKBP1A), transmembrane
potential of mitochondria (BCL2, CD28,
EYA2, LGALS2, MUC1)
21 313 Adult colon Down (D); up
(CRC); down
(A/M/S/T)
Cell death, nervous system development
and function, drug metabolism, small
molecule biochemistry, cancer, cell
cycle, cellular growth and proliferation,
tissue development
Melanocyte survival (RB1), proliferation
of neuronal progenitor cells (ATM,
VEGF), heparin binding (PRNP, TNC,
VEGF), dopamine formation (TH), drug
resistance (ABCC1), quantity of tumor
cell lines (LIF, PIK3R1, RB1, TIMP3,
VEGF), transformation (FOXO3A),
malignancy of astrocytoma (TNC),
tumor vascularization (PTEGS, VEGF),
growth of sarcoma cell lines (TIMP3),
tissue proliferation (GRP, KRIT1, RB1,
RBL2)
22 860 Adult colon Up (D); up
(CRC); up
(A/M/S/T)
Cell proliferation, cancer, DNA
replication/recombination/repair, cell
cycle progression and mitosis, cellular
movement, connective tissue
development and function, tumor
morphology; purine and pyrimidine
metabolism, folate metabolism
Cell transformation (Myc), mismatch
repair (HMGB1, MSH2, MSH6, PCNA),
arrest in mitosis (BIRC5, BUB1B,
CDC2.CHEK1, CSE1L, MAD2L1, MIF,
PLK1), migration/cytokinesis (ANLN,
CDC42, FN1, ITGB5, MSF, SPARC,
TOP2A), survival (AKT2, APEX1,
BIRC5), gastric carcinoma progression
(COL1A1, FUS), folate metabolism
(MTHFD1, MTHFD2)
Genome Biology 2007, Volume 8, Issue 7, Article R131 Kaiser et al. R131.19
comment reviews reports refereed researchdeposited research interactions information
Genome Biology 2007, 8:R131
hypothesis that cancer represents a subversion of normal
embryonic development. By inclusion of detailed mouse
embryonic and developmental profile information, our
results have revealed critical similarities and differences
between the mouse and human tumors that are particularly
revealing of oncogenic and tumor suppressor programs, some
genes from which should be useful for development of
diagnostic biomarkers and identification of therapeutic tar-
gets and pathways.
Materials and methods
Mouse models, human CRC patients and tumor
collection
Mouse tumors
All tumors were isolated as spontaneously occurring lesions
in Apc
Min/+
[57], Smad3
-/-
[58], and Tgfb1
-/-
; Rag2
-/-
, col-
lected at three-to-nine months of age depending on the model
(for a review, see [6]). The only exceptions were two Apc
Min/+
tumors, UW_3_2778 and UW_6_2748, that were 13 and 14
months and the three Tgfb1
-/-
; Rag2
-/-
tumors, all five of
which had histological features of locally invasive carcinoma
[7]. Three- to four-month old mice from various AXB recom-
binant inbred lines were treated with AOM doses chosen for
enhancement of inter-strain differences in susceptibility [11].
Mice were given four weekly i.p. injections of 10 mg AOM per
kg body weight, and tumors were collected six months after
the first injection. Animals were euthanized with CO
2
, colons
removed, flushed with 1× phosphate-buffered saline (PBS),
and laid out on Whatman 3 MM paper. A summary of the
mouse strains, mutant alleles and source laboratories is pre-
sented in Table 5. All tumors were obtained from the colon
only, the particular segment of which is indicated in the Gene
Expression Omnibus (GEO) database [59] reposited sample
information (GSE5261). The majority of Tgfb1
-/-
; Rag2
-/-
and
Smad3
-/-
tumors occur in the cecum and proximal colon and
all samples isolated for characterization were obtained from
there. In contrast, tumors isolated from Apc
Min/+
and AOM
mice occurred predominantly in the mid- and distal colon. A
small portion of the tumor was placed in formalin for histol-
ogy, with the remainder finely dissected into RNAlater
(Ambion Inc., Austin, TX, USA) and stored at -20°C. Normal
adult colon RNA for reference was obtained from whole colon
samples harvested from ten eight-week-old C57BL/6 male
mice. The tissue was lysed in Trizol Reagent (Invitrogen Sys-
tems Inc., Carlsbad, CA, USA) and homogenized. Total RNA
was purified using a Qiagen kit (USA-Qiagen Inc., Valencia,
CA, USA).
Human samples: collection/biopsies, regulatory aspects, compliance
and informed consents
Sample collection protocol and analyses at the H Lee Moffitt
Cancer Center and Research Institute have been described
previously [37]. Information collected with the samples for
this study includes solid tumor staging criteria for tumor,
nodes, and metastases (TNM), Dukes staging/presentation
criteria, pathological diagnosis, and differentiation criteria.
RNA isolation
All RNA samples were purified using Trizol Reagent from
finely dissected tumors and were subjected to quality control
screening using the Agilent BioAnalyzer 2100 (Agilent Tech-
nologies, Santa Clara, CA, USA).
Microarray procedures and data analysis
Mouse cDNA arrays
Mouse tumors were analyzed on Vanderbilt University
Microarray Core (VUMC)-printed 20 K mouse cDNA arrays,
composed principally of PCR products derived from three
sources: the 15 K National Institute of Aging mouse cDNA
library; the Research Genetics mouse 5 K set; and an addi-
tional set of cDNAs mapped to RefSeq transcripts. Labeling,
hybridization, scanning, and quantitative evaluation of these
two-color channel arrays were performed according to VUMC
protocols [60] using a whole mouse Universal Reference
standard (E17.5 whole fetal mouse RNA). Arrays were ana-
lyzed by GenePix version 3.0 (MDS Inc., Sunnyvale, CA,
USA), flagged and filtered for unreliable measurements, with
dye channel ratios corrected using Lowess and dye-specific
correction normalization as previously described [15].
Human Affymetrix oligonucleotide arrays
Human RNA samples were labeled for hybridization to
Affymetrix HG-U133plus2 microarrays using the Affymetrix-
23 142 Adult colon Down (D); up
(CRC); up
(A/M/S/T)
Connective tissue development and
function, cell-to-cell signaling,
development disorder, organismal injury
and abnormalities, tumor morphology,
hematological system development and
function, immune and lymphatic system
development and function, cancer
Cell transformation (ESR1, SRC), basal
membrane disruption (MMP7), cell
extension (ATF3, CD82, IL6, SRC),
contact growth inhibition (JUN, IL6),
osteocyte differentiation (IL6, JUN,
SMAD6, SRC), cell cycle progression
(ESR1, IER3, IL6, PSEN2), ERK/MAPK
signaling (ESR1, ETS2, PPP1R10,
PPP2R5C), development of tumor
(CXCL6, ESR1, IER3, IL6, JUN), invasion
of colon cancer cell lines (CD82, SRC),
colon cancer (JUN, PDGFRL, SRC)
A, AOM-induced; M, Apc
Min/+
; PS, ProbeSets; S, Smad3
-/-
; T, Tgfb1
-/-
; Rag2
-/-
.
Table 4 (Continued)
Detailed cluster analysis: differential and statistically significant biological functions in clusters C18-C23
R131.20 Genome Biology 2007, Volume 8, Issue 7, Article R131 Kaiser et al. />Genome Biology 2007, 8:R131
Figure 7 (see legend on next page)
(b)
(a)
MYC
SOX4
nAC-m nAC-h
A M S T
Human
CRCs
Murine tumor
models
Dev
Genome Biology 2007, Volume 8, Issue 7, Article R131 Kaiser et al. R131.21
comment reviews reports refereed researchdeposited research interactions information
Genome Biology 2007, 8:R131
recommended standard labeling protocol (Small-scale
labeling protocol version 2.0 with 0.5 μg of total RNA;
Affymetrix Technical Bulletin). Microarrays were scanned
with MicroarraySuite version 5.0 to generate 'CEL' files that
were processed using the RMA algorithm as implemented by
Bioconductor [15].
Analysis strategy
The four different mouse models of CRC were compared for
model-specific differences, then compared to mouse colon
development stages, and then to human CRC samples (Figure
1). The mouse tumor sample array data are composed of Low-
ess-normalized Cy3:Cy5 labeling ratios of each individual
tumor sample versus a universal E17.5 whole fetal mouse ref-
erence RNA (described using MIAME guidelines in the NCBI
GEO database under series accession number GSE5261). The
first approach to referencing was to compare normalized
ratios across the tumor series. To do this, for each gene, the
Lowess-corrected ratio for each probe element (sample ver-
sus E17.5 whole fetal mouse reference) was divided by the
median ratio for that probe across the entire tumor sample
series. This is termed the median-per-tumor expression ratio
and was useful for identifying, clustering and visualizing dif-
ferences that occur between the different tumor samples.
Since we previously collected mouse expression data for nor-
mal E13.5-E18.5 colon samples from inbred C57BL/6J and
outbred CD-1 mice [15] using the identical E17.5 whole fetal
mouse reference, this allowed us to combine the data directly.
Differential expression profiles in the tumors were combined
with relative developmental gene expression levels by direct
comparisons of ratios determined within each experimental
series. Initial comparisons were made between median nor-
malized tumor data to gene expression levels observed in the
E13.5-E18.5 and adult (eight week post-natal) colon samples,
which were referenced to either E13.5 samples or to the adult
colon. The latter approach subsequently allowed for the
broadest comparison of mouse and human data using gene
ortholog mapping. Correlated phenomena could be observed
from any of the different referencing strategies.
Inter-organism gene ortholog and inter-platform comparison strategy
Pairs of human and mouse ortholog genes (12,693) were
curated using the Mouse Genome Informatics (MGI; The
Jackson Laboratory) [61] and National Center for Biotechnol-
ogy Information (NCBI) Homologene [62] databases. Indi-
vidual microarray elements or features were mapped to these.
The concatenated human and mouse RefSeq IDs was used as
the composite ID for the orthologous gene pair in the ortholog
genome definition. NIA/Research Genetics mouse cDNAs
were mapped to human orthologs using a variety of resources,
usually via the Stanford Online Universal Reference resource
[63]. Gene transcript assignments were made unique by
choosing the longest corresponding transcript. To map the
Affymetrix human and mouse array data into the ortholog
genome, we used a sequence matching approach. First, we
obtained human and mouse transcript sequences from
RefSeq [64] and probe sequences from the manufacturer's
website [65]. Next, we computed all perfect probe-transcript
pairs. We excluded probes that matched multiple gene sym-
bols but accepted probes that matched multiple transcripts.
Probe sets were assigned to represent a given transcript if at
least 50% of the perfect match probes of the probe set
matched to that transcript. The newly assigned transcript
identifiers were then used to map probe sets to ortholog
genes. Since some transcripts have multiple probe-set repre-
sentations on both the Affymetrix and cDNA microarrays to
one ortholog identifier, we employed an ad hoc strategy to use
the average of those probe sets or cDNAs that exhibited con-
sistent regulation across a sample series. In such cases, the
signals of the regulated probe sets that were interpreted as
being in agreement were averaged and assigned to the corre-
sponding ortholog. We excluded probe sets or cDNAs that we
were aware corresponded to non-transcript genomic
sequence as tested using BLAT at the UCSC Goldenpath web-
site [66].
Mouse-human RefSeq gene ortholog assignments can be
found at GenomeTrafac [67,68]. All ortholog assignments
and cross-species mapping annotations were incorporated
into annotations associated with the Affymetrix HG-U133
plus2.0 genome. Gene expression ratios obtained for the
mouse samples were then represented as expression values
within the human platform for all of the probe sets that
mapped to the corresponding mouse gene ortholog. Data for
the primary human sample series, as well as the combined
mouse-human data sets, are available in the Cincinnati Chil-
dren's Hospital Medical Center microarray data server [69] in
the HG-U133 genome under the KaiserEtAl_2006 folders
The up-regulated signature in tumors from Apc
Min/+
(M) and AOM (A) models (cluster C6, Figure 2) is enriched with genes associated with the activation of the canonical WNT signaling pathway, as determined by nuclear β-catenin positivityFigure 7 (see previous page)
The up-regulated signature in tumors from Apc
Min/+
(M) and AOM (A) models (cluster C6, Figure 2) is enriched with genes associated with the activation of
the canonical WNT signaling pathway, as determined by nuclear β-catenin positivity. (a) Schematic diagram of the canonical WNT signaling pathway
showing elements present in cluster C6 (gene symbols with gray background). Key elements of this pathway (Ctnnb1, Lef1, Tcf and Myc) are outlined in
blue. (b) Relative gene expression for MYC and SOX4 is plotted for individual murine and human tumors. The relative expression level of MYC and SOX4
is normalized to adult colon. Note that whereas Sox4, a canonical WNT target gene, is expressed at high levels in all human CRCs, A/M tumors and during
embryonic mouse colon development, it is not expressed in Smad3
-/-
(S) and Tgfb1
-/-
; Rag2
-/-
(T) tumors (black). In contrast, MYC is over-expressed in all
human and murine tumors and during colonic embryonic development (red), irrespective of the activation of canonical WNT signaling, as determined by
nuclear β-catenin positivity (Figure 2). Tissue groups: as above and: nAC-m, normal adult mouse colon; nAC-h, normal adult human colon; Dev, developing
mouse colon.
R131.22 Genome Biology 2007, Volume 8, Issue 7, Article R131 Kaiser et al. />Genome Biology 2007, 8:R131
Figure 8 (see legend on next page)
Non
-
developmental programs
invoked by colon cancer
Terminal differentiation/ developmental
maturation-associated tumor suppression
Late
embryonic
genes
Early
embryonic
genes
Embryonic Adult
Gene
expression
Human
CRC
AOM,AOM,
ApcApc
MinMin/+/+
Mature
genes
Oncogenes acting via
embryonic colon gene
program activation
Adenoma
Human
CRC
Mouse CRC
models
Normal
colon
Tumor suppressors
acting via control of
terminal differentiation
Shared
colorectal
carcinoma
patterns
Oncogenes acting via non-
developm ental tumor growth
program activation
Tumor suppressors
acting via inhibition of
malignant behaviors
(b)
(a)
Smad3Smad3
//
Tgfb1Tgfb1
//
C18C18 Arrest of Arrest of
differentiationdifferentiation
C19 C19 Digestive Digestive
system development system development
and maturationand maturation
C23 C23 Invasion, Cell Invasion, Cell
cycle control Icycle control I
C22 C22
TransformationTransformation
C20C20 Loss of
apoptosis
C21C21 Cell cycle Cell cycle
control IIcontrol II
Subtype-
specific
colorectal
carcinomas
C17 C17 inflammation, Inflam mation,
extracellular extracellular
matrix, metastasismatrix, metastasis
C12C12 Growth,
adhesion, RNAadhesion, RNA
Non-developmental
malignancy pathways
Genome Biology 2007, Volume 8, Issue 7, Article R131 Kaiser et al. R131.23
comment reviews reports refereed researchdeposited research interactions information
Genome Biology 2007, 8:R131
('guest' login; all cross-platform ortholog gene identifiers are
contained as annotation fields within the HG-U133 genome
table).
Statistical and data visualization approaches
Most normalization, expression-level referencing, statistical
comparisons, and data visualization were performed using
GeneSpring v7.0 (Silicon Genetics-Agilent (part of Agilent
Technologies). Fisher's exact test was performed online at the
MATFORSK Fisher's Exact Test server [70]. To identify dif-
ferentially expressed features between two or more classes,
we applied GeneSpring's Wilcoxon-Mann-Whitney or the
Kruskal-Wallis test, respectively. For three or more classes,
the initial non-parametric test was followed by the Student-
Newman-Keuls post-hoc test. Results from the primary anal-
yses were corrected for multiple testing effects by applying
Benjamini and Hochberg false discovery rate (FDR) correc-
tion [71]. In general, due to the referencing strategies, good
platform technical performances, and moderately low within-
group biological variation of gene expression, stringent cut-
offs could be used, that is, the FDR level of significance was
set between FDR < 5.10
-5
and FDR < 5.10
-4
. K-means cluster-
ing was performed using the GeneSpring K-means tool and
the Pearson correlation similarity measure.
Ontology-based analysis of gene cluster-associated
functional correlates
Gene expression clusters were analyzed for the occurrence of
multiple genes involved in related gene function categories by
comparing each list of coordinately regulated clustered genes
to categories within Gene Ontology, pathways, or literature-
based gene associations using GATACA [72], Ontoexpress
[73], and Ingenuity Pathway Analysis, version 3 (IPA, Inge-
nuity Systems, Redwood City, CA, USA) [74]. To do this, each
cluster indicated in Figures 2, 4, 5, 6 and 8 was converted to a
list of gene identifiers, uploaded to the application, and exam-
ined for over-representation of multiple genes from one or
more molecular networks, or functional or disease associa-
tions as developed from literature mining. Networks of these
focus genes were algorithmically generated based on the rela-
tionships of individual genes as derived from literature review
and used to identify the biological functions and/or associ-
ated pathological processes most significant for each gene
cluster. Fisher's exact test was used to calculate a p value esti-
mating the probability that a particular functional classifica-
tion or category of genes is associated with a particular
pattern or cluster of gene expression more than would be
expected by chance. For each cluster, only the top significant
functional classes and canonical pathways are shown. Figure
An integrated view of colon cancer transcriptional programs provides novel insight into neoplasiaFigure 8 (see previous page)
An integrated view of colon cancer transcriptional programs provides novel insight into neoplasia. Murine colon tumor adenomas and human CRCs both
show adoption and dysregulation of signatures tightly controlled during embryonic mouse colon development. The use of etiologically distinct mouse
models of colon cancer allows for the identification of models that resemble different stages of embryonic mouse colon development and that are
recapitulated by specific tumor types. (a) All tumors exhibit large-scale activation of developmental patterns. Nuclear β-catenin-positive (Apc
Min/+
and
AOM) tumors map more strongly to early development stages during (more proliferative, less differentiated), whereas nuclear β-catenin-negative (Tgfb1
-/-
; Rag2
-/-
and Smad3
-/-
) tumors map more strongly to later stages consistent with increased epithelial differentiation. (b) Overall representation of the
relationship of mouse colon tumor models and human CRC to development and non-developmental expression patterns. Gene expression clusters
mapped to the progression of adenomatous and carcinomatous transformation identified in Figures 5 and 6 are shown as the clusters of genes whose
expression is either gained or lost associated with the stage of progression. For example normal development could be considered as 'subverted' if there
is an absence of expression of genes normally expressed at high level in the developing colon that fail to be expressed in tumors (for example, C18, C19),
or that are activated in tumor but not normally expressed in development (C20). Upregulated clusters are enriched for genes with known oncogenic
functions and down-regulated clusters for genes associated with tumor suppression. Both mouse colon tumor models and human CRC share in the
activation of embryonic colon expression (C22), or partially overlap (C23, dotted lines) the loss or repression of adult differentiation-associated genes
(C19), and the loss of tumor suppressor genes (C18). Many human CRCs also lack the expression of additional tumor suppressor programs and gain the
expression of oncogenes that are not over-expressed during normal developmental morphogenesis (C21).
Table 5
Mouse models of colon cancer
Model Mm strain N Tumor-generating laboratory
Azoxymethane (AOM) A × B 14 Threadgill
Apc
Min/+
(SWR × B6) F1 2 Dove
Apc
Min/+
(BR × B6) F1 2 Dove
Apc
Min/+
C57BL/6 5 Groden
Smad3
-/-
129 6 Graff
Smad3
-/-
129 7 Coffey
Tgfb1
-/-
; Rag2
-/-
C57BL/6 3 Doetschman
Tumors from four established mouse models of CRC (Apc
Min/+
, AOM, Smad3
-/-
and Tgfb1
-/-
; Rag2
-/-
were analyzed. The table provides details on the
mouse strains used for the four models, as well as information on the number of samples generated per model and sample-originating laboratory.
R131.24 Genome Biology 2007, Volume 8, Issue 7, Article R131 Kaiser et al. />Genome Biology 2007, 8:R131
7a shows a diagram of the canonical WNT signaling pathway
and an associated-gene network that was a top-ranked
association of the clusters that exhibited significant over-
expression in AOM and Apc
Min/+
versus Smad3
-/-
and Tgfb1
-/-
;
Rag2
-/-
mouse models. Genes or gene products are repre-
sented as nodes, and biological relationships between nodes
are represented as edges (lines). All edges are supported by at
least one literature reference from a manuscript, or from
canonical information stored in the Ingenuity Pathways
Knowledge Base.
qRT-PCR
To confirm the validity of data normalization and referencing
procedures as well as the cDNA gene assignments of the
printed arrays used in the microarray analyses, we used qRT-
PCR to measure relative levels of nine genes found by micro-
array data analysis to be differentially expressed (FDR <
5.10
-5
) in tumors from Apc
Min/+
and Smad3
-/-
mice. Total
RNAs from C57BL6 Apc
Min/+
and 129 Smad3
-/-
tumor sam-
ples (20 μg) were reverse-transcribed to cDNA using the High
Capacity cDNA Archive Kit (oligo-dT primed; Applied Biosys-
tems, Foster City, CA, USA). qRT-PCR reactions (20 μl) were
set up in 96-well MicroAmp Reaction Plates (Applied Biosys-
tems) using 10 ng of cDNA template in Taqman Universal
PCR Master Mix and 6-FAM-labeled Assays-on-Demand
primer-probe sets (Applied Biosystems). Reactions were run
on an MX3000P (Stratagene, a division of Agilent Technolo-
gies) with integrated analysis software. Threshold cycle num-
bers (Ct) were determined for each target gene using an
algorithm that assigns a fluorescence baseline based on meas-
urements prior to exponential amplification. Relative gene
expression levels were calculated using the ΔΔCt method [75],
with the Gusb gene as a control. Fold-change was determined
relative to expression in normal adult colon from two C57BL/
6J mice.
Immunohistochemistry
Immunohistochemical procedures were performed as
described [15]. Apc
Min/+
and Smad3
-/-
colon tumors were rap-
idly dissected, fixed in 4% paraformaldehyde, and embedded
in paraffin before cutting 10 μm thick sections. Antigen
retrieval was performed by boiling for 20 minutes in citrate
buffer, pH 6.0. Sections were treated with 0.3% hydrogen
peroxide in PBS for 30 minutes, washed in PBS, blocked in
PBS plus 3% goat serum and 0.1% Triton X-100, and then
incubated with primary antibodies and HRP-conjugated goat
anti-rabbit secondary antibody (Sigma, St Louis, MO, USA).
Antigen-antibody complexes were detected with a DAB per-
oxidase substrate kit (Vector Laboratories, Burlingame, CA,
USA) according to the manufacturer's protocol.
Acknowledgements
This study was supported by grants from GI SPOREs P50 CA95103 (RJC)
and P50 CA106991 (DWT), R01 CA079869 (DWT), R01 CA046413 (RJC),
R01 CA063507 (JG), R37 CA63677 (WFD), and the NCI-sponsored Mouse
Models of Human Cancer Consortium (MMHCC) with U01 CA84239
(RJC), U01 CA84227 (WFD), U01 CA98013 (JG), U01 CA105417 (DWT),
R24 DK 064403 (BJA), T32 HL07382-28 (WJ), The authors thank Susan
Kasper and Ritwick Ghosh for performing stathmin immunostaining. The
authors also acknowledge The State of Ohio Biotechnology Research and
Technology Transfer Partnership award for sponsorship of the Gastroin-
testinal Cancer Consortium (TD, JG) and the Center for Computational
Medicine (BJA). Additional sponsorship for important collaborative interac-
tions and strategy development among the investigators from each of the
participating research groups was provided under the auspices of 'Colon
Cancer 2004', a conference sponsored by the AACR and the MMHCC and
hosted by The Jackson Laboratory.
References
1. Heath JP: Epithelial cell migration in the intestine. Cell Biol Int
1996, 20:139-146.
2. Sancho E, Batlle E, Clevers H: Signaling pathways in intestinal
development and cancer. Annu Rev Cell Dev Biol 2004,
20:695-723.
3. Brabletz T, Hlubek F, Spaderna S, Schmalhofer O, Hiendlmeyer E, Jung
A, Kirchner T: Invasion and metastasis in colorectal cancer:
epithelial-mesenchymal transition, mesenchymal-epithelial
transition, stem cells and beta-catenin. Cells Tissues Organs
2005, 179:56-65.
4. Helm J, Enkemann SA, Coppola D, Barthel JS, Kelley ST, Yeatman TJ:
Dedifferentiation precedes invasion in the progression from
Barrett's metaplasia to esophageal adenocarcinoma. Clin
Cancer Res 2005, 11:2478-2485.
5. Kaihara T, Kusaka T, Nishi M, Kawamata H, Imura J, Kitajima K, Itoh-
Minami R, Aoyama N, Kasuga M, Oda Y, et al.: Dedifferentiation
and decreased expression of adhesion molecules, E-cadherin
and ZO-1, in colorectal cancer are closely related to liver
metastasis. J Exp Clin Cancer Res 2003, 22:117-123.
6. Boivin GP, Groden J: Mouse models of intestinal cancer. Comp
Med 2004, 54:15-18.
7. Boivin GP, Washington K, Yang K, Ward JM, Pretlow TP, Russell R,
Besselsen DG, Godfrey VL, Doetschman T, Dove WF, et al.: Pathol-
ogy of mouse models of intestinal cancer: consensus report
and recommendations. Gastroenterology 2003, 124:762-777.
8. Moser AR, Pitot HC, Dove WF: A dominant mutation that pre-
disposes to multiple intestinal neoplasia in the mouse. Science
1990, 247:322-324.
9. Logan CY, Nusse R: The Wnt signaling pathway in develop-
ment and disease. Annu Rev Cell Dev Biol 2004, 20:781-810.
10. Oving IM, Clevers HC: Molecular causes of colon cancer. Eur J
Clin Invest 2002, 32:448-457.
11. Bissahoyo A, Pearsall RS, Hanlon K, Amann V, Hicks D, Godfrey VL,
Threadgill DW: Azoxymethane is a genetic background-
dependent colorectal tumor initiator and promoter in mice:
effects of dose, route, and diet. Toxicol Sci 2005, 88:340-5.
12. Grady WM, Myeroff LL, Swinler SE, Rajput A, Thiagalingam S, Lutter-
baugh JD, Neumann A, Brattain MG, Chang J, Kim SJ, et al.: Muta-
tional inactivation of transforming growth factor beta
receptor type II in microsatellite stable colon cancers. Cancer
Res 1999, 59:320-324.
13. Engle SJ, Ormsby I, Pawlowski S, Boivin GP, Croft J, Balish E, Doet-
schman T: Elimination of colon cancer in germ-free trans-
forming growth factor beta 1-deficient mice. Cancer Res 2002,
62:6362-6366.
14. Zhu Y, Richardson JA, Parada LF, Graff JM: Smad3 mutant mice
develop metastatic colorectal cancer. Cell 1998, 94:703-714.
15. Park YK, Franklin JL, Settle SH, Levy SE, Chung E, Jeyakumar LH, Shyr
Y, Washington MK, Whitehead RH, Aronow BJ, Coffey RJ: Gene
expression profile analysis of mouse colon embryonic
development. Genesis 2005, 41:1-12.
16. Reichling T, Goss KH, Carson DJ, Holdcraft RW, Ley-Ebert C, Witte
D, Aronow BJ, Groden J: Transcriptional profiles of intestinal
tumors in Apc(Min) mice are unique from those of embry-
onic intestine and identify novel gene targets dysregulated in
human colorectal tumors. Cancer Res 2005, 65:166-176.
17. Nusse R: The Wnt Homepage; "Wnt target genes". 2007
[ />18. van de Wetering M, Sancho E, Verweij C, de Lau W, Oving I, Hurl-
stone A, van der Horn K, Batlle E, Coudreuse D, Haramis AP, et al.:
The beta-catenin/TCF-4 complex imposes a crypt progeni-
tor phenotype on colorectal cancer cells. Cell 2002,
Genome Biology 2007, Volume 8, Issue 7, Article R131 Kaiser et al. R131.25
comment reviews reports refereed researchdeposited research interactions information
Genome Biology 2007, 8:R131
111:241-250.
19. Zhu P, Martin E, Mengwasser J, Schlag P, Janssen KP, Gottlicher M:
Induction of HDAC2 expression upon loss of APC in colorec-
tal tumorigenesis. Cancer Cell 2004, 5:455-463.
20. Watson JD, Oster SK, Shago M, Khosravi F, Penn LZ: Identifying
genes regulated in a Myc-dependent manner. J Biol Chem 2002,
277:36921-36930.
21. Katz JP, Perreault N, Goldstein BG, Actman L, McNally SR, Silberg
DG, Furth EE, Kaestner KH: Loss of Klf4 in mice causes altered
proliferation and differentiation and precancerous changes
in the adult stomach. Gastroenterology 2005, 128:935-945.
22. Lamhonwah AM, Ackerley C, Onizuka R, Tilups A, Lamhonwah D,
Chung C, Tao KS, Tellier R, Tein I: Epitope shared by functional
variant of organic cation/carnitine transporter, OCTN1,
Campylobacter jejuni and Mycobacterium paratuberculosis
may underlie susceptibility to Crohn's disease at 5q31. Bio-
chem Biophys Res Commun 2005, 337:1165-1175.
23. Cragg RA, Phillips SR, Piper JM, Varma JS, Campbell FC, Mathers JC,
Ford D: Homeostatic regulation of zinc transporters in the
human small intestine by dietary zinc supplementation. Gut
2005, 54:469-478.
24. Jenny M, Uhl C, Roche C, Duluc I, Guillermin V, Guillemot F, Jensen
J, Kedinger M, Gradwohl G: Neurogenin3 is differentially
required for endocrine cell fate specification in the intestinal
and gastric epithelium. EMBO J 2002, 21:6338-6347.
25. Kruhoffer M, Jensen JL, Laiho P, Dyrskjot L, Salovaara R, Arango D,
Birkenkamp-Demtroder K, Sorensen FB, Christensen LL, Buhl L, et
al.: Gene expression signatures for colorectal cancer micros-
atellite status and HNPCC. Br J Cancer 2005, 92:2240-2248.
26. Giacomini CP, Leung SY, Chen X, Yuen ST, Kim YH, Bair E, Pollack
JR: A gene expression signature of genetic instability in colon
cancer. Cancer Res 2005,
65:9200-9205.
27. Hu M, Shivdasani RA: Overlapping gene expression in fetal
mouse intestine development and human colorectal cancer.
Cancer Res 2005, 65:8715-8722.
28. He TC, Sparks AB, Rago C, Hermeking H, Zawel L, da Costa LT,
Morin PJ, Vogelstein B, Kinzler KW: Identification of c-MYC as a
target of the APC pathway. Science 1998, 281:1509-1512.
29. Feng XH, Liang YY, Liang M, Zhai W, Lin X: Direct interaction of
c-Myc with Smad2 and Smad3 to inhibit TGF-beta-mediated
induction of the CDK inhibitor p15(Ink4B). Mol Cell 2002,
9:133-143.
30. Frederick JP, Liberati NT, Waddell DS, Shi Y, Wang XF: Transform-
ing growth factor beta-mediated transcriptional repression
of c-myc is dependent on direct binding of Smad3 to a novel
repressive Smad binding element. Mol Cell Biol 2004,
24:2546-2559.
31. Warner BJ, Blain SW, Seoane J, Massague J: Myc downregulation
by transforming growth factor beta required for activation
of the p15(Ink4b) G(1) arrest pathway. Mol Cell Biol 1999,
19:5913-5922.
32. Maggio-Price L, Treuting P, Zeng W, Tsang M, Bielefeldt-Ohmann H,
Iritani BM: Helicobacter infection is required for inflammation
and colon cancer in SMAD3-deficient mice. Cancer Res 2006,
66:828-838.
33. Reya T, Clevers H: Wnt signalling in stem cells and cancer.
Nature 2005, 434:843-850.
34. Korinek V, Barker N, Moerer P, van Donselaar E, Huls G, Peters PJ,
Clevers H: Depletion of epithelial stem-cell compartments in
the small intestine of mice lacking Tcf-4. Nat Genet 1998,
19:379-383.
35. Pinto D, Gregorieff A, Begthel H, Clevers H: Canonical Wnt sig-
nals are essential for homeostasis of the intestinal
epithelium. Genes Dev 2003, 17:1709-1713.
36. Kuhnert F, Davis CR, Wang HT, Chu P, Lee M, Yuan J, Nusse R, Kuo
CJ: Essential requirement for Wnt signaling in proliferation
of adult small intestine and colon revealed by adenoviral
expression of Dickkopf-1. Proc Natl Acad Sci USA 2004,
101:266-271.
37. Kwong KY, Bloom GC, Yang I, Boulware D, Coppola D, Haseman J,
Chen E, McGrath A, Makusky AJ, Taylor J, et al.: Synchronous glo-
bal assessment of gene and protein expression in colorectal
cancer progression. Genomics 2005, 86:142-158.
38. Zeng W, Wharton KA Jr, Mack JA, Wang K, Gadbaw M, Suyama K,
Klein PS, Scott MP: naked cuticle encodes an inducible antago-
nist of Wnt signalling. Nature 2000, 403:789-795.
39. Smit L, Baas A, Kuipers J, Korswagen H, van de Wetering M, Clevers
H: Wnt activates the Tak1/Nemo-like kinase pathway. J Biol
Chem 2004, 279:17232-17240.
40. Byun T, Karimi M, Marsh JL, Milovanovic T, Lin F, Holcombe RF:
Expression of secreted Wnt antagonists in gastrointestinal
tissues: potential role in stem cell homeostasis. J Clin Pathol
2005, 58:515-519.
41. Yang Q, Bermingham NA, Finegold MJ, Zoghbi HY: Requirement of
Math1 for secretory cell lineage commitment in the mouse
intestine. Science 2001, 294:2155-2158.
42. Batlle E, Bacani J, Begthel H, Jonkheer S, Gregorieff A, van de Born M,
Malats N, Sancho E, Boon E, Pawson T, et al.: EphB receptor activ-
ity suppresses colorectal cancer progression. Nature 2005,
435:1126-1130.
43. Batlle E, Henderson JT, Beghtel H, van den Born MM, Sancho E, Huls
G, Meeldijk J, Robertson J, van de Wetering M, Pawson T, Clevers H:
Beta-catenin and TCF mediate cell positioning in the intesti-
nal epithelium by controlling the expression of EphB/
ephrinB. Cell 2002, 111:251-263.
44. Engle SJ, Hoying JB, Boivin GP, Ormsby I, Gartside PS, Doetschman T:
Transforming growth factor beta1 suppresses nonmeta-
static colon cancer at an early stage of tumorigenesis. Cancer
Res 1999, 59:3379-3386.
45. Sodir NM, Chen X, Park R, Nickel AE, Conti PS, Moats R, Bading JR,
Shibata D, Laird PW: Smad3 deficiency promotes tumorigene-
sis in the distal colon of ApcMin/+ mice. Cancer Res 2006,
66:8430-8438.
46. Taketo MM, Takaku K: Gastro-intestinal tumorigenesis in
Smad4 mutant mice. Cytokine Growth Factor Rev 2000, 11:147-157.
47. Munoz NM, Upton M, Rojas A, Washington MK, Lin L, Chytil A, Soz-
men EG, Madison BB, Pozzi A, Moon RT, et al.: Transforming
growth factor beta receptor type II inactivation induces the
malignant transformation of intestinal neoplasms initiated
by Apc mutation. Cancer Res 2006, 66:9837-9844.
48. Plebani M, Basso D, Panozzo MP, Fogar P, Del Favero G, Naccarato
R: Tumor markers in the diagnosis, monitoring and therapy
of pancreatic cancer: state of the art. Int J Biol Markers 1995,
10:189-199.
49. Zbar AP: The immunology of colorectal cancer. Surg Oncol
2004, 13:45-53.
50. Valk-Lingbeek ME, Bruggeman SW, van Lohuizen M: Stem cells and
cancer; the polycomb connection. Cell 2004, 118:409-418.
51. Kim DH, Kim M, Kwon HJ: Histone deacetylase in
carcinogenesis and its inhibitors as anti-cancer agents. J Bio-
chem Mol Biol 2003, 36:110-119.
52. Sansom OJ, Meniel VS, Muncan V, Phesse TJ, Wilkins JA, Reed KR,
Vass JK, Athineos D, Clevers H, Clarke AR: Myc deletion rescues
Apc deficiency in the small intestine. Nature 2007,
446:676-679.
53. Abdel-Rahman WM, Ollikainen M, Kariola R, Jarvinen HJ, Mecklin JP,
Nystrom-Lahti M, Knuutila S, Peltomaki P: Comprehensive char-
acterization of HNPCC-related colorectal cancers reveals
striking molecular features in families with no germline mis-
match repair gene mutations. Oncogene 2005, 24:1542-1551.
54. Kho AT, Zhao Q, Cai Z, Butte AJ, Kim JY, Pomeroy SL, Rowitch DH,
Kohane IS: Conserved mechanisms across development and
tumorigenesis revealed by a mouse development perspec-
tive of human cancers. Genes Dev 2004, 18:629-640.
55. Lepourcelet M, Tou L, Cai L, Sawada J, Lazar AJ, Glickman JN, Wil-
liamson JA, Everett AD, Redston M, Fox EA, et al.: Insights into
developmental mechanisms and cancers in the mammalian
intestine derived from serial analysis of gene expression and
study of the hepatoma-derived growth factor (HDGF). Devel-
opment 2005, 132:415-427.
56. Lee JS, Chu IS, Mikaelyan A, Calvisi DF, Heo J, Reddy JK, Thorgeirsson
SS: Application of comparative functional genomics to iden-
tify best-fit mouse models to study human cancer. Nat Genet
2004, 36:1306-1311.
57. Haigis KM, Hoff PD, White A, Shoemaker AR, Halberg RB, Dove WF:
Tumor regionality in the mouse intestine reflects the mech-
anism of loss of Apc function. Proc Natl Acad Sci USA 2004,
101:9769-9773.
58. Mithani SK, Balch GC, Shiou SR, Whitehead RH, Datta PK, Beau-
champ RD: Smad3 has a critical role in TGF-beta-mediated
growth inhibition and apoptosis in colonic epithelial cells. J
Surg Res 2004, 117:296-305.
59. GEO [ />60. VUMC: Protocols. 2006 [ />expr/protocol.vmsr].
61. MGI TJL: Mouse Genome Informatics; curated mouse-human