Báo cáo y học: "Cell-specific microarray profiling experiments reveal a comprehensive picture of gene expression in the C. elegans nervous system" ppsx
Bạn đang xem bản rút gọn của tài liệu. Xem và tải ngay bản đầy đủ của tài liệu tại đây (1.76 MB, 32 trang )
Genome Biology 2007, 8:R135
comment reviews reports deposited research refereed research interactions information
Open Access
2007Von Stetinaet al.Volume 8, Issue 7, Article R135
Research
Cell-specific microarray profiling experiments reveal a
comprehensive picture of gene expression in the C. elegans nervous
system
Stephen E Von Stetina
¤
*
, Joseph D Watson
¤
†
, Rebecca M Fox
*‡
,
Kellen L Olszewski
*§
, W Clay Spencer
*
, Peter J Roy
¶
and
David M Miller III
*†
Addresses:
*
Department of Cell and Developmental Biology, Vanderbilt University, Nashville, TN 37232-8240, USA.
†
Graduate Program in
Neuroscience, Center for Molecular Neuroscience, Vanderbilt University, Nashville, TN 37232-8548, USA.
‡
Department of Cell Biology, Johns
Hopkins School of Medicine, Baltimore, MD 21205, USA.
§
Department of Molecular Biology, Lewis-Sigler Institute for Integrative Genomics,
Princeton University 246 Carl Icahn Laboratory, Princeton NJ 08544, USA.
¶
Department of Medical Genetics and Microbiology, Donnelly
Centre for Cellular and Biomolecular Research, University of Toronto, Toronto, ON, M5S 1A, Canada.
¤ These authors contributed equally to this work.
Correspondence: David M Miller. Email:
© 2007 Von Stetina et al.; licensee BioMed Central Ltd.
This is an open access article distributed under the terms of the Creative Commons Attribution License ( which
permits unrestricted use, distribution, and reproduction in any medium, provided the original work is properly cited.
Expression in worm neurons<p>A novel strategy for profiling <it>Caenorhabditis elegans </it>cells identifies transcripts highly enriched in either the embryonic or larval <it>C. elegans </it>nervous system, including 19 conserved transcripts of unknown function that are also expressed in the mamma-lian brain.</p>
Abstract
Background: With its fully sequenced genome and simple, well-defined nervous system, the nematode Caenorhabditis
elegans offers a unique opportunity to correlate gene expression with neuronal differentiation. The lineal origin, cellular
morphology and synaptic connectivity of each of the 302 neurons are known. In many instances, specific behaviors can
be attributed to particular neurons or circuits. Here we describe microarray-based methods that monitor gene
expression in C. elegans neurons and, thereby, link comprehensive profiles of neuronal transcription to key
developmental and functional properties of the nervous system.
Results: We employed complementary microarray-based strategies to profile gene expression in the embryonic and
larval nervous systems. In the MAPCeL (Microarray Profiling C. elegans cells) method, we used fluorescence activated cell
sorting (FACS) to isolate GFP-tagged embryonic neurons for microarray analysis. To profile the larval nervous system,
we used the mRNA-tagging technique in which an epitope-labeled mRNA binding protein (FLAG-PAB-1) was
transgenically expressed in neurons for immunoprecipitation of cell-specific transcripts. These combined approaches
identified approximately 2,500 mRNAs that are highly enriched in either the embryonic or larval C. elegans nervous
system. These data are validated in part by the detection of gene classes (for example, transcription factors, ion channels,
synaptic vesicle components) with established roles in neuronal development or function. Of particular interest are 19
conserved transcripts of unknown function that are also expressed in the mammalian brain. In addition to utilizing these
profiling approaches to define stage-specific gene expression, we also applied the mRNA-tagging method to fingerprint
a specific neuron type, the A-class group of cholinergic motor neurons, during early larval development. A comparison
of these data to a MAPCeL profile of embryonic A-class motor neurons identified genes with common functions in both
types of A-class motor neurons as well as transcripts with roles specific to each motor neuron type.
Conclusion: We describe microarray-based strategies for generating expression profiles of embryonic and larval C.
elegans neurons. These methods can be applied to particular neurons at specific developmental stages and, therefore,
provide an unprecedented opportunity to obtain spatially and temporally defined snapshots of gene expression in a
simple model nervous system.
Published: 5 July 2007
Genome Biology 2007, 8:R135 (doi:10.1186/gb-2007-8-7-r135)
Received: 16 April 2007
Revised: 13 June 2007
Accepted: 5 July 2007
The electronic version of this article is the complete one and can be
found online at />R135.2 Genome Biology 2007, Volume 8, Issue 7, Article R135 Von Stetina et al. />Genome Biology 2007, 8:R135
Background
The nematode Caenorhabditis elegans is a widely used model
system for developmental studies. The major tissues of com-
plex metazoans, (muscle, intestine, nervous system, skin, and
so on) are represented in the worm, but the entire animal is
composed of fewer than 1,000 somatic cells. Owing to this
simplicity and to the rapid development of the C. elegans
body plan, the anatomy of every adult cell has been described
and the patterns of division giving rise to each one are known
[1,2]. The C. elegans genome is fully sequenced [3,4] and
encodes over 20,000 predicted genes. Thus, C. elegans offers
a unique opportunity to identify specific combinations of
genes that define the differentiation and structure of specific
cell types. In principle, microarray profiles can provide this
information. In order to implement this strategy, however,
the small size of C. elegans (length = 1 mm) has required the
development of specialized methods for extracting mRNA
from specific cell types. In one approach, MAPCeL (micro-
array profiling of C. elegans cells), green-fluorescent protein
(GFP)labeled cells are isolated by fluorescence activated cell
sorting (FACS) from preparations of dissociated embryonic
cells [5]. This method has now been used to profile global
gene expression in specific subsets of neurons and muscle
cells [5-10] (RMF, DMM, unpublished data). An alternative
technique, mRNA-tagging [11], can be utilized to profile larval
cells, which are not readily accessible for FACS [12]. In this
approach, an epitopetagged mRNA binding protein (FLAG-
PAB) is expressed transgenically with a specific promoter
(Figure 1). FLAG-PAB-bound transcripts are then immuno-
precipitated for microarray analysis. mRNA-tagging profiles
have been reported for two major tissues, body wall muscles
and the intestine [11,13].
Here we apply the MAPCeL and mRNA-tagging strategies to
provide a comprehensive picture of gene expression in the
embryonic and larval nervous systems. This analysis reveals
approximately 2,500 transcripts that are significantly ele-
vated in neurons versus other C. elegans cell types during
these developmental periods. The enrichment in these data-
sets of transcripts known to be expressed in neurons, as well
as newly created GFP reporters from previously uncharacter-
ized genes in these lists, confirmed the tissue specificity of our
results. The 'pan-neural' transcripts detected in these data-
sets encode proteins with a wide array of molecular functions,
including ion channels, neurotransmitter receptors and tran-
scription factors. Overall, 56% of these C. elegans genes are
conserved in humans. The discovery of 27 uncharacterized
human homologs enriched in both embryonic and larval neu-
rons suggests that these profiles have uncovered novel genes
with potentially conserved function in the nervous system.
In order to identify transcripts that are selectively expressed
in a specific neural cell type, we used the mRNA-tagging strat-
egy to fingerprint a subset of motor neurons (A-class) in the
ventral nerve cord of L2 stage larvae. This A-class dataset
contains around 400 significantly enriched genes. Approxi-
mately 25% of these transcripts are not detected in the profile
of the entire nervous system. This finding suggests that indi-
vidual neurons may express rare transcripts that are likely to
be restricted to specific neuron types. The application of the
mRNA-tagging strategy to profile a specific class of larval
neurons complements earlier work in which this method was
used to profile larval ciliated neurons [14] and also experi-
ments in which MAPCeL and other FACS-based approaches
have been applied to selected embryonic neurons [5-10].
Thus, this work demonstrates the utility of complementary
profiling strategies that can now be applied to catalog gene
expression in specific C. elegans neurons throughout
development.
Results
Neuronal mRNA-tagging yields reproducible
microarray expression profiles
To profile gene expression throughout the nervous system, we
generated a stable, chromosomally integrated transgenic line
expressing an epitope-tagged poly-A binding protein
(FLAG::PAB-1) throughout the nervous system. Pan-neuro-
nal expression was confirmed by immunostaining with a
FLAG-specific antibody (Figure 1). We selected the second
larval stage (L2) to test the application of the mRNA-tagging
method. At this stage, the nervous system is largely in place
and should, therefore, express a broad array of transcripts
that define the development and function of most neurons.
Sub-microgram quantities of mRNA isolated by the mRNA-
tagging method were amplified and labeled for application to
an Affymetrix chip representing approximately 90% of pre-
dicted C. elegans genes. Neuron-enriched transcripts in these
samples were detected by comparison to a reference profile of
all larval cells (see Materials and methods). We reasoned that
mRNA-tagging isolates neural specific transcriptsFigure 1 (see following page)
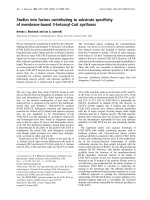
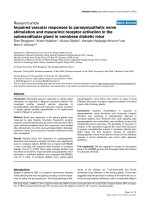
mRNA-tagging isolates neural specific transcripts. (a) The mRNA-tagging strategy for profiling gene expression in the C. elegans nervous system. A pan-
neural promoter drives expression of FLAG-tagged poly-A binding protein (F25B3.3::FLAG-PAB-1) in neurons (black). Native PAB-1 is ubiquitously
expressed in all cells (gray). Neural-specific transcripts are isolated by coimmunoprecipitation with anti-FLAG antibodies (artwork courtesy of Erik
Jorgensen). (b) Immunostaining detects FLAG::PAB-1 expression in neurons in head and tail ganglia (red arrows), ventral nerve cord motor neurons (red
arrowheads), and touch neurons (white arrow). Lateral view of L2 larvae. Anterior to left. (c) Close-up view of posterior ventral cord (boxed area in (b)),
showing anti-FLAG staining (red) in cytoplasm surrounding motor neuron nuclei (for example, AS9, DD5, and so on) stained with DAPI (blue). Note that
hypodermal blast cells (P9p and P10p) do not show anti-FLAG staining. Anterior is left, ventral is down. Scale bars = 10 μm.
Genome Biology 2007, Volume 8, Issue 7, Article R135 Von Stetina et al. R135.3
comment reviews reports refereed researchdeposited research interactions information
Genome Biology 2007, 8:R135
Figure 1 (see legend on previous page)
AAAAA
PAB-1
FLA
G
AAAAA
PAB-1
VA10
DB7
VB11
DA7
AS10
VD11
VA11
DD5
AS9
VD10
p9.p
p10.p
(a)
(b)
(c)
R135.4 Genome Biology 2007, Volume 8, Issue 7, Article R135 Von Stetina et al. />Genome Biology 2007, 8:R135
this approach should detect a significant fraction of known
neuronal transcripts and thus provide an initial test of the
specificity of this strategy.
Comparisons of independently derived datasets for both the
experimental (larval pan-neural) and reference samples
showed that individual replicates for each condition are
highly reproducible (Figure 2a,b). For example, an average
coefficient of determination (R
2
) of approximately 0.96 was
calculated from pairwise combinations of each individual ref-
erence dataset (Figure 2d). The pan-neural datasets were
similarly reproducible (R
2
of approximately 0.96; Figure 2e).
The overall concurrence of these data is graphically illus-
trated in the scatter plots shown in Figure 2a,b.
Transcripts detected by neuronal mRNA-tagging are
expressed in neurons
Scatter plots comparing larval pan-neural versus reference
data revealed a substantial number of transcripts with signif-
icant differences in hybridization intensities (Figure 2c). Sta-
tistical analysis detected 1,562 transcripts with elevated
expression (≥ 1.5-fold, ≤ 1% false discovery rate (FDR)) in the
larval pan-neural sample (Additional data file 1). Strikingly,
we found that 92% of the 443 genes with known expression
patterns included in the larval pan-neural enriched dataset
(409/443) are listed in WormBase [15] as neuronally
expressed (Figure 3a; Additional data file 1). By contrast, only
57% of all genes (1,612/2,837) with defined expression pat-
terns in WormBase are annotated as expressed in neurons
(see Materials and methods; Figure 3a; Additional data files 2
and 3). Moreover, genes with key roles in neuronal function
are highly represented in this list. For example, 55 transcripts
encoding ion channels, receptors or membrane proteins with
known expression in the C. elegans nervous system are
enriched (Figure 3b; Additional data file 7). The enrichment
of transcripts known to be expressed in neurons demon-
strates that the larval pan-neural profile is largely derived
from neural tissue. This conclusion is also substantiated by
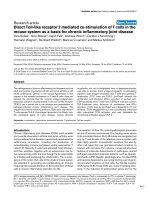
Microarray profiles reveal transcripts enriched in C. elegans neuronsFigure 2
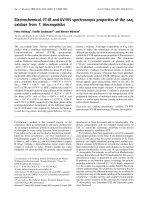
Microarray profiles reveal transcripts enriched in C. elegans neurons. (a) Scatter plot of intensity values (log base 2) for representative hybridization
(DMW32; red) of RNA isolated from all larval cells (reference) by mRNA-tagging compared to the average intensity of the reference dataset (green). (b)
Scatter plot of a representative larval pan-neural hybridization (DMW33; red) compared to the average intensities for all three larval pan-neural
hybridizations (green). (c) Results of a single larval pan-neural hybridization (DMW33; red) compared to average reference intensities (green) to identify
differentially expressed transcripts. Known neural genes snb-1 (synaptobrevin, all neurons), unc-17 (VAChT, cholinergic neurons), and unc-47 (VGAT,
GABAergic neurons) are enriched (red). Depleted genes include two muscle-specific transcripts (unc-15, paramyosin, and tni-3, troponin) and a germline-
specific gene (him-3) (green). (d,e) Pairwise comparisons of individual hybridizations. Coefficient of determination (R
2
) values for all pairwise combinations
of reference hybridizations (d) and for all pairwise combinations of larval pan-neural hybridizations (e) indicate reproducible results for both reference and
experimental samples.
DMW32
DMW33
Average reference
Average larval pan-neural
R
2
= 0.98
R
2
= 0.98
Average reference
+
+
+
+
+
+
snb-1
unc-17
unc-47
him-3
tni-3
unc-15
R
2
= 0.88
DMW15 DMW20 DMW21 DMW32
DMW15
DMW20 0.97
DMW21 0.96 0.98
DMW32 0.95 0.97 0.96
DMW41 0.95 0.97 0.97 0.97
DMW33 DMW42
DMW33
DMW42 0.95
DMW43 0.95 0.98
(a) (b)
(c)
(d) Reference hybridizations (e) Larval pan-neural hybridizations
Genome Biology 2007, Volume 8, Issue 7, Article R135 Von Stetina et al. R135.5
comment reviews reports refereed researchdeposited research interactions information
Genome Biology 2007, 8:R135
the finding that mRNAs highly expressed in other cell types
are preferentially excluded from this dataset (Figure 2c). For
example, microarray profiling experiments identified a total
of 1,926 transcripts enriched in either larval germline, muscle
or intestinal cells (GMI; Additional data file 5) [13]. This set
of genes is significantly under-represented (97/1,562) in the
larval pan-neural dataset (representation factor 0.6, p <
2.033e
-9
; a representation factor <1 indicates under-repre-
sentation; see Materials and methods). Of the 97 genes that
intersect our larval pan-neural profile and the GMI set, 35
have a previously characterized spatial expression pattern. Of
these, 89% (31/35) are also expressed in neurons. A compar-
ison of the top 50 most significantly enriched transcripts in a
MAPCeL profile of embryonic body wall muscle cells (RMF,
DMM, unpublished data) detected only four transcripts that
also show elevated expression in the larval pan-neural profile
(Figure 4a; Additional data file 6). Independent results have
confirmed that at least one of these, the acetylcholine recep-
tor subunit acr-16, is expressed in both muscle and neurons
[16,17]. The apparent low frequency of false positives empiri-
cally defined by these comparisons is consistent with the esti-
mated FDR of ≤ 1% for this dataset. The stringent exclusion of
non-neuronal transcripts has been achieved, however, while
retaining sensitivity to transcripts that may be expressed in
limited numbers of neurons (Figure 5). For example, our
methodology identifies genes that are expressed in only two
neurons; daf-7 (transforming growth factor (TGF)-beta-like
peptide expressed in ASIL and ASIR) [18] and gcy-8 (guan-
ylate cyclase expressed in AFDL and AFDR) [19] (Figure 5).
The strong enrichment of known neuronal genes in the larval
pan-neural dataset indicates that other previously uncharac-
terized transcripts in this list are also likely to be expressed in
the nervous system. To test this prediction, we evaluated GFP
reporter genes for representative transcripts in this profile. As
shown in Table 1 and Additional data file 17, all but one of the
transgenic lines (24 of 25) derived from these promoter GFP
fusions show expression in neurons (Figure 6). Of the GFP
reporters tested, 56% (14/25) are exclusively detected in neu-
rons (Additional data file 17). For example, the stomatin gene
sto-4 is highly expressed in ventral cord motor neurons, touch
neurons and in head and tail ganglia (Table 1; Figure 6d,h).
Our GFPreporter analysis demonstrates that the remaining 11
genes tested are expressed in other tissues in addition to neu-
rons. For instance, the GFP reporter for C04E12.7 (phosphol-
ipid scramblase), which is expressed widely throughout the
nervous system, is also expressed in muscle cells (Table 1;
Figure 6c). Thus, these results indicate that the genes identi-
fied in the larval pan-neural profile largely fall into two
classes; those that are exclusively expressed in neurons, and
those that are expressed in multiple tissues, including neu-
rons. Our finding of neuronal GFP expression for transcripts
exhibiting a wide range of enrichment (1.5- to 8.3-fold) pre-
dicts that most of the genes in this list that have not been
directly tested are also likely to be expressed in neurons.
Together, these results demonstrate that our pan-neural
mRNA-tagging approach enriches for bona fide neuronally
expressed transcripts and effectively excludes transcripts
expressed exclusively in other tissues.
Gene families enriched in neurons of C. elegans larvae
Protein-encoding genes in the enriched larval pan-neural
profile were organized into groups on the basis of KOGs and
other descriptions that identify functional or structural cate-
gories (Table 2; Additional data file 4) [20]. Over half (880/
1,562) are homologous to proteins in at least one other widely
diverged eukaryotic species (that is, KOGs and TWOGs), 49 of
which are classified as uncharacterized conserved proteins.
Homologs for an additional 225 pan-neural enriched proteins
are limited to other nematode species (that is, LSEs).
Transcripts encoding proteins with fundamental roles in neu-
ronal activity or signaling are highly represented in this data-
set (for a comprehensive list see Additional data file 4). For
example, in addition to the 34 synaptic vesicle (SV) associated
transcripts from Figure 3b (Additional data file 7), transcripts
for 19 proteins with potential roles in synaptic vesicle func-
tion are identified (Figure 7). These include six members of
the synaptotagmin family of calcium-dependent phospholi-
pid binding proteins (snt-1, snt-4, snt-5, snt-6, DH11.4,
T10B10.5), only one of which, snt-1, has been previously
shown to function in neurons [21]. Expression of the addi-
tional synaptotagmin genes in the nervous system may
account for the residual synaptic vesicle function of snt-1
mutants [21]. Three members of the copine family (B0495.10,
tag-64, T28F3.1), a related group of calciumbinding proteins
with potential roles in synaptic vesicle fusion (listed as part of
endocytosis machinery in Figure 7), are also enriched [22].
In addition to genes with general functions in synaptic vesicle
signaling, the larval pan-neural profile includes transcripts
encoding proteins with roles specific to particular neuro-
transmitters. For example, the plasma membrane and vesic-
ular transporters for choline and acetylcholine (cho-1 and
unc-17), GABA (snf-11 and unc-46, unc-47), dopamine (dat-1
and cat-1), and glutamate (glt-3 and eat-4) are included (Fig-
ure 7) [23-27]. The corresponding families of neurotransmit-
ter-specific ligand-gated ion channels are highly represented,
including 22 members of the ionotropic nicotinic acetylcho-
line (ACh) receptor family (Additional data file 4). Other
classes of ion channels with key neural functions are also
abundant, such as potassium channels (24), voltage-gated
calcium channels (10) and DEG/ENaC sodium channels (10)
(Table 2).
The wide range of neurotransmitter-specific genes in the lar-
val pan-neural dataset reflects the diverse array of neuron
types in C. elegans (Figure 5). This point is underscored by
the detection of a large number of transcription factors with
established roles in neuronal specification (Table 3). These
include UNC-86, the POU homeodomain protein that regu-
lates the differentiation of a broad cross-section of neuron
R135.6 Genome Biology 2007, Volume 8, Issue 7, Article R135 Von Stetina et al. />Genome Biology 2007, 8:R135
Figure 3 (see legend on next page)
0
25
50
75
100
Percentage neuronal calls
EM EP LP EA LA WB
41%
82%
92%
73%
89%
57%
(a)
(b)
Axon guidance 8
Neuropeptides 49
Other 82
GPCR signaling 51
Ion channel/Receptor/Membrane
Protein 55
Cytoskeleton 20
Enzyme 19
Kinase/phosphatase 25
Adhesion/Ig Domain 14
Transcriptional control 39
glr-5
dat-1
F10E7.9
sol-1
des-2
glr-1
F08A10.1a
R13A5.9
mtd-1
glr-4
deg-3
nmr-2
twk-29
inx-4
mec-2
glc-4
unc-2
mod-1
clh-2
cho-1
Ionotropic glutamate receptor
Dopamine transporter
Na+/K+ symporter
CUB domain protein
nAChR
Ionotropic glutamate receptor
Ca++ activated K+ channel
Predicted transporter
Novel transmembrane protein
Ionotropic glutamate receptor
nAChR
Ionotropic glutamate receptor
Twik K+ channel
Innexin
Stomatin
Glutamate gated chloride channel
Calcium channel
Ligand-gated ion channel
Chloride channel
Choline transporter
8.8
6.7
5.8
5.5
4.2
4.2
3.9
3.9
3.8
3.4
3.2
3.2
3.0
3.0
2.9
2.9
2.9
2.9
2.9
2.8
Gene Description Fold change
RNA binding 4
Calcium binding 9
Synaptic vesicle associated 34
Genome Biology 2007, Volume 8, Issue 7, Article R135 Von Stetina et al. R135.7
comment reviews reports refereed researchdeposited research interactions information
Genome Biology 2007, 8:R135
classes [28-30], as well as transcription factors that define
specific neuronal subtypes, such as the canonical LIM
homeodomain MEC-3 (mechanosensory neurons) [31-33]
and the UNC-4 homeodomain (A-class ventral cord motor
neurons, see below) [34-37]. Transcription factors with unde-
fined roles in the nervous system are also identified. Of par-
ticular note are 15 members of the nuclear hormone receptor
(NHR) family, only one of which, fax-1, has been previously
shown to regulate neuronal differentiation [38].
A striking example of the power of this profiling approach is
revealed by strong enrichment for genes involved in peptider-
gic signaling. Neuropeptides are potent modulators of synap-
tic transmission. A combination of genetic and
pharmacological experiments have assigned specific neuro-
modulatory roles to FMRFamide and related peptides
(FaRPs) encoded by members of the 'flp' (FMRFamide like
peptides) gene family [39]. Examples include flp-13 (cell
excitability)[40], flp-1 (locomotion) [41] and flp-21 (feeding
behavior) [42]. The enriched status of the majority of flp
genes (20/23) in the larval pan-neural profile (Figure 4b) par-
allels immunostaining and GFP reporter results showing
expression of this gene family in the C. elegans nervous sys-
tem [43]. Transcripts encoding insulin-like peptides (ins) and
neuropeptide-like genes (nlp) are among the most highly
enriched mRNAs in the pan-neural dataset (Additional data
file 4). Neuropeptide activating proteases such as the propro-
tein convertase egl-3 and the carboxypeptidase egl-21 are also
elevated [44]. Finally, we detect 136 members of the G-pro-
tein coupled receptor (GPCR) family, including four GPCRs
(npr-1, npr-2, npr-3 and T19F4.1) that have been either
directly identified as neuropeptide receptors or implicated in
neuropeptide-dependent behaviors [42,45,46] (E Siney, A
Cook, N Kriek, L Holden Dye, personal communication). The
strong representation of diverse neuropeptidergic
components in the larval pan-neural profile is suggestive of a
nervous system that is richly endowed with complex signaling
pathways for modulating function and behavior.
Embryonic and larval nervous systems express many
common sets of genes
To complement the profile of the larval nervous system
obtained by the mRNAtagging method, a pan-neural GFP
reporter gene [47] (J Culotti, personal communication) was
used to mark embryonic neurons for MAPCeL analysis. GFP
labeled neurons were isolated by FACS to ≥ 90% purity from
primary cultures of embryonic cells (see Materials and meth-
ods). Comparisons of independent replicates showed that
these data are highly reproducible (Additional data file 8). We
identified 1,637 enriched genes (≥ 1.5-fold, FDR ≤ 1%) versus
a reference dataset obtained from all embryonic cells (Addi-
tional data file 1). The majority (82%) of transcripts in this list
with known expression patterns are expressed in neurons
(Figure 3a). All of the promoter-GFP fusions (10/10) created
from previously uncharacterized genes in the enriched
embryonic pan-neural dataset showed expression in neurons,
further validating this MAPCeL profile (Table 1; Additional
data file 17). A comparison of the embryonic (MAPCeL) and
larval (mRNA-tagging) profiles reveals considerable overlap,
with approximately 45% of transcripts (710/1,637; represen-
tation factor 5.2, p < 1e
-325
) enriched in the embryonic neu-
rons also elevated in larval neurons (Figure 8a). The
intersection of these two datasets is significantly enriched
(96%) for known neuron-expressed genes. The high likeli-
hood of neural expression for these transcripts is underscored
by our finding that a set of approximately 240 candidate neu-
ral genes originally identified as including a presumptive pan-
neural regulatory motif ('N1 box') are overrepresented (35%,
representation factor 2.6, p < 4.1e
-17
) in this subset of pan-
neural transcripts [48].
As an additional test of the similarities between these inde-
pendent datasets, we examined the embryonic and larval
pan-neural profiles for elevated expression of gene families
with roles in synaptic vesicle function (Figure 7a). Both the
embryonic and larval pan-neural datasets were enriched for
many of these components. In contrast, the majority of these
transcripts are not upregulated in a MAPCeL profile of
embryonic muscles (RMF, DMM, unpublished data). Inter-
estingly, the one exception to this correlation, the GABA
transporter snf-11, is known to be expressed in body wall
muscle in addition to neurons [26].
Examination of the embryonic and larval pan-neural datasets
confirmed expression of genes that regulate the dauer path-
way in C. elegans neurons. The dauer larva adopts an alterna-
tive developmental program to withstand stressful conditions
(for instance, starvation, overcrowding, high temperature).
The decision to adopt the dauer state is regulated by the nerv-
ous system and is triggered during the L1/L2 transition in
response to environmental cues [49-54]. Figure 9 graphically
represents the dauer pathway genes identified in the com-
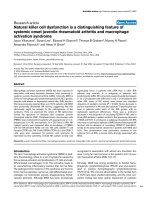
Microarray profiles detect known C. elegans neural genesFigure 3 (see previous page)
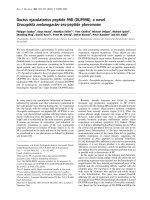
Microarray profiles detect known C. elegans neural genes. (a) Histogram showing fraction of annotated genes in microarray datasets with known in vivo
expression in neurons. The list of annotated genes used for this comparison includes all genes with known cellular expression patterns listed in WormBase
(see Materials and methods). Note significant enrichment for neuronal genes in microarray datasets obtained from neurons (73-92%) relative to the
fraction of all annotated genes in WormBase (57%) and embryonic muscle (41%) that show some expression in the nervous system. Microarray datasets
are: EM, embryonic muscle; EP, embryonic pan-neural; LP, larval pan-neural; EA, embryonic A-class motor neuron; LA, larval A-class motor neuron; WB,
WormBase. (b) The larval pan-neural enriched dataset contains 443 transcripts previously annotated as expressed in neurons in WormBase. Genes were
grouped according to functional categories characteristic of neurons. The top 20 enriched ion channel/receptor/membrane proteins are featured
(Additional data file 7).
R135.8 Genome Biology 2007, Volume 8, Issue 7, Article R135 Von Stetina et al. />Genome Biology 2007, 8:R135
Figure 4 (see legend on next page)
Normalized intensity (log value)
EM EP LP EA LA
(a) Top 50 muscle-enriched genes
Normalized intensity (log value)
EM EP LP EA LA
(b) FRMFamide-like peptides
Depleted
Enriched
Unchanged
0.01
0.1
1
10
100
0.1
1
10
100
acr-16
0.01
0.1
1
10
100
0.01
0.1
1
10
100
flp-13
Genome Biology 2007, Volume 8, Issue 7, Article R135 Von Stetina et al. R135.9
comment reviews reports refereed researchdeposited research interactions information
Genome Biology 2007, 8:R135
bined pan-neural datasets. Of particular note is a conserved
insulin-dependent signaling pathway (for example, age-1/
PI3Kinase) that also regulates lifespan in C. elegans and in
other species [28].
Transcription factors constitute the largest gene family that is
differentially enriched between the embryonic and larval
pan-neural profiles (Table 3). For example, the combined
pan-neural datasets detect a total of 30 NHRs. However, 16
NHRs are exclusively detected in embryonic neurons,
whereas only six are enriched solely in larval neurons. Home-
odomain transcription factors are also unequally distributed
across the two datasets. Of 32 enriched homeoproteins, 24
are exclusive to the larval pan-neural profile, whereas only 4
are selectively elevated in the embryonic pan-neural dataset
(Table 3). The relative lack of enrichment of homeodomain
mRNAs in the embryonic pan-neural profile was initially
surprising given strong genetic evidence for the widespread
role of the members of this transcription factor class in
embryonic neural development [31,47,55-57]. A likely expla-
nation for this finding is that many homeobox transcripts are
dynamically expressed in multiple cell types in the embryo
but are increasingly restricted to neurons during larval devel-
opment [56,58]. This view is consistent with our observation
that a majority (22/28) of homeodomain genes that are
enriched in the larval pan-neural dataset are in fact also
detected as expressed genes in the embryonic pan-neural pro-
file (see below).
Homologs of C. elegans neural genes are expressed in
the mammalian brain
Over half of the enriched transcripts identified in the embry-
onic and larval pan-neural profiles have likely homologs in
mammals (Additional data file 1). A substantial fraction of
these transcripts encodes members of protein families with
conserved roles in neural function or development (for
instance, synaptic vesicle proteins; Figure 7b). We also iden-
tified neuron-enriched transcripts from C. elegans that are
conserved but have largely undefined in vivo biochemical
functions. For example, of the 711 transcripts that are
enriched in both the embryonic and larval pan-neural data-
sets (Figure 8a), 27 encode uncharacterized conserved
proteins (Additional data file 9). To determine if these tran-
scripts are also detected in the mammalian brain, we queried
the Allen Brain Atlas [59], which catalogs in situ hybridiza-
tion results for 20,000 mouse transcripts (see Materials and
methods). Of the 27 uncharacterized conserved genes from C.
elegans, 26 have mouse homologs and 25 are included in the
Allen Brain Atlas. We find that 76% (19/25) of these genes are
detected in the mouse brain and, therefore, suggest that neu-
ral functions for these genes are likely conserved from nema-
todes to mammals. For instance, one member of this group of
genes, osm-12, is the C. elegans homolog of a human disease
gene, BBS7. Bardet-Biedle syndrome (BBS; OMIM 209900)
is a rare, pleiotropic disorder with multiple pathologies (obes-
ity, rod-cone dystrophy, cognitive impairment) [60]. At least
12 genes (BBS1-12) have been linked to this disease [61]. osm-
12 and other BBS genes are highly expressed in ciliated neu-
rons in C. elegans and genetic studies suggest key roles in
intraflagellar transport [62]. These findings and additional
work in other systems have led to the hypothesis that basal
body dysfunction could be the root cause of BBS [63-66].
Thus, we propose that genetic studies in C. elegans of other
uncharacterized conserved genes detected in the pan-neural
enriched profile may be instructive.
The C. elegans interactome identifies neuronal genes
potentially involved in synaptic function
The C. elegans interactome documents approximately 5,500
protein-protein interactions derived from yeast two-hybrid
results, from interologs (that is, interactions between protein
homologs in other species) and from functional interactions
described in the literature [67]. To gain insight into the func-
tional significance of prospective neural genes identified by
these microarray datasets, we looked for evidence of interac-
tions among proteins encoded by these genes in the Interac-
tome database (see Materials and methods). The 711
transcripts enriched in both the embryonic and larval pan-
neural datasets were uploaded for this analysis (Figure 8a).
This search generated an interaction map with a single prom-
inent cluster. Most of the transcripts in this group (30/34) are
detected in at least one of the pan-neural datasets (Figure 10).
Our finding that the majority of genes in this interactome
group are expressed in the nervous system favors the idea
that these networks reflect authentic interactions in neurons.
We note that 13 of the proteins in this list (yellow circles in
Figure 10) have not been previously assigned to the nervous
system. Annotation of this interactome map with functional
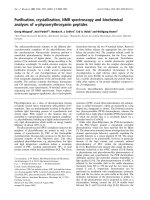
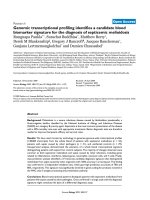
Neuropeptides are highly represented in profiles of neural cells while transcripts highly enriched in body wall muscle are excludedFigure 4 (see previous page)
Neuropeptides are highly represented in profiles of neural cells while transcripts highly enriched in body wall muscle are excluded. Line graphs display log
base 10 of relative intensity values (experimental/reference) for selected genes on the C. elegans Affymetrix array (see Materials and methods). Vertical
lines correspond to individual replicates for each experimental sample. Thus, trends in expression levels for a particular gene or sets of genes can be
visualized across all datasets. EM, embryonic muscle; EP, embryonic pan-neural; LP, larval pan-neural; EA, embryonic A-class motor neuron; LA, larval A-
class motor neuron. Horizontal lines are colored (see heat map at right) according to relative enrichment of a single LP replicate (vertical white line with
arrowheads): enriched (red), blue (depleted) and yellow (no change). (a) The top-50 ranked genes from embryonic muscle show limited enrichment in
neuronal datasets. One exception is acr-16, marked by the horizontal green line, which is highly enriched in the LP dataset. acr-16 encodes a nicotinic
acetylcholine receptor that is expressed in both muscle cells and neurons [16,17]. (b) FRMFamide-like peptides (flp) are enriched in neurons. A majority
(20/23) of the 23 defined flp transcripts is enriched in the LP dataset, whereas specific subsets of flp transcripts are enriched in other neuronal datasets (EP,
EA, LA) but largely excluded from the muscle (EM) dataset. The horizontal green highlights flp-13, which is the most highly enriched flp transcript in the A-
class motor neuron (EA, LA) datasets.
R135.10 Genome Biology 2007, Volume 8, Issue 7, Article R135 Von Stetina et al. />Genome Biology 2007, 8:R135
data for each corresponding protein revealed two distinct
subclusters featuring roles in either synaptic transmission or
nucleic acid binding. For example, the JIP3/JSAP1 JNK
scaffolding protein, UNC-16, interacts with KLC-2 (kinesin
light chain) to regulate vesicular transport in neurons [68].
Other members of this interacting complex, MKK-4 (MAP
kinase kinase) and JNK-1 (Jun kinase) are also required for
maintaining normal synaptic structure [69,70]. These
findings suggest that additional proteins in this subcluster
may function at the synapse. F43G6.8 (E3 ubiquitin ligase)
and B0547.1 (COP-9 signalosome subunit) are attractive
possibilities as synaptic development and function are regu-
lated by ubiquitin-dependent protein degradation [71]. As
more phenotypic data are compiled, this analysis can be
extended to encompass data derived from RNA interference
(RNAi) experiments, which may yield models for molecular
machines that function in neurons [72].
An mRNA-tagging transcriptional profile of a small
subset of neurons
Although our gene expression profiles of the embryonic and
larval nervous systems provide a comprehensive list of
transcripts that function in neurons, these data lack the spa-
tial resolution to identify the specific neurons in which these
transcripts are expressed. For instance, the dopamine
transporter, dat-1, is highly enriched (15.9-fold) in the larval
pan-neural dataset, but dat-1 expression is limited to eight
dopaminergic neurons [73]. Other transcripts that are also
restricted to a small number of neurons, however, might not
be detected in a global profile of the entire nervous system.
For example, the genes gcy-5 and gcy-6 (guanylate cyclase)
are each expressed in single neurons, ASER and ASEL [74],
respectively, and neither is enriched in the larval pan-neural
dataset. The application of the mRNA-tagging strategy to
individual classes of neurons should, therefore, correlate
gene expression with specific neurons as well as detect low
abundance transcripts with potential key functions in these
cells. To test this idea, we used the unc-4 promoter to express
FLAG-PAB-1 in only the subset of neurons in the ventral
nerve cord that express the UNC-4 homeodomain protein. In
the L2 larva, unc-4::GFP and unc-4::LacZ reporters show
strong expression in a total of 18 neurons: VA motor neurons
(12), SAB motor neurons (3), the I5 pharyngeal motor neuron
(1) and AVF interneurons (2) [35,75]. Weaker, sporadic
expression is observed in nine embryonically derived DA
motor neurons at this stage. (unc-4 is strongly expressed in
the DAs in the embryo and in L1 larvae.) To increase the
sensitivity of the mRNA-tagging method for profiling these
Pan-neural datasets detect neuron-specific transcriptsFigure 5
Pan-neural datasets detect neuron-specific transcripts. A representation of transcripts enriched in the larval pan-neural dataset and a subset of the neurons
in which these genes are expressed. (a) Lateral view of an adult worm depicting selected neurons. Ventral is down, anterior is to the left. (b) Close-up of
the adult head, showing the serotonergic neuron NSM and two sensory neurons, AFD and ASI. For simplicity, only one of the two pairs of neurons is
diagrammed. The pharynx is colored green and the anterior end of the intestine is gray. (c) Table displaying representative genes enriched in the larval
pan-neural dataset and expressed in each indicated neuron. Asterisks denote exclusive expression in the listed cell type. (Artwork courtesy of Zeynep
Altun, Chris Crocker and David Hall at WormAtlas [120].)
AVA
ALM
PDE
DA9
DVB
Intestine
Gonad
Embryos
Pharynx
NSM
AFD
ASI
Neuron Gene name Function
AFD gcy-8* Thermosensory
ASI daf-7* Chemosensory
NSM eat-4 Serotonergic
AVA glr-1 Glutamatergic
PDE cat-1 Dopaminergic
DVB unc-25 GABAergic
DA9 unc-17 Cholinergic
ALM mec-2 Mechanosensory
(a)
(b) (c)
Genome Biology 2007, Volume 8, Issue 7, Article R135 Von Stetina et al. R135.11
comment reviews reports refereed researchdeposited research interactions information
Genome Biology 2007, 8:R135
neurons, PAB-1 was labeled with three tandem repeats of the
FLAG epitope (3XFLAG). Figure 11a,b show a mid-L2 larval
animal (NC694) expressing the unc4::3XFLAG::PAB-1 trans-
gene in VA, SAB, and I5 motor neurons and in AVF interneu-
rons; less intense expression is seen in the DA motor neurons.
Because most (24/27) of the neurons in this group are
members of the 'A-class' of ventral cord excitatory motor
neurons (VA, SAB, DA), we will refer to the mRNA-tagging
data obtained from this transgene as the 'larval A-class motor
neuron' profile (Figure 9).
As previously observed for the larval pan-neural data (Figure
2), independent hybridizations resulted in highly reproduci-
ble data for the larval A-class motor neuron profile (Addi-
tional data file 8). A comparison of the A-class hybridization
data to the reference sample of mRNA from the average larval
cell detected 412 enriched genes (see Materials and methods).
Of the 114 genes in this list with known expression patterns,
102 (approximately 90%) are found in neurons (Figure 3a).
Of these genes, 96 have detailed spatial information, and 76
(approximately 80%) of these show annotated expression in
Table 1
Expression of promoter-GFP reporters for transcripts enriched in the embryonic pan-neural, larval pan-neural or A-class motor neuron
datasets
Pan-neural A-class
Cosmid Gene Protein EP fold change LP fold change In neurons* Fold change UNC-4 neuron(s)*
C01G6.4 Predicted E3 ubiquitin ligase 1.8 - √ -VA, DA
VF11C1L.1 ppk-3 PIP kinase 1.8 - √ -VA, DA
C25D7.8 Novel 1.9 - √ -VA, DA
F08G12.1 3.0 - √ -VA, DA
M79.1 abl-1 Abelson kinase 2.3 - √ -VA, DA
F25G6.4 acr-15 Acetylcholine receptor - 4.9 √ -VA, DA
T27A1.6 mab-9 Transcription factor - 1.7 √ -DA
F39G3.8 tig-2 TGF-β -1.8√ -VA, DA
T19C4.5 Novel - 2.0 -
CC4.2 nlp-15 Neuropeptide - 6.5 √ -
C18H9.7 rpy-1 Rapsyn - 2.7 √ -DA
Y71D11A.5 Ligand-gated ion channel 2.1 1.8 √ -
C04E12.7 Phospholipid scramblase - 3.2 √ 1.8 VA, DA
F36A2.4 twk-30 K
+
channel - 2.1 √ 5.1 VA, DA
Y71H9A.3 sto-4 Stomatin - 3.0 √ 1.6 VA
F29G6.2 Novel - 3.2 √ 1.6 VA, DA,SAB, I5, AVF
C44B11.3 mec-12 Alpha-tubulin - 5.9 √ 1.9 VA, DA
T23D8.2 tsp-7 Tetraspanin - 3.5 √ 4.8 VA, DA
T05C12.2 acr-14 Acetylcholine receptor - 1.5 √ 3.1 DA
F33D4.3 flp-13 Neuropeptide - 7.1 √ 7.9 I5
C11D2.6 nca-1 Ca
++
channel - 2.3 √ 2.2 VA, DA
E03D2.2 nlp-9 Neuropeptide - 3.1 √ 2.5 VA
F55C12.4 Novel - 3.5 √ 2.1 DA
F43C9.4 mig-13 CUB domain - 1.8 √ 2.8 VA, DA
F39B2.8 Predicted membrane protein 1.7 3.5 √ 2.1 VA, DA
K02E10.8 syg-1 Ig domain 1.8 1.8 √ 1.8 VA, DA
ZC21.2 trp-1 Ca
++
channel 1.9 2.2 √ 1.9 VA, DA
Y47D3B.2a nlp-21 Neuropeptide 3.9 8.3 √ 3.7 VA, DA
F09C3.2 Phosphatase 1.9 2.7 √ 1.7 VA, DA
T27E9.9 Ligand-gated ion channel 2.3 4.0 √ 3.1
Y34D9B.1 mig-1 Frizzled-like - - √ 1.6 VA, DA
*GFP expression in neurons (check mark), and in A-class motor neurons (DA, VA, SAB, I5). GFP expression was typically determined in L2 larvae.
Full expression patterns can be found in Additional data file 17. Expression patterns for some of these GFP reporters have been previously reported:
T27A1.6, F39G3.8, T19C4.5, CC4.2, C18H9.7, F36A2.4, F29G6.2, T23D8.2, T05C12.2, F33D4.3, C11D2.6, E03D2.2, F55C12.4, F43C9.4, K02E10.8,
ZC21.2, Y47D3B.2a, F09C3.2 [5]; F33D4.3 [43]; CC4.2, E03D2.2 [96]; F36A2.4, [121]; F43C9.4, [122]. Y47D3B.2a, [123].
R135.12 Genome Biology 2007, Volume 8, Issue 7, Article R135 Von Stetina et al. />Genome Biology 2007, 8:R135
regions that also contain UNC4expressing neurons (Addi-
tional data file 1). Of particular note, the native unc-4 tran-
script, which is selectively expressed in these neurons in vivo,
is the most highly enriched (eight-fold) mRNA in this dataset.
Other known A-class motor neuron genes in this list include
the vesicular ACh transporter (VAChT) unc-17 and the Olf/
EBF transcription factor unc-3 (Figure 11c) [75,76]. In con-
trast, transcripts known to be restricted to other cell types,
such as muscle (myo-2, unc-22) or GABAergic neurons (unc-
25), are depleted from the A-class neuronal profile (Figures
4a and 11c). For instance, <2% of transcripts selectively
expressed in larval germ line, intestine, or muscle (30/1926)
are enriched in the larval A-class motor neuron profile (Addi-
tional data file 5) [13].
All of the GFP reporter lines (19/19) constructed for A-class
enriched transcripts (Table 1; Additional data file 17) are
expressed in UNC-4 neurons. For example, in the mid-L2
stage ventral nerve cord, mec-12::GFP is expressed in DA, VA,
VB and VD motor neurons (Figure 6a,e) and syg1::GFP (Ig
domain) is detected in DA and VA motor neurons among oth-
ers (Figure 6g). These results strongly suggest that most of the
genes in the UNC-4 neuron enriched dataset are expressed in
these cells in vivo. Thus, these data indicate that the mRNA-
tagging method can produce a reliable profile of subsets of
neurons in C. elegans.
A subset of pan-neural genes are expressed in larval A-
class motor neurons
Nearly 70% of the larval A-class enriched transcripts (282/
412) are also elevated in the larval pan-neural dataset (repre-
sentation factor 8.2, p < 2.9e
-209
; Additional data file 10). As
expected, genes with known functions in all neurons are
highly represented in this group (Table 2). Synaptic vesicle
associated transcripts that are widely expressed in the nerv-
ous system, such as rab-3 (G-protein), snt-1 (synaptotagmin)
and snb-1 (synaptobrevin), are enriched in both datasets.
Absences from the larval A-class profile are correlated with
class-specific functions in neurons. For example, the 60 tran-
scripts encoding proteins involved in synaptic transmission
enriched in the larval pan-neural dataset include vesicular
transporters for GABA (unc-47), glutamate (glt-3),
dopamine/serotonin (cat-1) and acetylcholine (unc-17) (Fig-
ure 7b) [24]. The selective enrichment of the vesicular ACh
transporter unc-17 in the larval A-class profile is consistent
with the known cholinergic signaling capacity of A-class
motor neurons [75]. In another striking example of neuron-
specific gene expression, the 'mec' genes, which are required
for normal differentiation or function of mechanosensory
neurons, are highly represented in the larval pan-neural
dataset but are not detected in the larval A-class profile (Table
4) [77]. The one exception is the alpha-tubulin encoding gene,
mec-12, for which enriched expression in A-class neurons was
confirmed with a GFP reporter gene (Figure 6a,e). As
described above, most of the known flp genes are enriched in
the pan-neural dataset [39]. A subset of five flp genes is found
in the A-class dataset (flp-2, 4, 5, 12, 13), providing enhanced
spatial resolution for the expression repertoire of this large
family of neuropeptide transmitters (Figure 4b).
The A-class profile includes approximately 130 transcripts
that are not detected in the larval pan-neural dataset (Addi-
tional data file 10). Interestingly, approximately 20% of these
genes (23/127) encode collagen-like proteins for which neural
functions are largely undefined. cle-1, which encodes a type
XVIII collagen, the one member of this protein family that
does have a documented role in the nervous system [78], is
enriched in both the larval pan-neural and A-class datasets.
We speculate that post-embryonic motor neurons may
secrete collagens and other extracellular matrix components
for assembly into the basement membrane that envelopes the
ventral nerve cord [79]. Indeed, our data confirm that UNC-6
(netrin), a critical extracellular matrix signal that steers
migrating cells and neuronal growth cones, is highly
expressed in larval A-class motor neurons (Figure 12) [80].
Comparison of transcripts enriched in embryonic
versus larval A-class motor neurons
We have previously used the MAPCeL strategy to profile
embryonic motor neurons marked with unc-4::GFP [5].
These include 12 embryonic A-class motor neurons (9 DA and
3 SAB) and a single pharyngeal neuron, I5 [5]. The embryonic
A-class motor neurons are similar to the post-embryonic VAs
in that they express unc-4, are cholinergic, extend anteriorly
directed axons, and receive inputs from the command
interneurons AVA, AVD, and AVE [79]. The strong overlap of
these distinct morphological and functional traits as well as
some residual larval expression of unc-4 in embryonic A-class
motor neurons (Figure 11b) are consistent with the observa-
tion that approximately 40% of transcripts enriched in the
larval A-class motor neuron dataset (162/412) are also
elevated in the embryonic A-class motor neuron MAPCeL
profile (representation factor 7.4, p < 3.1e
-99
; Figure 8b; Addi-
tional data file 10). Transcripts from the cholinergic locus,
cha-1 (choline acetyl transferase) and unc-17 (vesicular ACh
transporter), which are essential for the biosynthesis and
GFP reporters validate neuronal microarray datasetsFigure 6 (see following page)
GFP reporters validate neuronal microarray datasets. Transgenic animals expressing GFP reporters for representative genes detected in neuron-enriched
microarray datasets. Anterior to left, ventral down. GFP images are combined with matching DIC micrographs for panels (b-g). (a,e) mec-12::GFP is
expressed in touch neurons (arrow) and in specific ventral cord motor neurons (e) at the L2 stage. (b,c) tsp-7::GFP and C04E12.7::GFP are widely
expressed in the nervous system with bright GFP in head and tail ganglia and in motor neurons of the ventral nerve cord (arrow heads). (d,f,g,h) Note
expression of GFP reporters for sto-4, nca-1, and syg-1 in A-class (DA, VA) and in other ventral cord motor neurons (for example, DB, VB).
Genome Biology 2007, Volume 8, Issue 7, Article R135 Von Stetina et al. R135.13
comment reviews reports refereed researchdeposited research interactions information
Genome Biology 2007, 8:R135
Figure 6 (see legend on previous page)
mec-12::GFP
sto-4::GFP
syg-1::YFP
nca-1::GFP
mec-12::GFP
tsp-7::GFP
C04E12.7::GFP
sto-4::GFP
(a)
(b)
(c)
(d)
(e)
(f)
(g)
(h)
VA10
VB11
VA11
VA10
VB11
DB7 DA7
VA11
VA10
DA7
VA11
VA9
VA10
DB7
R135.14 Genome Biology 2007, Volume 8, Issue 7, Article R135 Von Stetina et al. />Genome Biology 2007, 8:R135
Table 2
Transcripts enriched in C. elegans neurons
Category Embryonic pan-neural Larval pan-neural Embryonic A-class Larval A-class
Ion channels/receptors/membrane proteins 122 156 60 41
Acetylcholine receptors 13 24 9 9
GABA receptors 1 4 3
Glutamate receptors 8 8 1 2
Potassium channels 11 24 8 10
Calcium channels 8 10 7 4
DEG/ENaC channels 3 10 1 1
Stomatins 3 7 2 1
Other ligand-gated ion channels 6 13 2 2
Gap junction proteins (innexins) 4 4 1 1
Symporters/exchangers/transporters 24 27 12 3
Other membrane proteins 41 25 17 5
Axon guidance 4883
Adhesion/Ig domain 6171011
Cytoskeleton-related 33 34 16 5
Transcriptional control 90 91 38 10
Homeobox 8 28 3 3
Hormone receptors 24 15 5 1
Aryl-hydrocarbon receptors 1 3 1
SMADs 311
HMG box 5 5
HLH factors 2 4 1 1
Other transcription factors 32 25 13 4
General factors 18 8 14
Kinase/phosphatase 82 79 51 18
GPCR signaling 107 169 42 25
Genome Biology 2007, Volume 8, Issue 7, Article R135 Von Stetina et al. R135.15
comment reviews reports refereed researchdeposited research interactions information
Genome Biology 2007, 8:R135
G-protein coupled receptors 85 137 33 18
G-proteins 8 10 3 3
Regulators of G-protein signaling (GTPases, GEFs, GRKs) 7 8 4 2
Adenylate/guanylate cyclases 7 14 2 2
Rab/Rho/Rac GTPase signaling 17 7 7 2
Neuropeptides 39 58 11 13
FMRFamide-like (flp) 13 20 4 5
Neuropeptide-like (nlp) 13 18 3 4
Insulin-like 9 11 2 1
TGF-beta 1 3 1 1
Pro-protein convertases 3 6 1 3
Calcium binding 18 26 12 9
Synaptic vesicle associated 38 53 25 17
RNA binding 22 14 22 3
Ubiquitin associated 39 19 12 3
Enzymes 199 103 111 30
Collagens 21524
Other 297 205 174 44
Unnamed/uncharacterized 159 127 161 56
Unclassified 363 395 230 98
Total 1,637 1,562 995 412
Table 2 (Continued)
Transcripts enriched in C. elegans neurons
R135.16 Genome Biology 2007, Volume 8, Issue 7, Article R135 Von Stetina et al. />Genome Biology 2007, 8:R135
packaging of ACh into synaptic vesicles, are enriched in both
A-class motor neuron profiles [24]. In addition to these gene
families, several others are enriched in both embryonic and
larval A-class motor neurons (Additional data file 19). ACh
signaling depends on the synaptic vesicle cycle and genes with
key roles in this mechanism are elevated in both datasets:
these include unc-18, snt-1 (syntaxin), snn-1 (synapsin), ric-4
(SNAP-25), sng-1 (synaptogyrin), unc-2 (calcium channel),
rab-3, and unc-11 (clathrin component). In addition, genes
with either established or likely roles in the G-protein coupled
signaling pathways that modulate ACh release from these
motor neurons (dop-1, pkc-1, kin-2, gar2, rgs-1, rgs-6, gpc-2)
are common to both enriched datasets [5,81]. The general
role of A-class motor neurons in both releasing and respond-
ing to a broad range of neuroactive signals is underscored by
the embryonic and larval enrichment of multiple
neuropeptides (that is, flp-2, flp-4, flp-5, and flp-13) (Figure
4B). Shared ionotropic receptors include the nAChR subu-
nits, acr-12, acr-14 and unc-38, which lead to excitatory
responses, as well as the recently described ACh gated chlo-
ride subunit, acc-4 (T27E9.9), which should mediate acetyl-
choline-induced inhibition of motor neuron activity [82].
Together, these data support the proposal that C. elegans A-
class motor neurons utilize complex mechanisms for integrat-
ing signals originating as either paracrine or autocrine stimuli
[5].
Other transcripts that are highly enriched in both embryonic
and larval A-class datasets with potential roles in specifying
shared characteristics of this motor neuron class include:
syg-1, which encodes an Ig-domain membrane protein that
localizes the presynaptic apparatus of the HSN motor neuron
in the egg laying circuit (Figure 6g) [83]; rig-6, which encodes
the nematode homolog of contactin, a membrane protein
with extracellular fibronectin and Ig domains that organizes
ion channel assemblages [84,85]; and cdh-11, which encodes
the homolog of calsyntenin, a novel cadherin-like molecule
that is highly localized to postsynaptic sites [86]. Finally, we
note that of the 25 genes that encode innexin gap junction
components [87], only one, unc-9
, is enriched in both of the
A-class motor neuron datasets. This finding points to the
UNC-9 protein as a likely component of gap junctions that
couple A-class motor neurons with command interneurons
that drive motor circuit activity in the ventral nerve cord [37].
In addition to genes that are enriched in both embryonic and
larval A-class motor neurons, we also detected transcripts
that are selectively elevated in one or the other dataset (Addi-
tional data file 10). Transcription factors comprise the largest
group of differentially expressed genes. Of 24 transcription
factor genes enriched in embryonic A-class motor neurons,
only two, unc-3 and unc-4, are also included in the separate
list of 10 transcription factors enriched in larval A-class motor
neurons (Table 3). UNC-3 (O/E HLH protein) and UNC-4
(homeodomain protein) have been previously shown to
specify shared characteristics of embryonic and larval A-class
motor neurons [36,75,76]. Roles for the remaining transcrip-
tion factors in the differentiation of these motor neuron sub-
types are unknown. For example, members of the POU (ceh-
6) and CUT (ceh-44) classes of homeodomain protein fami-
lies, which are well-established determinants of neuronal fate
[88,89], are selectively enriched in the larval A-class list. Con-
versely, five members of the nuclear hormone receptor family
(nhr-3, nhr-95, nhr-104, nhr-116 and F41B5.9) are preferen-
tially expressed in embryonic A-type motor neurons. The
extent to which these different combinations of transcription
factors account for characteristics that distinguish embryonic
and larval A-class motor neurons can now be explored by
genetic analysis.
A key morphological feature that distinguishes DA from VA
motor neurons is clearly linked to differential levels of specific
transcripts in embryonic versus larval A-class datasets.
During embryonic development, DA motor neurons extend
commissures that circumnavigate the body wall to innervate
dorsal muscles. The dorsal trajectory of DA motor neuron
outgrowth depends on the UNC-6/netrin receptor genes,
unc-5 and unc-40, and the receptor protein tyrosine phos-
phatase (RPTP) clr-1 gene [90,91], all three of which are
enriched in the embryonic A-class dataset (Figure 12). In con-
trast, unc-5, unc-40 and clr-1 are not elevated in larval VA
motor neurons, which consequently innervate muscles on the
ventral side. Guidance cues that govern the anteriorly
directed outgrowth of motor axons, the dorsal and ventral
nerve cords, respectively, are not known. However, a likely
candidate to direct axonal outgrowth along the C. elegans
anterior-posterior axis is Wingless (Wnt) signaling [92-94].
In this regard, it is interesting that a comparison of the
embryonic and larval A-class motor neuron transcripts iden-
tifies two different Wnt receptors that are selectively enriched
in either the DA (lin-17) or VA (mig-1) motor neurons. In
addition, the transcript for the Wnt ligand cwn-1 shows ele-
vated expression in the embryonic A-class dataset.
Comparisons to microarray profiles of C. elegans
sensory neurons identify differentially expressed
transcripts
Colosimo et al. [8] used MAPCeL to profile the sensory neu-
rons AFD and AWB. We found that <20% of AFD/AWB
enriched transcripts also show elevated expression in embry-
onic A-type motor neurons (Figure 8f; Additional data file 11),
a finding consistent with the distinct roles of these neuron
classes in C. elegans. For example, the AFD-specific guan-
ylate cyclase genes, gcy-8 and gcy-23, are excluded from the
enriched embryonic A-type motor neuron dataset, whereas
the A-class specific transcription factor, unc-4, is not found in
the AFD/AWB profile (Additional data file 11). In contrast, a
significantly larger fraction (approximately 43%) of AFD/
AWB enriched transcripts, including gcy-8 and gcy-23, are
elevated in the embryonic pan-neural profile (Figure 8e)
(Additional data file 11). Similar results were obtained when
comparing the larval pan-neural and A-class datasets to a lar-
Genome Biology 2007, Volume 8, Issue 7, Article R135 Von Stetina et al. R135.17
comment reviews reports refereed researchdeposited research interactions information
Genome Biology 2007, 8:R135
val profile of chemosensory neurons [14] (data not shown).
These findings confirm the reliability of these neuron-specific
profiling methods for identifying differentially expressed
transcripts and confirm that the panneural profiling
approach is sufficiently sensitive to detect genes expressed in
diverse cell types throughout the C. elegans nervous system.
Microarray profiles are consistent with gene
expression topographic maps
We compared our data to a topographic map derived from
553 microarray experiments in which genes are assigned to
specific 'mountains' based on similarities in gene expression
[95]. In some instances, co-regulated genes were grouped
into specific functional subsets, thereby defining the 'name' of
the mountain. For example, mountain 6 contains many genes
that are known to function in neurons. Neuronal transcripts
identified in all four of our neuronal microarray experiments
(embryonic and larval pan-neural, embryonic and larval A-
class) are significantly over-represented in the neuromuscu-
lar mountain (mountain 1) and one of the neuronal moun-
tains (mountain 6). In contrast, transcripts in the embryonic
muscle dataset are significantly under-represented in moun-
tains 1 and 6 but are over-represented in the muscle mountain
(mountain 16) (RMF, DMM unpublished data). These data
provide additional validation for our neuronal expression
profiles.
Detection of expressed genes
We limited the analysis above to transcripts that show a sta-
tistically significant level of enrichment in neurons relative to
other cell types in order to focus on genes that may function
predominantly in the nervous system. Our microarray data,
however, also include intensity values for a larger group of
transcripts that may be broadly expressed in neurons as well
as in other tissues. We define these transcripts as 'expressed
genes' (EGs). We identified 7,953 EGs in the MAPCeL profile
of embryonic neurons using criteria that exclude transcripts
that are likely to originate from the small fraction (approxi-
mately 10%) of non-GFP cells in the FACS preparation [5]
(Additional data file 12). For the larval pan-neural and larval
A-class motor neuron datasets obtained with the mRNA-tag-
ging method, EGs were defined using similar considerations,
in this case, to exclude transcripts that are likely due to back-
ground levels of RNA adhering nonspecifically to the sepha-
rose beads used in the immunoprecipitation step (see
Materials and methods). EGs in these experimental samples
represent transcripts that may be enriched in neurons as well
as genes that are expressed at comparable levels in neurons
and in other tissues. This approach identified a total of 4,033
EGs in the larval pan-neural dataset and 3,320 EGs in the
larval A-class profile (Additional data file 13). As expected,
'housekeeping' genes are prevalent in these datasets but
excluded from the neuron enriched profiles. For example, 20
ribosomal subunit genes (13 large, 7 small) are included in the
dataset of larval pan-neural EGs but are not listed in the
profile of transcripts enriched in larval neurons (Additional
data files 1 and 13).
A comparison of all EGs in the larval and embryonic datasets
described in this paper (that is, reference, pan-neural, A-class
motor neurons), in addition to the previously described
embryonic A-class dataset [5], reveals a total of approxi-
mately 12,000 unique transcripts or 63% of the predicted
genes represented on the C. elegans Affymetrix Gene Chip
(Additional data file 14). We note that approximately 1,600 of
these EGs correspond to transcripts that have not been previ-
ously confirmed by expressed sequence tags (Additional data
file 16); a subset of 336 transcripts from this group is enriched
in at least one of the neuronal datasets, suggesting that they
may have specific functions in C. elegans neurons.
Discussion
We have used two complementary microarray-based strate-
gies to obtain comprehensive gene expression profiles of
developing C. elegans neurons. In the MAPCeL method, GFP-
labeled embryonic neurons were isolated by FACS for micro-
array profiling [5]. Because postembryonic neurons are not
readily available for sorting [12], we used an alternative strat-
egy, the mRNA-tagging method, to profile the larval nervous
system [11]. In this approach, neuronal mRNAs were purified
by immunoprecipitation from transgenic animals expressing
an epitope-tagged RNA binding protein (FLAG-PAB-1) in lar-
val neurons. Together, these microarray datasets identify
2,488 transcripts that show elevated expression in the C. ele-
gans nervous system relative to other tissues in at least one
developmental stage (that is, embryonic or larval) (Additional
data file 10). A bioinformatic query of WormBase confirmed
enrichment of known neural transcripts in these datasets
(Figure 3a). In addition, analysis of a representative group of
newly constructed GFP reporters has confirmed in vivo neu-
ral expression of >90% of previously uncharacterized genes
on these lists (Table 1). We therefore conclude that these 'pan-
neural' profiles provide accurate representations of gene
expression in the C. elegans embryonic and larval nervous
systems. These transcripts encode proteins with a broad array
of functions. For example, as expected, ion channels, neuro-
transmitter receptors and synaptic vesicle components are
highly represented (Figure 7; Table 2; Additional data file 4).
In a striking indication of the complex signaling capacity of
the C. elegans nervous system, most of the known peptide
neurotransmitter genes (for example, 20 of 23 FMRFamide
genes or 'flps') are enriched in the larval pan-neural dataset
(Figure 4; Additional data file 4) [96]. Neural functions for
previously uncharacterized members of these gene families
can now be assigned by genetic or RNAi analysis. With this
possibility in mind, we tested the applicability of these
expression data for predicting in vivo functions for genes in
this dataset that are also included in a genome-wide
interaction map or 'interactome' for C. elegans proteins [67].
This analysis revealed that proteins encoded by a subset of
R135.18 Genome Biology 2007, Volume 8, Issue 7, Article R135 Von Stetina et al. />Genome Biology 2007, 8:R135
panneural transcripts are linked to identified components of
the synaptic vesicle cycle and, therefore, predicts that genetic
or RNAi perturbation of these genes should result in neuro-
transmitter signaling defects (Figure 10). In addition to find-
ing transcripts that may have shared roles in both the
embryonic and larval nervous system, these pan-neural pro-
files have also identified a significant number of genes (71%,
1,777/2,488) that are differentially enriched in either embry-
onic or larval neurons. In the future, it will be interesting to
determine if these genes define stage-specific features of the
developing nervous system.
The mRNA-tagging method can be used to generate
gene expression profiles of specific neurons
In addition to detecting transcripts that are broadly expressed
throughout the nervous system (that is, synaptic vesicle com-
ponents), the pan-neural profiles also include genes that are
selectively expressed in specific neurons. In most instances,
these known assignments are based on promoter-GFP
reporter constructs for a limited number of genes in a given
neuron and are, therefore, incomplete. To test the applicabil-
ity of the mRNA-tagging strategy for obtaining a comprehen-
sive gene expression profile of a specific subset of neurons, we
utilized this approach to fingerprint a group of 18 larval cells
largely composed of A-type motor neurons [35,75]. This
experiment revealed >400 transcripts with enriched expres-
sion in these cells (Additional data file 1). Although the major-
ity (70%) of these transcripts also show elevated expression in
the larval pan-neural profile (Figure 8), a significant fraction
of these mRNAs are exclusively enriched in the A-class data-
set in this comparison and are, therefore, likely to represent
genes with limited expression in the nervous system. These
results indicate that the mRNA-tagging strategy can now be
applied to monitor gene expression in specific C. elegans neu-
rons and that this approach should detect neuron-specific
genes with potential key roles in the specification or function
of individual neuron types. Our findings confirm an earlier
study in which a neuron specific promoter was used in con-
junction with the mRNA-tagging strategy to identify tran-
scripts that are highly expressed in a group of approximately
50 sensory neurons from C. elegans [14]. Our work provides
the important technical advance, however, of substantially
enhancing the sensitivity of this method; we show that relia-
ble profiles can be obtained by amplifying nanogram quanti-
ties of mRNA whereas the method of Kunitomo et al. [14]
required micrograms of starting mRNA.
Limitations of the mRNA tagging method
Despite the successful use of mRNA-tagging for these cell-
specific profiling experiments, additional improvements in
this method would be helpful. For example, with any given
promoter, we sometimes observe FLAG-1::PAB-1 staining in
the expected cell types as well as in additional ectopic loca-
tions (data not shown). This problem is unlikely to result from
gene expression domains in the transgenic PAB-1 construct
because the substitution of pab-1 cDNA to remove all possible
genomic PAB-1 regulatory sites did not rectify this problem
(Von Stetina et al., unpublished data). Our solution has been
to generate multiple transgenic lines for each construct until
we obtain at least one line in which FLAG-PAB-1 expression
is limited to the cells of choice. A second problem with this
method is pull-down of non-specific mRNA bound to the
anti-FLAG sepharose beads. We have reduced this back-
ground by including a stringent wash step with a low salt
buffer, but additional treatments to remove this extraneous
mRNA would enhance the sensitivity of this method (see
Materials and methods). Lastly, some promoters result in
subviable transgenic lines or unpredictable genetic
interactions that limit profiling experiments [37] (data not
shown). The biological mechanisms of these effects are
unknown but have also been observed for PAB-1 mRNA-tag-
ging lines in Drosophila [97].
Applications of cell-specific microarray profiling
methods
The mRNA-tagging strategy has been used to generate robust
gene expression profiles of major C. elegans tissues (that is,
muscles, intestine, nervous system) [11,13] (this paper). By
exploiting promoter elements with more limited expression,
it has also been possible to extend this approach to specific
subsets of neurons. These results suggest that mRNAtagging
can now be exploited to obtain gene expression profiles in a
broad array of cell types at precisely defined developmental
intervals. For example, mRNA-tagging profiles obtained dur-
ing a critical larval period in which GABAergic motor neurons
switch axonal versus dendritic polarity could potentially
reveal genes that direct the remodeling process [98]. The
combined profiling results reported in this paper identify a
set of 177 transcription factors showing enriched expression
in neurons. Genetic analysis has established that many of
these transcription factors regulate key aspects of neuronal
differentiation and function [31,47,55-57,76,99,100]. Both
the MAPCeL and mRNA-tagging approaches can now be uti-
Transcripts encoding proteins that function in synaptic transmission are enriched in the neural datasets but largely excluded from muscleFigure 7 (see following page)
Transcripts encoding proteins that function in synaptic transmission are enriched in the neural datasets but largely excluded from muscle. (a) The line
graph depicts 61 synaptic transmission genes that are enriched in the larval pan-neural (LP) dataset (colors from heat map at right are defined by LP sample
denoted by vertical white line with arrowheads). Most of these transcripts are also enriched in other neuronal datasets (embryonic pan-neural (EP),
embryonic A-class motor neuron (EA), larval A-class motor neuron (LA)) but not in embryonic muscle (EM). An exception is snf-11 (horizontal green line),
the membrane-bound GABA transporter, which is significantly elevated in the EM and LP datasets, consistent with its known expression in muscle and
neurons [26]. (b) Many of the proteins encoded by the 61 LP-enriched synaptic transmission genes are localized to synaptic vesicles (SV; center circle) or
to the plasma membrane (shaded rectangle). Other proteins are predicted to perform related functions, such as the synthesis of neurotransmitters and/or
vesicular trafficking.
Genome Biology 2007, Volume 8, Issue 7, Article R135 Von Stetina et al. R135.19
comment reviews reports refereed researchdeposited research interactions information
Genome Biology 2007, 8:R135
Figure 7 (see legend on previous page)
UNC-32
Vesicular
transporter
SV2
SNT-1 SNT-6
SNT-4 DH11.4
SNT-5 T10B10.5
SNB-1
UNC-43
RAB-3
UNC-13
UNC-10
F45E4.3
SNN-1
RIC-4
Neurotransmitter
biosynthetic enzymes
UNC-25
CHA-1
TDC-1
Proton pump
CamKII
Synapsin
Synaptobrevin
Synaptotagmin
SNAP-25
RIM
ZK637.1
SNG-1
Synaptogyrin
SVOP
OCT-1
F45E10.2
EAT-4
CAT-1
UNC-17
UNC-46
UNC-47
Endocytosis machinery
APA-1
APB-1
APS-2
APT-10
CAV-1
DNJ-25
DYN-1
EHS-1
ERP-1
TAG-64
UNC-11
B0495.10
T28F3.1
Membrane
transporter
CHO-1
DAT-1
GLT-3
SNF-11
UNC-18
UNC-18
T07A9.10
(a)
(b)
Normalized intensity (log value)
EM EP LP EA LA
RAB-3 interactors
AEX-3
Tomosyn
TOMO-1
Synaptic vesicle
trafficking
UNC-14
UNC-16
UNC-119
JNK-1
JKK-1
UNC-13
F54G2.1
RBF-1
RIC-8
RIC-19
D1014.3
T06D8.2
Y73E7A.4
Other
CAB-1
0.01
0.1
1
10
100
0.01
0.1
1
10
100
Depleted
Enriched
Unchanged
SV
snf-11
R135.20 Genome Biology 2007, Volume 8, Issue 7, Article R135 Von Stetina et al. />Genome Biology 2007, 8:R135
Table 3
Major transcription factor families enriched in C. elegans neurons
Transcription factor families Fold change
Cosmid name Common name Embryonic pan-neural Larval pan-neural Embryonic A-class Larval A-class
Homeobox
C40H5.5 ttx-3 1.6 1.5
C33D12.1 ceh-31 1.6
D1007.1 ceh-17 1.6
K02B12.1 ceh-6 1.6 1.6
T13C5.4 3.3 1.6
T26C11.7 ceh-39 1.6
ZC64.3 ceh-18 1.6
C18B12.3 1.7
C28A5.4 ceh-43 1.7
F56A12.1 unc-39 1.8
W03A3.1 ceh-10 1.8
C10G8.6 ceh-34 1.9
C17H12.9 2
F55B12.1 ceh-24 2
ZC123.3 1.6 2
C30A5.7 unc-86 2.1
T26C11.5 ceh-41 1.6 2.1
C39E6.4 mls-2 2.3
F01D4.6 mec-3 2.6
R08B4.2 2.6
B0564.10 unc-30 2.2 2.7
W05E10.3 ceh-32 2.7
F26C11.2 unc-4 2.8 13.2 9.0
C37E2.4 ceh-36 2.9
R07B1.1 vab-15 2.9
Y54F10AM.4 ceh-44 3.3 2.1
F58E6.10 unc-42 2.4 3.8
ZC247.3 lin-11 5.2
C07E3.5 1.7
F46C8.5 ceh-14 1.7
W06A7.3 ret-1 1.8
Y113G7A.6 ttx-1 2.8
Hormone receptors
Y94H6A.1 1.5
F47C10.3 1.6
F47C10.7 1.6
F56E3.4 fax-1 1.7
H01A20.1 nhr-3 1.8 1.7 1.9
R09G11.2 nhr-1 1.7
T03G6.2 nhr-40 1.7
Y39B6A.17 nhr-95 1.6 1.7 1.8
C24G6.4 nhr-47 21.8
K06B4.8 2
K06B4.1 nhr-51 2.5 2.1
K06B4.2 nhr-52 2.1
F21D12.1 nhr-21 2.2
C49F5.4 2.9
Genome Biology 2007, Volume 8, Issue 7, Article R135 Von Stetina et al. R135.21
comment reviews reports refereed researchdeposited research interactions information
Genome Biology 2007, 8:R135
F07C3.10 nhr-63 4
C06C6.4 nhr-67 1.8
C08F8.8 nhr-124 1.5
C17E7.8 nhr-116 2.3
F09C6.9 3.3 1.9
F16B4.9 1.9
F31F4.12 1.6
F41B5.9 nhr-96 2.5 1.7
F44C8.11 1.8
F44C8.9 1.7
F48G7.11 2
F59E11.8 1.8
K06B4.10 nhr-88 1.8
K08A2.5 nhr-71 1.5
K11E4.5 1.8
R07B7.15 nhr-104 1.7
R11E3.5 1.8
T07C5.4 nhr-44 3.2
T19A5.4 nhr-59 1.9
T27B7.1 nhr-115 1.7
T27B7.4 nhr-65 2.9
Y17D7A.3 1.5
Y67D8B.2 1.8
Aryl-hydrocarbon
receptors
C25A1.11 aha-1 1.7
C41G7.5 ahr-1 1.7
C56C10.10 2.2 2 2.3
SMADs
F01G10.8 daf-14 1.7
F25E2.5 daf-3 1.9
F37D6.6 tag-68 2.2 2.3 2.0
HMG box
F40E10.2 sox-3 1.6 1.5
T22B7.1 egl-13 1.6
T05A7.4 hmg-11 2.3 2.1
F47G4.6 2.3
K08A8.2 sox-2 2.5 2.9
C12D12.5 4.7
Y17G7A.1 hmg-12 1.8
HLH factors
C43H6.8 hlh-15 4.4 1.6
F58A4.7 hlh-11 1.6
Y16B4A.1 unc-3 2.9 3 4.9
F48D6.3 hlh-13 3
W02C12.3 1.8
Table 3 (Continued)
Major transcription factor families enriched in C. elegans neurons
R135.22 Genome Biology 2007, Volume 8, Issue 7, Article R135 Von Stetina et al. />Genome Biology 2007, 8:R135
lized to generate comparisons of mutant versus wild-type
profiles that should reveal transcription factor-regulated
genes in specific neurons [9,37]. Microarray profiling of
mutants for other classes of proteins could also be utilized to
reveal unexpected gene regulatory roles. For example, a com-
parison of pan-neural mRNA-tagging datasets obtained from
mutant versus wild-type animals indicates that the conserved
synaptic protein RPM-1/Highwire regulates gene expression
throughout C. elegans nervous system (JDW, SEV, DMM,
unpublished results). The C. elegans nervous system is
uniquely well-defined with a wiring diagram denoting chem-
ical synapses and gap junctions among all 302 neurons. It
should now be possible to exploit these cell-specific micro-
array profiling methods to define genes expressed in each
type of neuron in this circuit. In turn, novel computational
methods could be exploited to link specific subsets of these
genes to roles in defining the connectivity architecture of this
network [101,102].
Towards defining the transcriptome
In addition to transcripts showing elevated expression in neu-
rons, our neural microarray profiles include a larger group of
transcripts that are expressed in neurons and in other tissues
at comparable levels. We refer to these transcripts as
'expressed genes'. A comparison of the three larval datasets
described in this work (reference, larval pan-neural, larval A-
class motor neuron) reveals that 1,424 EGs are shared and
are, therefore, likely to represent transcripts that function in
a broad array of cell types. In contrast, a smaller number of
transcripts are uniquely detected in either the larval pan-neu-
ral (1,189) or larval A-class motor neuron (435) datasets. The
three embryonic datasets (reference, embryonic pan-neural,
embryonic A-class motor neuron) commonly express 4,995
EGs, with 280 EGs unique to embryonic A-class motor neu-
rons and 480 mRNAs selectively detected in the embryonic
pan-neural profile. These findings suggest that microarray-
based strategies to confirm in vivo expression of all predicted
C. elegans genes or to identify new, previously unknown tran-
scripts (for example, tiling array profiles) [103], will require
extraction of mRNA from a variety of specific cells and tissues
with methods similar to those described here.
Conclusion
Approximately 9,000 C. elegans genes represented on the
Affymetrix array have annotated human homologs (Addi-
tional data file 3). Roughly 5% (525) of these genes encode
uncharacterized conserved proteins. Our combined micro-
array data have revealed that 108 of these transcripts are
enriched in neurons (Additional data file 24). The high con-
servation of this subset of genes from nematodes to humans
indicates that the encoded proteins may play pivotal roles in
neuronal function or specification. Indeed, we show that
approximately 80% of the members of a core group of pan-
neural genes (19/25) from this list are expressed in the
mammalian brain. The MAPCeL and mRNA-tagging strate-
gies provide sufficient temporal information to pinpoint the
developmental period during which a gene may function, as
well as the spatial resolution to define the neuron in which it
is expressed. With the powerful molecular and genetic tools
available to C. elegans researchers, it should now be possible
to delineate the roles of these novel targets in the nervous
system.
Materials and methods
Nematode strains
Nematodes were grown as described [104]. Strains were
maintained on nematode growth media plates inoculated
with the E. coli strain OP50 [105]. Strains used to isolate
transcripts via mRNA-tagging were N2 (wild type), SD1241
(gaIs153, F25B3.3::FLAG::PAB-1) (NC694 (wdEx257, unc-
Venn diagrams comparing transcripts from profiled cell types at specific developmental stagesFigure 8
Venn diagrams comparing transcripts from profiled cell types at specific
developmental stages. (a) Larval pan-neural (LP) and embryonic pan-neural
(EP) datasets are enriched for common transcripts, but also contain
transcripts exclusive to either developmental stage. (b) Larval A-class (LA)
and embryonic A-class (EA) identify 162 shared transcripts. Transcripts
selectively enriched in either neuron type may contribute to the unique
morphologies of DA versus VA motor neurons (Figure 10). (c,d) The
depth of the pan-neural datasets (EP, LP) is reflected in the substantial
overlap with the A-class motor neuron profiles (EA, LA). Genes exclusively
enriched in the EA and LA profiles are indicative of rare transcripts
showing neuron specific expression. (e,f) Comparisions of the embryonic
neural specific datasets (EP, EA) described in this paper with the embryonic
profile of specific thermosensory neurons (AFD and AWB described by
Colosimo et al. [8]. The AFD/AWB profile shows greater overlap with the
EP dataset (e) than with the EA profile (f). See Additional data files 10 and
11 for lists of genes identified in each comparison.
851
711
926
LP
EP
1290
347
466
EP
AFD/AWB
(a)
(c)
(d)
(e) (f)
250
162
833
LA
EA
(b)
856
139
674
EA
AFD/AWB
1278
127
284
LA
LP
1116
474
521
EA
EP
Genome Biology 2007, Volume 8, Issue 7, Article R135 Von Stetina et al. R135.23
comment reviews reports refereed researchdeposited research interactions information
Genome Biology 2007, 8:R135
4::3XFLAG::PAB-1) [37]. GFPtagged embryonic neurons
were isolated from NW1229 (evIs111, F25B3.3::GFP) [47] (J
Culotti, personal communication) for MAPCeL analysis.
Molecular biology
To create pPRSK29 (F25B3.3::FLAG::PAB-1), 4 kb of the
F25B3.3 promoter upstream of the predicted ATG start was
amplified using the following primers: Dp-5 (5'-GTC AAC
TAG TGT ATG ATT CCT CG-3') and Dp-3 (5'-TCG GGG TAC
CTA TCG TCG TCG TCG TCG ATG CCG TCT TCA CGA-3').
The predicted ATG start of F25B3.3 was replaced with an
Asp718 site in the 3' primer. This PCR fragment was cloned
into pCR2.1-TOPO (Invitrogen, Carlsbad, California, USA) to
generate pPRSK29.1. pPRSK29.1 was digested with BamH1
and Asp718 to obtain the promoter fragment. pPRSK9
(myo3::FLAG::PAB-1) [11] was digested with Asp718 and
SacI to obtain the FLAG::PAB-1 fragment. pBluescript SK
was digested with SacI and BamHI, and a threeway ligation
was performed to obtain pPRSK29 (F25B3.3::FLAG::PAB-1).
Transgenic generation
pPRSK29 (60 ng/μl) was co-injected with pTG99 (sur-
5::GFP, 20 ng/μl) using standard injection protocols [106].
The resulting transgenic array was integrated using a Strata-
linker (Stratagene) at 300 Joules/m
2
[107] (Shohei Mitani,
personal communication). GFP reporters were selected at
random from a subset of plasmids received from the Pro-
moterome project [108]. Microparticle bombardment was
conducted as described [5].
Generating synchronized populations of L2 larvae for
mRNA-tagging
Strains were grown to 'starvation' (that is, all dauer larvae) on
ten 60 mm nematode growth media plates at 25°C. Half of
each 60 mm plate was split into four pieces and placed on a
150 mm 8P plate [109] inoculated with the E. coli strain
Na22. The resultant twenty 8P plates were incubated at 25°C
until a majority of the food was depleted and most animals
were gravid adults (a 'line' of worms is usually found at the
retreating edge of the bacteria). The worms were removed
from the plates with ice-cold M9 buffer (22 mM KH
2
PO
4
, 22
mM Na
2
HPO
4
, 85 mM NaCl, 1 mM MgSO
4
) and collected by
centrifugation. Washes were repeated until the supernatant
was clear of bacteria. A sucrose float (30 ml ice cold M9
buffer, 20 ml cold 70% sucrose) was performed to create an
axenic nematode suspension. Animals were washed twice in
ice-cold M9 buffer, then resuspended in 75 ml bleach solution
(15 ml Chlorox, 3.75 ml 10 N NaOH, 56.25 ml water). Worms
were transferred to a 125 ml glass beaker with a stir bar and
incubated for 5-6 minutes while stirring rapidly (solution
turns a dark yellow when nearing completion). When a
majority of adults burst, the solution was passed through a 53
μm nylon mesh (Fisher #08670201, Pittsburgh, Pennsylva-
nia, USA) to separate intact embryos from worm carcasses.
Embryos were harvested by centrifugation and washed at
least three times with M9 buffer. Embryos were resuspended
in RT M9 buffer and incubated on a nutator for 12-16 hours at
20°C to allow L1 larvae to hatch and arrest.
Arrested L1 larvae were collected by centrifugation. Animals
were resuspended in 1 ml RT M9 buffer and split equally over
six 150 mm 8P plates. L1s were grown at 20°C for 22-25 hours
to reach mid-L2, as shown by the appearance of the post-
deirid sensory organ (approximately 80%) [1]. L2s (approxi-
mately 0.3-1 ml) were harvested from 8P plates and sucrose
floated as above. Worms were resuspended in 30 ml cold M9.
mRNA-tagging
Methods are identical to those previously described [11] with
the following modifications. Synchronized L2 larvae were
resuspended in 2-3 ml homogenization buffer (HB; 50 mM
HEPES, pH 7.6; 150 mM NaCl; 10 mM MgCl
2
; 1 mM EGTA,
pH 8.0; 15 mM EDTA, pH 8.0; 0.6 mg/ml Heparin; 10% glyc-
erol) and passed through a French press at 6,000 psi. Total
RNA was isolated from 100 μl of lysate. An amount of lysate
equivalent to 200 μg total RNA was used for co-immunopre-
cipitation. Following co-immunoprecipitation, beads were
washed three times by brief treatment with 2 ml low-salt
homogenization buffer (LSHB; 20 mM HEPES, pH 7.6; 25
mM NaCl; 1 mM EGTA, pH 8.0; 1 mM EDTA, pH 8.0; 0.6 mg/
ml Heparin; 10% glycerol). Beads were then washed three
time for 30 minutes in 2 ml LSHB. The LSHB treatment sub-
stantially reduced nonspecific RNA binding to the agarose
beads (data not shown). Elution and mRNA extraction were
performed as described [11] (see detailed protocol in Addi-
tional data file 20).
Isolation of RNA from embryonic neurons for MAPCeL
analysis
In the MAPCeL method, GFP cells are isolated by FACS for
microarray analysis. Primary cultures of embryonic cells were
prepared [12] from a transgenic line expressing GFP through-
out the nervous system, NW1229 (evIs111, F25B3.3::GFP)
[47] (J Culotti, personal communication). After 24 hour in
culture, GFP-labeled neurons were obtained by FACS and
total RNA isolated as described [5,110]. Muscle profiling data
used in Figures 4 and 7 were obtained by MAPCeL of embry-
onic muscle cells after 24 hours in culture (M24 dataset)
(RMF, DMM, unpublished data). The top 50 enriched genes
in this dataset were selected on the basis of statistical rank.
RNA amplification and microarray data analysis
A C. elegans Affymetrix chip was used for all microarray
experiments [111]. For mRNA-tagging experiments, 25 ng of
co-immunoprecipitated RNA was amplified and labeled as
previously described [5]. Larval pan-neural
(F25B3.3::FLAG::PAB-1) profiles were obtained in triplicate.
Four independent larval A-class motor neuron (unc-
4::3XFLAG::PAB-1) profiles were obtained. Reference pro-
files were generated from low levels of non-specifically bound
RNA obtained from mock immunoprecipitations of synchro-
nized populations of wild type (N2) L2 larvae. Five independ-
R135.24 Genome Biology 2007, Volume 8, Issue 7, Article R135 Von Stetina et al. />Genome Biology 2007, 8:R135
Figure 9 (see legend on next page)
AGE-1
AAP-1
DAF-2
PIP
2
PIP
3
DAF-18
PDK-1
AKT-1
AKT-2
Cytoplasmic
DAF-16
Insulin branch
DAF-28
INS-1
TGF-beta branch
Reproductive
growth
DAF-7
DAF-1 DAF-4
DAF-14
DAF-8
DAF-3
DAF-5
Other proteins involved
in dauer formation
DAF-15
DAF-19
DAF-21
TAX-4
UNC-3
UNC-31
UNC-64
DAF-11
DAF-12
DAF-9
Dafachronic
acid
Dauer
formation
Nucleus
nuclear
DAF-16
- ligand
+ ligand
Genome Biology 2007, Volume 8, Issue 7, Article R135 Von Stetina et al. R135.25
comment reviews reports refereed researchdeposited research interactions information
Genome Biology 2007, 8:R135
ent reference datasets were obtained. Total RNA (100 ng) was
amplified and labeled for the MAPCeL sample,
F25B3.3::GFP, isolated in triplicate. A previously obtained
profile of total RNA isolated from all viable embryonic cells in
culture was used as a MAPCeL reference [5].
Hybridization intensities for each experiment were scaled by
reference to a global average signal from the same array
(Additional data files 25 and 26) and normalized by robust
multi-array analysis (RMA; Additional data files 27 and 28).
We identified transcripts in two categories: EGs, or tran-
scripts that are reliably detected in a given sample; and
enriched genes, or transcripts with intensity values that are
significantly higher than reference samples. EGs were esti-
mated for the mRNA-tagging samples as follows. Expressed
transcripts in the F25B3.3::FLAG::PAB-1 (larval pan-neural)
and the unc4::3XFLAG::PAB-1 (larval A-class motor neu-
rons) were initially identified on the basis of a 'present' call in
a majority (for example, two-thirds) of experiments as deter-
mined by Affymetrix MAS 5.0. In this approach, genes are
called 'absent' and, therefore, excluded when the mismatch
(MM) value exceeds the perfect match (PM) intensity for a
given gene. This analysis initially identified 8,084 'present'
transcripts in the larval pan-neural sample and 7,578 tran-
scripts in the larval A-class motor neuron sample (Additional
data file 21). These lists, however, are likely to include mRNAs
that are non-specifically bound to the anti-FLAG sepharose
beads at low levels relative to bona fide neuronal transcripts
(see above). We reasoned that transcripts included in the
experimental samples that are actually derived from this non-
specific pool should be generally detected in the reference
sample at higher intensity values. Therefore, to exclude these
non-specific mRNAs from the list of predicted neuronal
genes, the average RMA-normalized intensity for each tran-
script in the reference sample was subtracted from the RMA
value of the corresponding gene in the experimental sample.
Transcripts with resultant positive values were considered
EGs whereas transcripts with negative values after this
operation were removed. In a final adjustment, a limited
number of transcripts that are detected as neuronally
enriched (see below) but not scored as present by MAS 5.0
were restored to the lists. This treatment identified 4,033 EGs
in the larval pan-neural dataset and 3,320 EGs in the larval A-
class motor neuron profile (Additional data file 13). EGs
(7,953) for the MAPCeL embryonic pan-neural dataset were
identified as previously described (Additional data file 12) [5].
Our treatment is relatively stringent as it is likely to exclude at
least some transcripts that may be ubiquitously expressed
(for example, 'housekeeping' genes) or potentially more
highly expressed in another tissue relative to the nervous sys-
tem. This prediction is consistent with the finding that
approximately 20% (509/2,422; Additional data file 15) of
transcripts identified in independent microarray experiments
as highly enriched in GMIc (GMI plus the genes common to
all three groups) remain in the list of larval pan-neural EGs
(Additional data file 13). In contrast, 48% (1,172/2,422;
Additional data file 15) of transcripts enriched in these other
tissues are included in the list of 6,342 EGs in the larval refer-
ence dataset (Additional data file 13).
The data discussed in this publication have been deposited in
NCBI's Gene Expression Omnibus [112-114] and are accessi-
ble through GEO series accession number GSE8004 (embry-
onic pan-neural, larval pan-neural, larval A-class) and
GSE8159 (embryonic A-class).
To detect neuronally enriched transcripts, RMA-normalized
intensities for experimental versus reference samples were
statistically analyzed using Significance Analysis of Microar-
rays software (SAM) [115]. A two-class unpaired analysis of
the data was performed to identify genes that differ by ≥ 1.5-
fold from the reference at a FDR of <1% for the larval pan-
neural, embryonic pan-neural, and larval A-class motor neu-
ron datasets (Additional data file 1). These genes were consid-
ered significantly enriched.
RMA normalized intensity values for all datasets were
imported into GeneSpring GX 7.3 (Agilent Technologies,
Santa Clara, California, USA) to generate the line graphs
shown in Figures 4 and 7. Each experimental dataset was
paired to its corresponding reference dataset for these
diagrams.
Annotation of datasets
We utilized Perl scripts and hand annotation to identify all
known neuronally expressed C. elegans transcripts (Worm-
A majority of dauer pathway genes are enriched in either the larval pan-neural (LP) or embryonic pan-neural (EP) datasetsFigure 9 (see previous page)
A majority of dauer pathway genes are enriched in either the larval pan-neural (LP) or embryonic pan-neural (EP) datasets. Two neuronal pathways
influence the decision to dauer, an alternative developmental pathway adopted in unfavorable conditions [49-54]. During normal growth, the DAF-28
insulin-like molecule activates the DAF-2 insulin receptor to initiate a signal transduction pathway that prevents the translocation of the DAF-16 Forkhead
transcription factor into the nucleus, thus blocking dauer formation. In a parallel pathway, DAF-7/TGF-beta activates receptors DAF-1 and DAF-4 to
inhibit the Smad/Sno complex DAF-3/DAF-5, thereby promoting reproductive growth. The guanylyl cyclase DAF-11 drives expression of DAF-28 and
DAF-7. During reproductive growth, the CYP2 cytochrome P450 enzyme DAF-9 is active and produces the DAF-12 ligand dafachronic acid. In the
presence of its ligand, the nuclear hormone receptor DAF-12 promotes normal development. In the absence of its ligand, DAF-12 instead promotes dauer
formation. Other proteins function independently of these pathways (for example, the DAF-19 transcription factor specifies ciliated neurons that detect
exogenous dauer-inducing signals). Bold lettering denotes enriched transcripts and italics marks EGs detected in at least one of the pan-neural datasets.
Gray letters refer to transcripts not found in either EP or LP datasets. See Additional data file 18 for a complete description of these genes.