Báo cáo y học: "Novel metrics for evaluating the functional coherence of protein groups via protein semantic network" ppsx
Bạn đang xem bản rút gọn của tài liệu. Xem và tải ngay bản đầy đủ của tài liệu tại đây (492.42 KB, 13 trang )
Genome Biology 2007, 8:R153
comment reviews reports deposited research refereed research interactions information
Open Access
2007Zheng and LuVolume 8, Issue 7, Article R153
Method
Novel metrics for evaluating the functional coherence of protein
groups via protein semantic network
Bin Zheng
*†
and Xinghua Lu
*
Addresses:
*
Department of Biostatistics, Bioinformatics and Epidemiology, 135 Cannon Street, Charleston, South Carolina 29425, USA.
†
Laboratory for Functional Neurogenomics, Center for Neurologic Diseases, Harvard Medical School and Brigham and Women's Hospital,
Landsdowne Street, Cambridge, Massachusetts 02139, USA.
Correspondence: Xinghua Lu. Email:
© 2007 Zheng and Lu; licensee BioMed Central Ltd.
This is an open access article distributed under the terms of the Creative Commons Attribution License ( which
permits unrestricted use, distribution, and reproduction in any medium, provided the original work is properly cited.
Assessing coherence of protein groups<p>Metrics are presented for assessing overall functional coherence of a group of proteins based on the associated biomedical literature.</p>
Abstract
We present the metrics for assessing overall functional coherence of a group of proteins based on
associated biomedical literature. A probabilistic topic model is applied to extract biologic concepts
from a corpus of protein-related biomedical literature. Bipartite protein semantic networks are
constructed, so that the functional coherence of a protein group can be evaluated with metrics that
measure the closeness and strength of connectivity of the proteins in the network.
Background
A cellular function is usually carried out by a group of pro-
teins, such as the proteins that participate in a common met-
abolic pathway or a signal transduction pathway. Based on
the assumption that the expression of the proteins involved in
a biologic process should be coordinated, many computa-
tional methods have been developed to identify the potential
modules of genes or proteins based on high throughput tech-
nologies, such as microarray studies [1-3]. When a candidate
protein group is identified algorithmically, it is imperative to
evaluate whether the proteins in the group are functionally
related, termed the functional coherence of the proteins. Cur-
rently, determining the functional coherence of protein
groups requires either manually inspection of the associated
biomedical literature or utilization of currently available pro-
tein annotations. Manually studying of the literature is a labor
intensive task and does not scale well with high throughput
methodology.
Recently, analyses of gene function annotation, especially in
the form of Gene Ontology (GO) [4], have become the most
commonly used methods with which to study the function of
a list of proteins, and many tools have been developed to per-
form such analyses (see the recent reviews by Khatri P,
Draghici [5] and Curtis and coworkers [6], and the references
therein, for details). The GO consists of a set of controlled
vocabulary, referred to as GO terms, which has been widely
used to describe/annotate proteins in terms of three aspects:
molecular function, biologic process, and cellular component.
The underlying assumption for GO annotation analysis is that
if a group of proteins share similar function or participate in
a common cellular process, then they are likely to share GO
annotations, such that the terms may be evaluated as 'statis-
tically enriched' within the group. Therefore, the overall func-
tion of proteins can be represented by the enriched GO terms.
Although very useful, such analysis has certain drawbacks.
First, inconsistency in annotation reduces sensitivity. It is not
uncommon for proteins participating in a common metabolic
or signal transduction pathway to be annotated with different
GO terms because of differing assessments of information by
annotators. Such inconsistency makes it more difficult to
identify enriched GO terms, thus leading to reduced sensitiv-
ity. Second, the approach ignores the relationships among the
Published: 31 July 2007
Genome Biology 2007, 8:R153 (doi:10.1186/gb-2007-8-7-r153)
Received: 4 January 2007
Revised: 23 April 2007
Accepted: 31 July 2007
The electronic version of this article is the complete one and can be
found online at />R153.2 Genome Biology 2007, Volume 8, Issue 7, Article R153 Zheng and Lu />Genome Biology 2007, 8:R153
biologic concepts represented by the enriched GO terms. For
example, one may observe enrichment of GO terms
GO:0004340 (glucokinase activity) and GO:0004618 (phos-
phoglycerate kinase activity) simultaneously within a group
of proteins. The co-enrichment of these two concepts is bio-
logically meaningful because proteins with these functions
participate in a common pathway. However, most of current
methods treat enrichment of GO terms as independent events
and ignore the biologic importance of the correlation of bio-
logic concepts. Third, when multiple GO terms are 'enriched'
within a protein group, it is difficult to derive a quantitative
metric to reflect overall functional relationships of the pro-
teins or their statistical significance evaluations. Finally,
many statistical methods commonly used to determine the
'enrichment' of GO annotation (for instance, hypergeometric
distribution) are sensitive to the size of genome and the fre-
quency of annotations [5,6].
To overcome some of the above-mentioned difficulties, some
researchers utilize information on the semantic similarities of
GO terms or GO graph structure [7-11] to evaluate the func-
tion of protein groups. In these approaches, semantic similar-
ity or GO graph structure are taken into account to evaluate
the relationship of GO annotations within a group of proteins.
These methods require the proteins of interest to be anno-
tated with GO terms. Currently, however, manual annotation
of proteins cannot keep up with the rate of accumulation of
biomedical knowledge. Furthermore, there are many organ-
isms whose genomes are not annotated with GO terms, but a
body of biomedical knowledge exists in the form of free text.
Instead of relying on GO or other forms of annotations, some
researchers directly tap into knowledge in the biomedical lit-
erature associated with the proteins, and study their func-
tional relationships through semantic analysis of the
literatures. Homanyouni and coworkers [12] and Khatri and
colleagues [13] explored the techniques of clustering proteins
based on the semantic contents of the biomedical literature
associated with the proteins, but the semantic information
was not used to evaluate the functional coherence of the pro-
teins per se. By mining the biomedical literature associated
with proteins, Raychaudhuri and Altman [14] developed a
sophisticated scheme and a metric, referred to as neighbor
divergence per gene (NDPG), to evaluate the functional
coherence of a group of proteins. However, their method
requires heuristic setting of multiple parameters and thresh-
olds, whose optimal values may be difficult to determine. Fur-
thermore, their metric is essentially the Kullback-Leibler
divergence of two distributions whose value is not normal-
ized; thus, it is difficult to determine the statistical signifi-
cance of a given score.
In this research, we developed a novel approach to determin-
ing the overall functional coherence of a group of proteins.
The idea underpinning our approach is that biomedical liter-
ature describing a group of proteins that have similar func-
tions or participate in common pathways should share
common biologic concepts. This allows us to extract biologic
concepts from the literature and to connect proteins through
their shared biologic concepts in a bipartite graph, referred to
as a protein semantic network (ProtSemNet). In such a graph,
the proteins participating in a related function tend to be
closely located on the graph. We have designed metrics to
measure the functional coherence of a group of proteins by
determining their 'closeness' or 'strength of connectivity' on
the graph. Furthermore, we have also developed methods
with which to evaluate the statistical significance of the func-
tional coherence metrics.
Results
Evaluating functional coherence with GO annotation
analysis
We first attempted to design metrics based on GO annotation
analysis in order to assess the overall functional coherence of
protein clusters. (Here we use the terms 'protein cluster' and
'protein group' interchangeably.) The results from this exper-
iment can be treated as a baseline that demonstrates the dif-
ficulties associated with this method and provides the
motivation for our approach. In this experiment, we collected
a set of functionally coherent protein groups and a set of ran-
dom clusters to evaluate the ability of the GO derived metrics
to differentiate the functionally coherent protein groups from
the noncoherent ones. For the coherent groups, we selected
the protein groups of ten yeast (Saccharomyces Cerevisiae)
pathways from the Kyoto Encyclopedia of Genes and
Genomes (KEGG) database [15]. KEGG is a comprehensive
knowledge base that contains information regarding genes
and genomes, including a pathway database that describes
the known members of cellular pathways. For the noncoher-
ent clusters, we have randomly sampled genes/proteins from
the yeast genome and grouped them into clusters with sizes
similar to those of the KEGG groups. We employed the most
commonly used hypergeometric distribution to evaluate the
enrichment of a GO term within a cluster (see Materials and
methods, below). We defined a P value of 0.05 or less to be
statistically significant.
Multiple proteins within a cluster naturally lead to multiple
GO terms being associated with the cluster. Contemporary
methods evaluate enrichment of each GO annotation inde-
pendently; this potentially leads to multiple significantly
enriched annotations within a cluster. In order to obtain a
unified scalar metric for evaluating the functional coherence
of the protein group, two intuitive candidate metrics were
considered: the number of 'enriched' GO annotations per
cluster, and the averaged P values of the enriched GO annota-
tions within a cluster. Intuitively, one would expect the first
metric to be larger for the functionally coherent proteins,
because the proteins in such a cluster are more likely to share
GO terms, and the shared GO terms are more likely to be eval-
uated as 'enriched' than are the nonshared ones. The second
Genome Biology 2007, Volume 8, Issue 7, Article R153 Zheng and Lu R153.3
comment reviews reports refereed researchdeposited research interactions information
Genome Biology 2007, 8:R153
metric also makes intuitive sense because if a GO term is
enriched as a result of the functional similarity of the pro-
teins, then the P values should be more significant than those
enriched by random chance.
Counting enriched GO terms as a metric
When evaluating the 'enrichment' of GO annotation using a
hypergeometric distribution, a commonly encountered diffi-
culty is that many low frequency GO terms (for instance, the
terms used to annotate only one or two proteins) will be eval-
uated as 'significantly enriched' whenever they are observed
in a cluster with a reasonable size, regardless of whether the
cluster is a biologically coherent or a fully random one. To
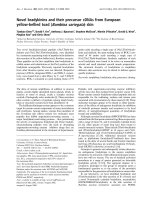
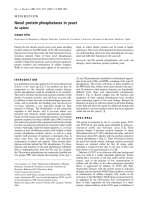
illustrate how often such problem may occur in the real world,
we have plotted a histogram of GO term annotation frequency
in a recent GO annotation dataset from the yeast genome
database (dated 31 March 2007). From Figure 1, one can see
that more than 50% of the GO terms appear in the annotation
data three times or less. In fact, a large number of GO terms
are observed only once in the data. When evaluated with
hypergeometic distribution and other methods, these terms
exhibit a marked tendency to be evaluated as 'significantly
enriched' once they are observed in a cluster. Indeed, all 2,925
but 233 unique GO terms observed in the dataset will be eval-
uated with P < 0.01 if they appear more than once in a cluster
of 50 proteins.
As a potential metric for evaluating overall coherence of pro-
teins in a cluster, the number of 'statistically enriched' GO
terms in the ten KEGG clusters are collected and compared
with those from the randomly drawn clusters. Table 1 shows
the averaged number of enriched GO terms per cluster for the
two groups. Interestingly, the average number of enriched GO
terms in the randomly drawn clusters is higher than that of
biologically coherent KEGG clusters. This observation
counters the intuition that the more the enriched GO terms
exist in a cluster, the more biologically coherent the cluster is.
The possible explanation for such a phenomenon is that the
functionally coherent protein groups tend to share GO terms,
and therefore fewer GO terms are observed. On the other
hand, the random groups may tend to contain various GO
terms, and some of them are inevitably enriched (as discussed
above). Although one can potentially utilize such difference to
distinguish a random cluster from a coherent one, by declar-
ing the cluster with fewer enriched annotation as more coher-
ent one, such an approach seems less intuitive and lacks a
suitable threshold for making good decisions. For example, is
a cluster with zero enriched GO terms more coherent than a
cluster with five?
Averaged P value as a metric
Another potential metric derived from GO annotation analy-
sis is to determine the average P values of the enriched GO
terms per cluster, based on the assumption that the P values
for the enriched GO terms in the coherent clusters may be
more significant than those enriched by random chance. Our
results indicate that this appears to be the case. Table 1 shows
that the average P value of the KEGG clusters is indeed
smaller (more significant) than that of the random clusters.
However, this evaluation also has several drawbacks, as dis-
cussed below.
The P value for enrichment of a GO term is dependent both on
the number of times that the GO term is observed at the whole
genome level and on the size of the cluster. For the GO terms
with low annotation frequency (for example, GO terms only
observed once or twice in the genome), their enrichment
tends to be the same in both functionally coherent and ran-
dom clusters of similar size. Thus, the P values of these GO
terms do not help in assessing the functional coherence of a
cluster, because the 'randomly enriched' GO terms are usually
the low frequency GO terms, and they cannot be further
enriched in the functionally coherent group. For example, in
the glycolysis/gluconeogenesis pathway of yeast (KEGG
The histogram of GO annotation frequencyFigure 1
The histogram of GO annotation frequency. GO, Gene Ontology.
0
200
400
600
800
1,000
135791113151719
Annotation frequency per term
Number of GO terms
Table 1
GO annotation based functional coherence metrics
Group Average number of 'enriched' GO terms Average P values of the 'enriched' GO terms
KEGG 78.6 0.00078
Random 84.7 0.0023
GO, Gene Ontology; KEGG, Kyoto Encyclopedia of Genes and Genomes.
R153.4 Genome Biology 2007, Volume 8, Issue 7, Article R153 Zheng and Lu />Genome Biology 2007, 8:R153
pathway sce00010), there are several GO terms that are
observed only once in the yeast genome annotation (for
example, GO:0004332 [fructose-bisphosphate aldolase
activity], GO:0004340 [glucokinase activity], and
GO:0004618 [phosphoglycerate kinase activity]). The low
annotation frequency for these terms is due to the biologic
reality that yeast has only one protein performing each of the
described functions. However, if these annotations are
observed in any randomly grouped cluster of the same size,
they will be evaluated as being as 'significant' as in the coher-
ent clusters, because they cannot be further enriched. In addi-
tion, because of their rareness, the low frequency GO terms
tend to be evaluated with more significant P values.
It can be seen that when the average P values of the clusters is
used to identify the coherent clusters, the results will be
determined by the GO terms that have high annotation fre-
quencies at whole genome level and are observed many times
within the cluster. In order to find the 'truly enriched' GO
term within a cluster, one may have to look for such GO terms
manually. During manual searching, one must deal with
other difficulties. For example, what should the cut-off anno-
tation frequency be, and what should the cut-off P values be?
The decision is further complicated by the fact that the
enrichment P values also depend on the cluster size, and so a
comparison of the average P values from two clusters with dif-
ferent sizes would be invalid.
Evaluating P values of individual GO terms ignores the rela-
tionship between the enriched GO terms, which may be more
informative than the P values per se. In the above example of
glycolysis/gluconeogenesis pathway, an experience biochem-
ist would discern the relationship among the functions
described by those lower frequency GO terms because the
proteins with these functions are involved in a biologic path-
way. That biochemist would thus reason that the co-occur-
rence of these terms within a single cluster conveys more
information than the individual P values, which essentially
carry no information in this case. Thus, it is more important
to identify the higher level abstraction of protein functions
rather than simply counting the GO terms or averaging P val-
ues. Preferably, one would like to see that a GO term that
summarizes the abstract concept of a group of proteins is
enriched in the cluster. Indeed, the glycolysis/gluconeogene-
sis pathway cluster does contain a GO term, namely
GO:0006096 (glycolysis). This term is associated with 14 pro-
teins in the genome, and all of them are observed in this
KEGG cluster, which should be considered as significantly
enriched in the cluster.
It is desirable that all genes are consistently annotated with
such a common summarizing GO term, allowing simple eval-
uation of enrichment and a concept summary. However, the
principle adopted by the GO Consortium is to annotate pro-
teins with GO terms as specific as possible, based on available
knowledge [4]. Thus, most functionally coherent clusters may
not have such a summarizing GO term, but contain a collec-
tion of specific terms. To address such difficulty, one may
search, manually or automatically, for a GO term that sum-
marizes the information conveyed by the observed specific
GO terms. Alternatively, one can directly identify the abstract
biologic concept from the literature associated with proteins
and use such information to evaluate their functional coher-
ence, without searching for such a 'right' summary GO term.
The latter approach will enable us to avoid the annotation
bottleneck and the sparse, inconsistent annotation problems.
Associating proteins with biological concepts
In a previous study we reported the results of identifying/
extracting biologic concepts from a protein related corpus
from the GO annotation (GOA) [16], using the latent Dirichlet
allocation (LDA) model [17]. The results demonstrated that
the LDA model was capable of extracting biologically mean-
ingful concepts from the GOA corpus. In essence, a 'topic'
identified by the LDA model is a word usage pattern that cap-
tures the co-occurrence of words during discussion of con-
cepts and often reflects the abstract concepts conveyed by
these words. We applied Bayesian model selection to deter-
mine how many topics were suitable to represent the corpus,
by choosing the model that fits the corpus with the highest
posterior probability P(M|D), where M denotes a model and
D the observed data. A model with 300 topics was found to fit
the data well. After inspecting the words associated with the
topics extracted using the LDA model, we further removed
some topics that did not convey specific biologic concepts but
were instead generic (see our supplementary website for the
list [18]). A total of 229 topics were retained to construct the
ProtSemNet [18].
The LDA model can be used to infer the topic to which each
word in a document belongs. Thus, the semantic content of a
document can be represented as the presence of topics in that
document, and the strength of the topics can be estimated
through counting the words belonging to a given topic. See
Figure 3 of our previous report [17] for an example of a
MEDLINE abstract in which the latent topics for each word is
inferred by a LDA model. With such information available, we
were able to connect proteins with the semantic topics based
on the MEDLINE documents associated with them. Further-
more, the strength of association between a protein and a
topic can be represented as the number of words assigned to
the topic among all of the documents associated with the pro-
tein. Combining the associations between the proteins and
the semantic topics, we constructed a protein-topic associa-
tion matrix, A, which can be treated as an adjacency matrix of
a weighted, undirected bipartite graph consisting of proteins
and topics. We refer to such a graph as a protein semantic net-
work (ProtSemNet). On this network, proteins are connected
to each other only through the share biologic concepts, and
therefore the proteins sharing similar functions tend to be
closely located or strongly connected on the graph.
Genome Biology 2007, Volume 8, Issue 7, Article R153 Zheng and Lu R153.5
comment reviews reports refereed researchdeposited research interactions information
Genome Biology 2007, 8:R153
ProtSemNets and their properties
We have constructed multiple ProtSemNets consisting of pro-
teins from three well studied species - human, mouse, and
yeast - using the proteins from these species. (See Materials
and methods, below, for detailed description of the proce-
dures.) The numbers of human, mouse, and yeast proteins
contained in the GOA corpus are 7,906, 14,737, and 4,619,
respectively. In addition to these species specific Prot-
SemNets, all proteins in the GOA corpus were mapped to the
following unique sets: Cluster of Orthologous Groups (COG)
and Eukaryotic Orthologous Group (KOG) [19]. Then, the
MEDLINE documents associated with the member proteins
of an orthologous group were pooled together, and a unified
ProtSemNet consisting of orthologous clusters and biologic
topics was constructed, which was referred to as the ortholo-
gous ProtSemNet. In order to remove potential noise and
reduce computational cost, the element a
pt
of matrix A, whose
value was less than 5% of the total number of words associ-
ated with a given protein p (the sum of p
th
row of A), was set
to 0, which is equivalent to removing the edge between pro-
tein p and topic t. When constructing the ProtSemNet, we
specified the semantic distance of an edge to be the inverse of
a
pt
, such that the stronger the association between topic and
protein, the shorter the distance of the edge. As expected,
when connected with thousands of proteins, the 229 biologic
topics in the ProtSemNet look like hubs with multiple pro-
teins associated. On the orthologous ProtSemNet, the average
degree of connectivity for the biologic topic vertices is 219,
whereas the average degree of connectivity for protein verti-
ces is 5.
Metrics for evaluating functional coherence of a group
of proteins
The assumption underlying our approach of evaluating the
functional coherence of a group of proteins is that the bio-
medical literature describing proteins with similar functions
should share similar biologic topics, and therefore these pro-
teins should be closely connected on the ProtSemNet. There-
fore, the 'closeness' of the proteins on the ProtSemNet graph
can be used as a metric for evaluating the functional coher-
ence of the group. Given a ProtSemNet, one can extract a sub-
graph connecting any arbitrary group of proteins, provided
that they are represented in the graph, such that the total
semantic distance of the subgraph is shortest. A subgraph sat-
isfying such a requirement is a tree, and the problem of iden-
tifying such a tree is referred to as the Steiner tree problem
[20]. With a Steiner tree for a group of available proteins, we
designed two metrics as the group functional coherence score
(GFCS): the total number of edges of the Steiner tree, referred
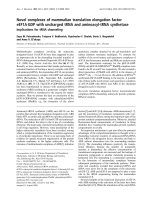
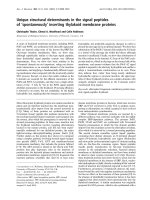
Distributions of GFCS scoresFigure 2
Distributions of GFCS scores. Showsn are plots of the the histograms of
(a) GFCSd and (b) GFCSe scores from 1,000 random clusters, each
containing 50 proteins, drawn from the mouse ProSemNet. GFCS, group
functional coherence score.
0
40
80
12 0
16 0
200
66.67.27.88.49
GFCSd
Frequency
(a)
0
40
80
12 0
16 0
200
83 92 101 110 119 128
GFCSe
Frequency
(b)
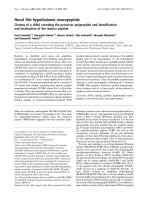
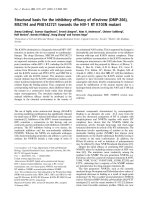
Relationship between groups size and GFCSFigure 3
Relationship between groups size and GFCS. GFCS, group functional
coherence score.
0
3
6
9
12
10 40 70 100
GFCSd
0
10 0
200
300
400
10 4 0 7 0 10 0
Group size (
N)
GFCSe
(a)
(b)
R153.6 Genome Biology 2007, Volume 8, Issue 7, Article R153 Zheng and Lu />Genome Biology 2007, 8:R153
to as GFCSe; and the total semantic distance of the Steiner
tree, referred to as GFCSd. The interpretation of the values is
as follows; a small value for GFCSe (or GFCSd) indicates close
(or strong) connections among the proteins in the group.
Based on the assumption that a functionally related group of
proteins should be located closely on a ProtSemNet, one
would expect that the scores for such a group of proteins
would be significantly different from those of the protein
groups consisting of randomly picked proteins from the same
ProtSemNet. Thus, statistical methods can be developed to
compare the significance of the scores of a group of interest
with the scores of randomly picked protein groups. More spe-
cifically, we should like to evaluate whether the GFCS scores
from a cluster of interest are statistically significantly smaller
than those from the randomly picked protein groups. To this
end, one can think of the random GFCS scores as being deter-
mined by a distribution, and statistical inference approaches
can be applied to estimate the parameters for the distribution.
Once the distribution for the random score of a given Prot-
SemNet and a given cluster size is defined and the estimated
parameters are available, one can access the statistical signif-
icance of the GFCS score from any arbitrary protein group
from the ProtSemNet with respect to the random score distri-
bution. Estimation of parameters can be achieved through a
simulation process in which a large number of random pro-
tein groups can be generated and used as the samples for esti-
mating the distribution parameters. Note that a GFCS score
distribution is not only specific for a given ProtSemNet but it
is also specific to a given cluster size, and therefore the esti-
mation process should accommodate different distributions
and take the cluster size into account.
To estimate the parameters for the random GFCS score distri-
butions, we have randomly drawn protein groups of various
sizes from a ProtSemNet of interest. For each cluster size, say
50 proteins, we collect 1,000 random protein groups. There-
fore, the scores from these groups can be treated as samples
from the random score distribution, and the parameters for
such a distribution can be estimated based on these samples
(see Materials and methods, below, for details). Figure 2
shows the distribution of the GFCSe and GFCSd for 1,000
protein groups consisting of 50 orthologous proteins ran-
domly picked from the orthologous ProtSemNet. The distri-
butions for the scores closely follow the shape of the normal
distribution. This phenomenon is due to the fact that the
GFCSs are the sums of the weights of many edges and, accord-
ing to the central limit theorem [21], such a variable will be
assume a normal distribution if the number of edges is suffi-
ciently large. Thus, the probability of observing a given score
or less, the P value, can be determined according to a normal
distribution with estimated mean and variance.
To correct for the dependence of GFCSs on cluster size, a lin-
ear regression model is estimated for each of the four Prot-
SemNets to capture the relationship between each of GFCSs
and the group size N. Figure 3 shows the linear relationship
between group size and the GFCSe and GFCSd for random
groups from the orthologous ProtSemNet, with regression
coefficients (R
2
) of 0.9998 and 0.9955, respectively. The
results indicate a good linear relationship exists between clus-
ter size N and GFCSs, and all four ProtSemNets exhibit strong
linear relationships with varying estimated parameters.
GFCSs as metrics evaluating functional coherence
To test whether GFCSs can correctly differentiate the coher-
ent protein groups from randomly picked groups, we selected
30 pathways for human, mouse, and yeast from the KEGG
database [15] as the functionally coherent protein clusters
and evaluated whether their GFCSs are significantly different
from the distributions for the random protein groups. The
GFCSs for the KEGG clusters were evaluated using both the
species specific ProtSemNets and the orthologous Prot-
SemNet. Table 2 shows the results for 12 KEGG pathways for
which the GFCSs are determined from the species specific
ProtSemNets, and additional results for all groups are availa-
ble at our supplementary website [18]. From Table 2, we can
see that if a P value of 0.05 is deemed significant, then all
KEGG groups have statistically significant GFCSe scores,
indicating that the method has correctly detected that the
members of these groups are not randomly picked from the
network.
On the other hand, although most of the GFCSd scores are
significant, there are four groups whose scores are not signif-
icant. We further investigated the results for one of these
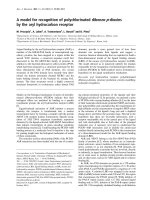
pathways, the ribosome pathway (KEGG sce03010). As
shown in Figure 4, the LDA correctly identified that the con-
cept 'ribosome' was the major topic for the proteins in this
group. Therefore, most proteins formed a cluster around this
topic in the Steiner tree. To further investigate why the
GFCSd score for this tight group is nonsignificant, we traced
all the proteins and their associated MEDLINE records. We
noticed that most of proteins in this pathway are associated
with only one MEDLINE record; thus, the total number of
words associated with the major topics for these proteins tend
to be smaller than most protein-topic associations. Recall that
the semantic distance, w
pt
, of a protein p to a biological topic
t is calculated as the inverse of the number of words in the
documents associated with the protein and the topic. Thus, if
the number of documents associated with a protein is small,
then the semantic distance tends to be large. This indicates
that the GFCSd is highly sensitive to the number of docu-
ments and, in turn, the number of words associated with a
given protein in the GOA corpus. We conjecture that one rea-
son for such imbalanced annotation is that the annotators do
not cite all of the papers for the proteins with well known
function, rather than resulting from a lack of documents
describing the proteins. Such bias can be avoided by develop-
ing a technique to associate proteins automatically with the
relevant literature or to devise a normalized semantic dis-
tance metric. We have not fully investigated the other three
Genome Biology 2007, Volume 8, Issue 7, Article R153 Zheng and Lu R153.7
comment reviews reports refereed researchdeposited research interactions information
Genome Biology 2007, 8:R153
nonsignificant clusters, but we conjecture that the same rea-
soning might account for the nonsignificant P values.
We further used the sensitivity, specificity, and receiver oper-
ating characteristic (ROC) analysis [22] to evaluate the dis-
criminative power of the GCFSs obtained from the species
specific ProtSemNet. For this experiment we randomly draw
30 protein groups, with sizes similar to those from KEGG
pathways, from the human, mouse, and yeast ProtSemNet,
respectively. If the significance threshold P value is set at
0.05, the sensitivity and specificity for GFCSe are 0.97 and
1.0, respectively, and the sensitivity and specificity for GFCSd
are 0.73 and 1.0, respectively. Using random groups as nega-
tive cases and the KEGG pathway groups as positive cases, we
progressively set the significance threshold at 1 × e
-4
, 1 × e
-3
, 5
× e
-3
, 1 × e
-2
, and 5 × e
-2
to perform ROC analysis. Figure 5
shows the ROC curves for both GFCSe and GFCSd. The
results indicate that the metrics have excellent discriminative
power, with the area under the ROC curve being 0.98 and
0.86 for GFCSe and GFCSd, respectively.
Pooling knowledge from multiple species
Our results indicate that the GFCSs, especially the GFCSe,
obtained from the species specific ProtSemNet are capable of
distinguishing the functionally coherent (nonrandom) pro-
tein groups from the randomly produced protein groups.
Beyond the species specific ProtSemNet, we believe that it
would be advantageous to use the ProtSemNet as a tool to
pool knowledge from different species and use the collective
information to evaluate protein functional coherence. The
key advantage is that it will allow us to evaluate the functional
coherence of the proteins from species that are not well stud-
ied, through mapping them to orthologous clusters. We con-
structed an orthologous cluster ProtSemNet and re-evaluated
the GFCSs for the protein groups (see Materials and methods,
below, for details). Table 3 shows the scores and P values eval-
uated using the orthologous ProtSemNet for the same
pathways in Table 2. It is notable that P values for many
GFCSd become more significant (decrease), indicating that
pooling information alleviated the bias caused by sparse
annotation and strengthened the relationships among the
protein and semantic topics. Although the P values for the
GFCSe scores do not diminish uniformly, the score retains the
discriminative power because all of the P values for the KEGG
pathways are statistically significant.
Table 2
GFCS evaluated from species-specific ProtSemNet
KEGG pathway GFCSe P GFCSd P
Apoptosis (hsa04210) 86 9.35 × e
-8
5.36 1.59 × e
-8
Glycolysis (hsa00010) 68 1.62 × e
-10
7.29 0.84
a
Focal adhesion (hsa04510) 174 1.56 × e
-14
12.48 7.51 × e
-5
JAK-STAT (hsa04630) 147 2.52 × e
-27
12.11 1.56 × e
-05
ATP synthesis (mmu00190) 33 3.01 × e
-08
3.42 1.17 × e
-04
Calcium signaling (mmu04020) 102 0.04 9.24 2.91 × e
-6
Actin regulation (mmu04810) 122 3.37 × e
-5
7.47 6.48 × e
-13
Cytokine receptor (mmu04060) 176 1.65 × e
-39
15.62 0.99
a
Purine metabolism (sce00230) 111 3.69 × e
-4
8.33 0.34
a
MAPK (sce04010) 78 5.65 × e
-8
3.15 5.61 × e
-8
Ribosome (sce03010) 113 1.61 × e
-26
16.58 0.999
a
Oxidative phosphorylation (sce00190) 74 1.6 × e
-12
5.42 0.001
GFCS, group functional coherence score; JAK, Janus kinase; KEGG, Kyoto Encyclopedia of Genes and Genomes; MAPK, mitogen-activated protein
kinase; ProtSemNet, protein semantic network; STAT, signal transducer and activator of transcription.
a
Non-significant P value.
The Steiner tree of the yeast ribosome pathwayFigure 4
The Steiner tree of the yeast ribosome pathway. A protein is represented
a circle while a topic is represented as a box. Topic 222 is related to
ribosome.
R153.8 Genome Biology 2007, Volume 8, Issue 7, Article R153 Zheng and Lu />Genome Biology 2007, 8:R153
Connecting topics with proteins
Figure 6 shows examples of the Steiner trees for a randomly
selected group of 50 proteins (panel a) and for the human
apoptosis pathway (panel b) extracted from the human Prot-
SemNet. Panel b shows that proteins in the human apoptosis
pathway tend to form clusters around the topics, especially
four topics, namely 175, 173, 217, and 19, which have more
than five associated proteins. By checking the high probabil-
ity words for these topics, they can be summarized as follows:
apoptosis for topic 175; phosphoinositide 3-kinase for 173;
tumor necrosis factor pathway for 217; and platelet-derived
growth factor pathway for 19. Interestingly, protein Akt1
(indicated by an arrow in Figure 6b) connects three major
topics in this group, which agrees well with biologic knowl-
edge. Thus, the Steiner tree extracted from the ProtSemNet
not only clusters the proteins with similar functions but also
brings related biologic topics together. In fact, we found that
many proteins within a functionally coherent group are more
likely to serve as bridges between topics within the Steiner
tree and random groups (data not shown).
Discussion
In a cell, multiple proteins usually work closely to perform
cellular functions, for example proteins in a metabolic path-
way. One major research area in bioinformatics focuses on
identifying such protein 'modules' based on functional
genomic or proteomic data via computational approaches.
Once a tentative module is identified, it is imperative to eval-
uate whether the members of this module really are function-
ally connected and worthy of further investigation. In this
study, we designed and evaluated novel metrics with which to
evaluate the functional coherence of a group of proteins.
These metrics take into account not only the common shared
functions of a group of proteins but also the relationships
among these functions via a network analysis approach.
Connecting proteins through biologic concepts
By extracting the biologic concepts from the literature associ-
ated with proteins and constructing ProtSemNets, our
method effectively connects proteins through their shared
functions. The bipartite network not only groups proteins
according to function description, but it also establishes con-
nections between biologic concepts via proteins. Connecting
proteins via biologically meaningful semantic topics in the lit-
erature has the following advantages. First, it allows us to
evaluate the 'functional closeness' of proteins without requir-
ing them to interact physically, which is sensible in that pro-
teins involved in a pathway do not necessarily bind to each
other physically. Second, it does not require proteins to be co-
mentioned within the same biomedical article in order to
ROC curves for GFCSe and GFCSdFigure 5
ROC curves for GFCSe and GFCSd. GFCS, group functional coherence
score; ROC, receiver operating characteristic.
GFCSe
GFCSd
0
0.2
0.4
0.6
0.8
1
00.20.40.60.81
1-specificity
Sensitivity
Table 3
GCFS evaluated from the orthologous ProtSemNet
Protein pathway GFCSe P GFCSd P
Apoptosis (hsa04210) 72 2.54 × e
-10
0.77 3.12 × e
-9
Glycolysis (hsa00010) 54 0.0062 0.83 4.50 × e
-4
Focal adhesion (hsa04510) 99 1.66 × e
-7
0.58 1.34 × e
-14
JAK-STAT (hsa04630) 153 2.19 × e
-07
3.11 7.48 × e
-11
ATP synthesis (mmu00190) 71 2.14 × e
-4
0.83 4.28 × e
-07
Calcium signaling (mmu04020) 76 4.43 × e
-8
0.40 1.16 × e
-12
Actin regulation (mmu04810) 80 0.0089 0.53 7.45 × e
-9
Cytokine receptor (mmu04060) 199 2.63 × e
-8
4.51 4.44 × e
-12
Purine metabolism (sce00230) 130 2.07 × e
-4
2.57 6.92 × e
-19
MAPK (sce04010) 101 0.0069 1.76 1.76 × e
-05
Ribosome (sce03010) 102 9.50 × e
-25
7.19 0.471
a
Oxidative phosphorylation (sce00190) 92 1.41 × e
-6
2.87 0
GFCS, group functional coherence score; JAK, Janus kinase; MAPK, mitogen-activated protein kinase; ProtSemNet, protein semantic network; STAT,
signal transducer and activator of transcription.
a
Non-significant P value.
Genome Biology 2007, Volume 8, Issue 7, Article R153 Zheng and Lu R153.9
comment reviews reports refereed researchdeposited research interactions information
Genome Biology 2007, 8:R153
establish connections. Thus, it overcomes a difficulty encoun-
tered by other natural language processing or information
extraction approaches [23] that require proteins to be co-
mentioned in order to establish associations. Third, the mul-
tiple topic nature of the LDA model captures the multifaceted
character of proteins; for example, a protein can be part of an
electron-carrier chain in mitochondria and be involved in the
cellular process of apoptosis. Thus, such proteins provide
connections between biological concepts. Finally, our method
does not require manual annotation like GO does, which can
be a bottleneck to accumulation of knowledge. Also, it over-
comes the limitation of GO that concepts from one domain of
GO (for example, molecular function) cannot be connected to
concepts of other domains (such as cellular component).
The ProtSemNet fulfills both goals of connecting functionally
related proteins through shared functions and bridging the
biologic functions through proteins. As demonstrated in the
example of the human apoptosis pathway (Figure 6b), the
proteins are closely connected by their functional descrip-
tions, such as apoptosis, phosphoinositide 3-kinase, chroma-
tin structure, and tumor necrosis factor pathway.
Furthermore, a Steiner tree consisting of functionally coher-
ent proteins brings several biologically related biological con-
cepts together, for example that activation of the tumor
necrosis factor pathway will activate apoptosis, which
involves destruction of chromatin structure and DNA
fragmentation. Therefore, this approach not only provides a
means with which to evaluate the functional coherence of
proteins but it also explains the connections among the pro-
teins associated with a seemingly wide range of biologic con-
cepts. This approach overcomes the shortcomings of current
methods that treat the enrichment of protein functions within
a group as independent [5,6]. Constructing the ProtSemNet
with the orthologous clusters and biologic concepts builds a
foundation for knowledge enhancement, because such a net-
work effectively pools the knowledge regarding orthologous
groups from different organisms. This network allows one to
connect proteins, including those in species that are not well
studied, to biologic concepts and in turn to other proteins,
thus potentially leading to discovery of functions of previ-
ously unknown proteins.
In this study, biologic concepts are automatically extracted
using the LDA model, and a Bayesian model selection
approach was employed to determine the number of topics in
order to avoid overfitting of training data. The extracted top-
ics are well distinguishable, although some of them tend to
represent high level concepts. One advantage of extracting
biologic concepts in an automatic (unsupervised) manner is
the avoidance of expensive manual construction of a protein
semantic network, and the automatic approach potentially
provides more consistent associations between proteins and
biologic concepts. However, because the approach is unsu-
pervised, the quality of the ProtSemNet is limited by the qual-
ity and granularity of the semantic topics extracted by the
LDA model.
Determining the functional coherence
Once a ProtSemNet is constructed, either a species specific or
an orthologous ProtSemNet, it allows us to evaluate the com-
pactness of the subgraph connecting a group of proteins with
unified scores and, more importantly, to determine the statis-
tical significance of the functional coherence scores. Based on
the experimental results presented here, we believe that the
GFCSe is a more sensitive and robust metric than is GFCSd.
The GFCSe can correctly capture strong connections between
a protein and its major topics. Furthermore, the quantity of
the score is not sensitive to variance in the number of docu-
ments associated with a given protein. Such variance can be
introduced due to the availability of literature and/or the
Steiner trees for random and KEGG protein groupsFigure 6
Steiner trees for random and KEGG protein groups. The biologic topics
are represented by square vertices, whereas proteins are represented by
circle vertices. (a) A Steiner tree of a random protein group. (b) The
Steiner tree of human apoptosis pathway proteins. KEGG, Kyoto
Encyclopedia of Genes and Genomes.
(a)
(b)
R153.10 Genome Biology 2007, Volume 8, Issue 7, Article R153 Zheng and Lu />Genome Biology 2007, 8:R153
biases in annotating proteins (some proteins are annotated
more extensively than others). The GFCSd appears to fall prey
to such variance and fails to identify the group of proteins that
are known to be functionally coherent. However, if automatic
information retrieval techniques are employed to identify
large amounts of biomedical literature associated with pro-
teins, then this problem can potentially be alleviated. In addi-
tion, we have also observed that many proteins in the KEGG
pathways do not have GO annotations in the GOA data, and
so they are not represented in the ProtSemNet. These obser-
vations indicate that the current manually annotated data-
bases can not keep up with the rate of accumulation of
biomedical knowledge, and there is a need for more extensive
and automatic information retrieval methods to systemati-
cally associate proteins with biomedical literature for com-
prehensive representations of biomedical knowledge.
Semantic analysis with LDA
In this research, we directly relate proteins to the semantic
concepts from the biomedical literatures and utilize such rela-
tionships to determine the closeness of the semantic informa-
tion of proteins as metrics for evaluating the functional
coherence of any group proteins. Directly utilizing the seman-
tic information from the biomedical literature allows us to
avoid the potential difficulties associated with the sparse
annotation phenomenon and the annotation bottleneck.
Other closely related research utilizing semantic information
to evaluate protein functional coherence is the NDPG metric
proposed by Raychaudhuri and Altman [14]. However, the
lack of available software with which to evaluate NDPG pre-
vents us from directly comparing the two methods.
Semantic analysis using LDA model has the following advan-
tages over the conventional semantic analysis. First, it accom-
modates the fact that a protein can be associated with
multiple biologic processes, and so its associated literatures
may consist of multiple topics. This allows proteins that share
a common biologic concept to be closely related on the Prot-
SemNet, without requiring all other biologic aspects of the
proteins to agree. Second, the LDA model allows us to repre-
sent a protein in a semantic concept space, rather than in the
vocabulary space. Such capability allows us to associate pro-
teins as long as their associated literatures share a similar
concept, without requiring the similar composition of words
in the literatures, thus increasing the sensitivity of detecting
connections. Third, our approach provides metrics whose dis-
tributions are well behaved, which enables us to estimate the
statistical significance of the scores.
Conclusion
In this research we demonstrate that the metrics based the
semantic similarity of the biomedical literature associated
with proteins can be used to evaluate the functional coher-
ence of the proteins. We have also demonstrated that the
amount of information represented in the training corpus is
critical to the usefulness of our method. One future direction
of research is to retrieve information beyond the manually
annotated training corpus. With advances in natural lan-
guage processing and information retrieval technologies, it is
possible to retrieve protein related literature, identify the pro-
tein entities, and extract relevant information at a large scale,
and more comprehensive information may provide better
evaluations.
Materials and methods
Evaluation of enrichment of GO annotations
For this experiment, we used the 31 March 2007 version of
GO annotation data for the yeast Saccharomyces cerevisiae
from the GO consortium website. Let M denote the total
number of proteins in this dataset, let K be the number of
times a GO term is observed in the annotation data, let n be
the size of a cluster, and let x be the number times that the GO
term is observed in the cluster. Assuming that x is distributed
as a hypergeometric distribution [21], the probability of
observing x can be evaluated as follows:
Dataset
The GOA annotation data (version 28.0) from the GOA
project [16] were downloaded from the European Bioinfor-
matics Institute. In this dataset, the proteins from the Uni-
prot database [24] are annotated with GO terms. Many of
these GO annotations are associated with a PubMed identifi-
cation number (PMID), indicating sources of information for
the annotations. This dataset provides a bridge between pro-
teins and their associated literature. We extracted 26,084
PMIDs from the dataset and retrieved the corresponding
MEDLINE titles and abstracts through the batch service pro-
vided by the National Center for Biotechnology Information
(NCBI). MEDLINE references totaling 26,084 were retrieved.
There are 39,336 proteins associated with this document set.
The documents were pre-processed by removing 'stop words'
(see our supplementary website [18]) and stemming. There is
a total of 52,350 unique terms in this corpus. We trimmed
this vocabulary by removing terms deemed less relevant to
biology. In order to determine whether a word was relevant to
biology, we calculated the mutual information (MI) of a word
with respect to the GO terms associated with the corpus. The
MI is determined as follows:
Pr( | , , )xMKn
K
x
MK
nx
M
n
=
⎛
⎝
⎜
⎞
⎠
⎟
−
−
⎛
⎝
⎜
⎞
⎠
⎟
⎛
⎝
⎜
⎞
⎠
⎟
MI w g p w g
pwg
pwpg
wg
(,) (,)
(,)
()()
,{,}
=
∈
∑
log
01
Genome Biology 2007, Volume 8, Issue 7, Article R153 Zheng and Lu R153.11
comment reviews reports refereed researchdeposited research interactions information
Genome Biology 2007, 8:R153
where p(w,g) is estimated by counting the documents in
which a word w and a GO term g are present or absent (1 or
0, respectively). The biologic relevance of a word is deter-
mined as its maximal MI with respect to any GO term. When
the words were sorted in descending order according to their
MI, we found that words with low MI tended to be either very
common or very rare words. The final vocabulary list con-
tained 18,725 unique terms. The corpus is hereafter referred
to as the GOA corpus.
Extracting semantic topics using the LDA model
We applied the LDA [17,25,26] to extract a set of common bio-
logic concepts from the GOA corpus. The LDA is a latent var-
iable model, treating a document as a mixture of words from
multiple topics. It simulates the process of 'generating' a text
document with following steps. First, choose a T dimensional
topic content vector θ, which is a parameter vector for a multi-
nomial distribution, from a Dirichlet distribution with
parameter α, where T is the number of topics. Second, for the
n
th
word in the document, choose a topic z
n
from a multino-
mial distribution governed by θ. Third, conditioned on its
topic z
n
, choose the word w
n
from a multinomial distribution
governed by a parameter vector ϕ
zn
. Finally, the parameters ϕ
are distributed as Dirichlet governed by β. Provided with a
collection of text documents, the LDA can infer the latent
topic variable for each word and extract the word usage pat-
terns ϕ, which closely relate to human-understandable topics.
Furthermore, for each word w in the corpus, the LDA model
infers its latent topic variable z using a Gibbs sampling algo-
rithm described in detail elsewhere [17,25]. We further
applied a Bayesian model selection approach [17,25] to deter-
mine the 'optimal' number of topics that represent the corpus
well. Thus, after inference of the topic assignment of each
word in a document, the semantic contents of the document
can be represented with counts of words for each topic.
Mapping proteins to orthologous groups
In order to pool the knowledge accumulated from different
organisms, we map proteins from different organisms to a
unified set of orthologous clusters. An orthologous group of
proteins consists of proteins from different species that
evolved from a common ancestor. Usually, the orthologous
proteins have the same or similar functions. The STRING
database [27] maintains information on interacting proteins,
in which interactions are defined as either direct physical
binding or participation in a common pathway. In addition, it
also assigns each protein in the database to the cluster of
orthologous group (COG) [19] or the eukaryotic orthologous
group (KOG).
To map the proteins associated with the GOA corpus to COG/
KOG, the following steps are taken. First, the COG/KOG id
was retrieved if the protein of interest was in the STRING
database. Second, if the protein of interest was not in the
STRING database, then a BLAST search against the STRING
database was performed to find the most similar sequences,
and these COG/KOG ids was transferred to the protein. The
criteria to assign a protein to a COG/KOG were adopted from
the STRING database [27], in which the protein sequence
should have a significant BLASTP e-value (≤10
-6
) with entry
proteins in STRING and the first three hit sequences should
have the same COG/KOG id. Finally, if none of above condi-
tions was satisfied, then a protein was treated as a sole mem-
ber of a new orthologous group, and this new group was
added to the collection of orthologous groups. As a result, the
union of the observed COG/KOG and the newly assigned
groups constitute a total of 12,101 orthologous protein
groups, and all 36,151 proteins from the GOA corpus were
assigned to one of these groups.
Constructing a protein semantic network
In the GOA corpus, each document is associated with one or
more proteins. With the biologic topics in the documents
being inferred by the LDA semantic analysis, associations
between the biological semantic topics and the proteins can
be established. A P × T matrix protein semantic topic associ-
ation matrix A was constructed such that the element a
pt
rep-
resents the count of words that are assigned to the topic t in
all the documents associated with the protein p. The matrix A
can be thought of as an adjacency matrix for a bipartite graph.
A bipartite graph consists of two types of vertices, such that
only the edges connecting vertices of different types are
allowed, but not edges joining vertices of the same type. In
our case, the two types of vertices are proteins and biologic
concepts. We used the matrix A to construct a weighted
undirected bipartite graph G = (V, E, W). In this graph, the
vertex set V consists of the union of proteins and biologic top-
ics, the edge set E consists of connections between proteins
and topics, and the weight set W consists of weights (dis-
tance) associated with the edges. We define an edge between
a protein p and a topic t if the element a
pt
of matrix A is
nonzero. The weight of the edge w
pt
is defined as the inverse
of a
pt
, which is referred to as semantic distance between the
protein and the topic. That is, the more words associating a
protein to a topic, the shorter the distance between the two
vertices. We refer to such a bipartite graph as a protein
semantic network (ProtSemNet).
Steiner tree and group functional coherence score
For a weighted undirected graph G = (V, E, W), consisting of
a collection of vertices V, and a set of edges E and their asso-
ciated weights W, the Steiner tree problem is defined as fol-
lows. Given a subset of vertices V
s
of G, return a subgraph G
s
such that all the vertices in V
s
are connected by G
s
and the
total length of G
s
is the minimum among all possible sub-
graphs connecting V
s
. By the latter requirement, G
s
will be a
tree with vertices of interest being the leaf nodes. The Steiner
tree problem is an NP complete problem, but numerous
approximate algorithms are available.
In this study, Kou's algorithm [20] was adopted to extract an
approximate Steiner tree. The outline of the algorithm is as
R153.12 Genome Biology 2007, Volume 8, Issue 7, Article R153 Zheng and Lu />Genome Biology 2007, 8:R153
follows. First, given a set of proteins, find all pair-wise short-
est paths on the ProtSemNet between all possible pairs of the
proteins of interest. Construct a complete undirected weight
graph G
comp
, in which a protein is fully connected to the rest
of the group. Second, find the minimal spanning tree T
c
of
G
comp
. Third, construct a graph, G
s
, by replacing the edges of
T
c
with the corresponding path in the ProtSemNet. Fourth,
find the minimal spanning tree, T
s
, of G
s
by repeating step 2.
Fifth, construct a Steiner tree, T
st
, from T
s
by removing unnec-
essary edges in T
s
, so that all the leaves of T
st
are in the set of
proteins of interest.
With a Steiner tree for a group of available proteins, the
number of edges and the total distance of the tree are used as
two metrics for the group functional coherence scores,
referred to as GFCSe and GFCSd, respectively, or collectively
as GFCSs. Note that the smaller the GFCSs, the more com-
pactly connected is the group of proteins, and the more func-
tionally coherent is the group.
Evaluating statistical significance of a GFCS
When a ProtSemNet is constructed, the samples of random
protein groups were drawn from the proteins on the graph
and the Steiner tree for each random group were extracted.
For each group size, ranging from 10 to 150, with a step of 5,
a collection of 1,000 random groups was sampled. The corre-
sponding Steiner trees and their GFCSs were collected. For a
given group size, these 1,000 samples were used to estimate
means and variances of the GFCSs. Furthermore, because a
GFCS is dependent on the group size N, linear regression
models between the group size N versus the means of GCFSe
and GFCSd were estimated. With the estimated regression
parameter available, the expected mean GFCS for a random
group with a given size N can be determined using the linear
equation and the variance of the sample group with the size
N* closest to N.
When a new GFCS* of a group of proteins with group size N*
is given, we calculated the probability of the observing GFCS*
or less if it was drawn from the population of the random pro-
tein groups with the same group size - the P values for the
GFCS*. According to the central limit theorem, the sum of N
random independent variables from any arbitrary distribu-
tion will be asymptotically distributed as a normal distribu-
tion as N approaches infinity. Thus, the P value of observing
GFCS* from a population of random proteins can be approx-
imately determined according to a normal distribution func-
tion, provided with a mean and variance of the distribution.
Supplementary data
Supplementary data are available from our website [18].
Acknowledgements
This work is partially supported by the grants from NLM and NCRR of
NIH: 1R01LM009153-01A1, 5T15LM007438, and P20 RR017677. The
authors would like to thank the anonymous reviewers for their construc-
tive critiques and suggestions for improving the paper.
References
1. Lu X, Hauskrecht M, Day RS: Modeling cellular processes with
variational Bayesian cooperative vector quantizer model. In
Proceedings of the Pacific Symposium on Biocomputing; 6-10 January 2004;
Big Island, Hawaii Hackensack, NJ: World Scientific Publishing
Company; 2004:533.
2. Segal E, Friedman N, Koller D, Regev A: A module map showing
conditional activity of expression modules in cancer. Nat
Genet 2004, 36:1090-1098.
3. Eisen MB, Spellman PT, Brown PO, Botstein D: Cluster analysis
and display of genome-wide expression patterns. Proc Natl
Acad Sci USA 1998, 95:14863-14868.
4. Ashburner M, Ball CA, Blake JA, Botstein D, Butler H, Cherry JM,
Davis AP, Dolinski K, Dwight SS, Eppig JT, et al.: Gene ontology:
tool for the unification of biology. The Gene Ontology
Consortium. Nat Genet 2000, 25:25-29.
5. Khatri P, Draghici S: Ontological analysis of gene expression
data: current tools, limitations, and open problems. Bioinfor-
matics 2005, 21:3587-3595.
6. Curtis RK, Oresic M, Vidal-Puig A: Pathways to the analysis of
microarray data. Trends Biotechnol 2005, 23:429-435.
7. Lord PW, Stevens RD, Brass A, Goble CA: Semantic similarity
measures as tools for exploring the gene ontology. Pac Symp
Biocomput 2003:601-612.
8. Guo X, Liu R, Shriver CD, Hu H, Liebman MN: Assessing semantic
similarity measures for the characterization of human regu-
latory pathways. Bioinformatics 2006, 22:967-973.
9. Balasubramanian R, LaFramboise T, Scholtens D, Gentleman R: A
graph-theoretic approach to testing associations between
disparate sources of functional genomics data. Bioinformatics
2004, 20:3353-3362.
10. Alexa A, Rahnenfuhrer J, Lengauer T: Improved scoring of func-
tional groups from gene expression data by decorrelating
GO graph structure. Bioinformatics 2006, 22:1600-1607.
11. Verspoor K, Cohn J, Joslyn C, Mniszewski S, Rechtsteiner A, Rocha
LM, Simas T: Protein annotation as term categorization in the
gene ontology using word proximity networks.
BMC
Bioinformatics 2005:S20.
12. Homayouni R, Heinrich K, Wei L, Berry MW: Gene clustering by
latent semantic indexing of MEDLINE abstracts. Bioinformatics
2005, 21:104-115.
13. Khatri P, Done B, Rao A, Done A, Draghici S: A semantic analysis
of the annotations of the human genome. Bioinformatics 2005,
21:3416-3421.
14. Raychaudhuri S, Altman RB: A literature-based method for
assessing the functional coherence of a gene group. Bioinfor-
matics 2003, 19:396-401.
15. Kanehisa M, Goto S, Kawashima S, Okuno Y, Hattori M: The KEGG
resource for deciphering the genome. Nucleic Acids Res
2004:D277-D280.
16. Camon E, Barrell D, Lee V, Dimmer E, Apweiler R: The Gene
Ontology Annotation (GOA) Database: an integrated
resource of GO annotations to the UniProt Knowledgebase.
In Silico Biol 2004, 4:5-6.
17. Zheng B, McLean DC Jr, Lu X: Identifying biological concepts
from a protein-related corpus with a probabilistic topic
model. BMC Bioinformatics 2006, 7:58.
18. ProtSemNet [ />19. Tatusov RL, Fedorova ND, Jackson JD, Jacobs AR, Kiryutin B, Koonin
EV, Krylov DM, Mazumder R, Mekhedov SL, Nikolskaya AN, et al.:
The COG database: an updated version includes eukaryotes.
BMC Bioinformatics 2003, 4:41.
20. Kou L, Markowsky G, Berman L: A fast algorithm for Steiner
tree. Act Informatica 1981, 15:141-145.
21. DeGroot MH, Schervish MJ: Probability and Statistics 3rd edition. Add-
ison-Wesley; Boston, MA, USA; 2002.
22. Bradley AP: The use of the area under the ROC curve in the
evaluation of machine learning algorithms. Pattern Recognition
1997, 30:1145-1159.
23. Hoffmann R, Krallinger M, Andres E, Tamames J, Blaschke C, Valencia
A: Text mining for metabolic pathways, signaling cascades,
and protein networks.
Sci STKE 2005, 2005:pe21.
Genome Biology 2007, Volume 8, Issue 7, Article R153 Zheng and Lu R153.13
comment reviews reports refereed researchdeposited research interactions information
Genome Biology 2007, 8:R153
24. Bairoch A, Apweiler R, Wu CH, Barker WC, Boeckmann B, Ferro S,
Gasteiger E, Huang H, Lopez R, Magrane M, et al.: The Universal
Protein Resource (UniProt). Nucleic Acids Res 2005:D154-D159.
25. Griffiths TL, Steyvers M: Finding scientific topics. Proc Natl Acad
Sci USA 2004:5228-5235.
26. Blei D, Ng A, Jordan M: Latent Dirichlet allocation. J Machine
Learning Res 2003, 3:993-1022.
27. von Mering C, Jensen LJ, Snel B, Hooper SD, Krupp M, Foglierini M,
Jouffre N, Huynen MA, Bork P: STRING: known and predicted
protein-protein associations, integrated and transferred
across organisms. Nucleic Acids Res 2005:D433-D437.