Báo cáo y học: "Identification of candidate predictive and surrogate molecular markers for dasatinib in prostate cancer: rationale for patient selection and efficacy monitoring" doc
Bạn đang xem bản rút gọn của tài liệu. Xem và tải ngay bản đầy đủ của tài liệu tại đây (1.26 MB, 11 trang )
Genome Biology 2007, 8:R255
Open Access
2007Wanget al.Volume 8, Issue 11, Article R255
Research
Identification of candidate predictive and surrogate molecular
markers for dasatinib in prostate cancer: rationale for patient
selection and efficacy monitoring
Xi-De Wang, Karen Reeves, Feng R Luo, Li-An Xu, Francis Lee,
Edwin Clark and Fei Huang
Address: Pharmaceutical Research Institute, Bristol-Myers Squibb, Princeton, New Jersey, 08543, USA.
Correspondence: Xi-De Wang. Email: , Fei Huang. Email:
© 2007 Wang et al.; licensee BioMed Central Ltd.
This is an open access article distributed under the terms of the Creative Commons Attribution License ( which
permits unrestricted use, distribution, and reproduction in any medium, provided the original work is properly cited.
Sensitivity marker for Dasatinib<p>Gene expression profiling was used to identify genes associated with sensitivity to the tyrosine kinase drug Dasatinib in prostate cancer cell lines, revealing a possible Dasatinib efficacy signature in prostate cancer. </p>
Abstract
Background: Dasatinib is a potent, multi-targeted kinase inhibitor that was recently approved for
treatment of chronic myelogenous leukemia resistant to imatinib. To aid the clinical development
of dasatinib in prostate cancer, we utilized preclinical models to identify potential molecular
markers for patient stratification and efficacy monitoring.
Results: Using gene expression profiling, we first identified 174 genes whose expression was highly
correlated with in vitro sensitivity of 16 cell lines and, thus, considered as candidate efficacy
predictive markers. Among these are important prostatic cell lineage markers, cytokeratin 5,
androgen receptor and prostate specific antigen. Our results indicate that 'basal type' cell lines with
high expression of cytokeratin 5 and low expression of androgen receptor or prostate specific
antigen are sensitive to dasatinib. To identify markers as surrogates for biological activity, we
treated cell lines with dasatinib and identified genes whose expression was significantly modulated
by the drug. Ten genes, including that encoding urokinase-type plasminogen activator (uPA), were
found to not only be potential efficacy markers but also to have reduced expression upon dasatinib
treatment. The down-regulation of uPA by dasatinib was drug-specific and correlated with the
sensitivity of cell lines to dasatinib. Furthermore, EphA2, a target of dasatinib, was found to be a
sensitivity biomarker.
Conclusion: Using the gene expression profiling approach and preclinical models, we have
identified prostatic biomarkers that are associated with sensitivity to dasatinib. This study has
provided a basis for clinical evaluation of a potential dasatinib efficacy signature in prostate cancer.
Background
Prostate cancer is the most common type of cancer in men of
western countries. It is estimated that each year about
230,000 men in the United States alone are diagnosed with
prostate cancer and approximately 30,000 die of this disease
[1]. Although targeted therapeutics have shown promise for
cancer patients, their use in treating prostate cancer is still
limited. Current regimens available for prostate cancer
Published: 29 November 2007
Genome Biology 2007, 8:R255 (doi:10.1186/gb-2007-8-11-r255)
Received: 15 June 2007
Revised: 22 October 2007
Accepted: 29 November 2007
The electronic version of this article is the complete one and can be
found online at />Genome Biology 2007, 8:R255
Genome Biology 2007, Volume 8, Issue 11, Article R255 Wang et al. R255.2
patients include conventional surgery, radiation and hormo-
nal therapies for early stage tumors, and taxane-based chem-
otherapy for late stage metastatic tumors [2,3]. There is a
clear unmet medical need to develop targeted therapeutics for
prostate cancer.
Biomarkers can dictate the successful clinical development of
novel anti-cancer drugs and the clinical benefits that patients
can derive from -targeted therapeutics. Using expression of
HER2 as a patient selection criterion has allowed the success-
ful development of trastuzumab, a monoclonal antibody ther-
apy targeting HER2 in breast cancer. Breast cancer patients
identified to over-express HER2 who subsequently receive
this therapy show a significant response rate and profound
clinical benefits [4]. In contrast, failure to identify and use
robust biomarkers in trials for innovative medicines can
result in failed approval and/or dramatically delayed clinical
development [5,6]. Such examples highlight the need in clin-
ical development to identify molecular biomarkers that will
guide patient selection and enable monitoring of drug efficacy
at the molecular level.
Dasatinib is a potent, orally available small molecule inhibitor
that targets multiple cytosolic or membrane-bound tyrosine
kinases, including Src-family kinases (SFKs), Bcr-Abl, c-kit,
platelet-derived growth factor receptor (PDGFR) β and
EphA2 [7,8]. Due to its potency against leukemic cancer cell
lines harboring BCR-ABL mutations [9], the clear and immi-
nent need for overcoming imatinib resistance, and the pro-
found clinical benefit demonstrated in clinical trials,
dasatinib was recently approved for use in chronic myeloge-
nous leukemia and Philadelphia chromosome-positive acute
lymphoblastic leukemia that are resistant or intolerant to
imatinib [10]. In contrast, other targets of dasatinib (for
example, SFKs, EphA2) have yet to be clinically validated.
The involvement of SFKs in a number of cellular processes,
such as cell migration, adhesion and angiogenesis, as well as
participation of SFKs in a number of clinically relevant path-
ways (for example, the epidermal growth factor receptor
(EGFR) pathway) [11,12] have prompted investigations into
the potential use of dasatinib in solid tumors [13]. Such inves-
tigations would, as discussed above, best be supported by the
use of molecular biomarkers.
To support the development of dasatinib for use in prostate
cancer we employed prostate cancer cell lines as preclinical
models to identify molecular biomarkers whose expression
correlated with the sensitivity to dasatinib and could poten-
tially be used as surrogates to monitor the biological effects of
dasatinib in patients. First, we identified candidate predictor
genes with baseline expression levels correlated with sensitiv-
ity to dasatinib. Next we identified genes that were signifi-
cantly modulated by dasatinib treatment. Urokinase-type
plasminogen activator (uPA) was observed to be on both lists,
suggesting it may be a candidate predictive and 'surrogate'
biomarker. Additionally, EphA2, a target of dasatinib, is a
candidate predictor of efficacy in both prostate and breast
cancer. Finally, the observed sensitivity to dasatinib of pros-
tate cancer cell lines with expression of basal cell markers,
together with a similar observation in breast cancer cell lines
[8], suggests a common mechanism of sensitivity to SFKs and
a role of SFKs in epithelial tumors derived from the basal
layer.
Results
Identification of markers correlated with dasatinib
sensitivity
The aim of this study was to identify both predictive and sur-
rogate biomarkers that could potentially assist the clinical
development of dasatinib in prostate cancer. As outlined in
Figure 1a, our strategy was first to identify genes whose base-
line expression levels correlated with drug sensitivity and
passed additional variation requirements to obtain a candi-
date predictive marker list. Then genes whose expression was
modulated by dasatinib in a drug treatment study were iden-
tified and compared to the candidate predictive biomarker
list to identify genes that were not only correlated with drug
sensitivity but also modulated by drug treatment.
The half maximal inhibitory concentration (IC
50
) values of 16
prostate cancer cell lines to dasatinib were determined as
shown in Figure 1b. Based on the IC
50
values, cell lines were
classified into two groups: 11 cell lines with IC
50
values lower
than 200 nM (within the range of dasatinib plasma concen-
trations clinically achieved) were designated as sensitive; and
5 cell lines with IC
50
values greater than or equal to 2 μM
(greater than the highest drug concentration clinically
achieved in plasma) were considered resistant. It is noted that
the sensitivity or resistance of cell lines is not correlated with
their doubling times, as both the sensitive and resistant
groups consist of cell lines that grow fast or relatively slowly.
Baseline gene expression profiling of the 16 cell lines was per-
formed using Affymetrix gene chips. Two statistical tests
(one-way ANOVA and correlation to log
2
IC
50
values) were
performed to identify genes that were differentially expressed
between sensitive and resistant groups (5,961 probe sets with
p < 0.05) and those that were highly correlated with IC
50
(4,575 probe sets with p < 0.05), respectively; 4,248 probe
sets overlapped in these two analyses, suggesting that the cat-
egorization of sensitive and resistant groups reflected well the
sensitivity of the cells (IC
50
) to dasatinib. The list was further
filtered with a requirement for a 10% coefficient of variation
(CV) across all samples and a minimum 3-fold differential
expression between the sensitive and resistant groups, result-
ing in the selection of 213 probe sets. Expressed sequence tags
(ESTs) and duplicate probe sets were further removed to gen-
erate the candidate predictive marker list of 174 genes (Addi-
tional data file 1).
Genome Biology 2007, Volume 8, Issue 11, Article R255 Wang et al. R255.3
Genome Biology 2007, 8:R255
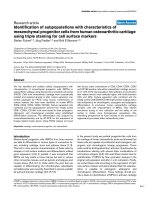
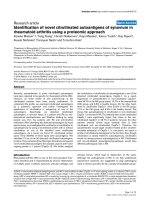
Identification of biomarkers correlated with sensitivity to dasatinibFigure 1
Identification of biomarkers correlated with sensitivity to dasatinib. (a) Discovery strategy to identify potential predictive and surrogate biomarkers. (b)
IC
50
determination and sensitivity classification of 16 prostate cancer cell lines to dasatinib. (c) Cluster analysis showing the relative expression pattern of
174 genes that were highly correlated with dasatinib sensitivity/resistance classification of 16 cell lines. The dasatinib-sensitive cell lines are highlighted in
red, and the position of three important prostatic cell markers, CK5, PSA and AR, are marked on the heatmap. These genes have differential expression of
more than three-fold between the sensitive and resistant groups. (d) Relative baseline gene expression of CK5, PSA and AR in the 16 cell lines. The
resistant cells are in black and the sensitive cells are in red. The values on the x-axes are expression level in log
2
-scale.
- CK5
- PSA
- AR
Genome Biology 2007, 8:R255
Genome Biology 2007, Volume 8, Issue 11, Article R255 Wang et al. R255.4
The expression pattern of these 174 genes on the 16 cell lines
was visualized by cluster analysis. As shown in Figure 1c,
these 16 cell lines were separated into two major groups (the
dasatinib-sensitive cell lines are marked in red). Interest-
ingly, the cell lines in the left cluster were all sensitive to
dasatinib; within the right cluster, DU145, PC3 and LNCaP
cells were also highly sensitive to dasatinib.
Genes of biological interest in Additional data file 1 include
EGFR pathway genes such as amphiregulin and epiregulin,
transforming growth factor pathway genes such as TGF
α
,
TGF
β
2 and TGF
β
RII, as well as other receptor tyrosine
kinases, such as the Met proto-oncogene and fibroblast
growth factor receptor 2. These genes were more highly
expressed in sensitive cell lines. Most strikingly, several
important prostatic cell markers, such prostate specific anti-
gen (PSA; also known as kallikrein 3) and androgen receptor
(AR) were over-expressed in the resistant cell lines, while
cytokeratin (CK) 5 was highly expressed in the sensitive cell
lines (Figure 1c).
The relative expression levels of CK5, PSA and AR in these 16
cell lines are shown in more detail in Figure 1d. We observed
that resistant cell lines all express very low levels of CK5 and
sensitive cell lines all express high levels of CK5, except for
DU145, PC3 and LNCaP cells (Figure 1c). As CK5 is a basal cell
marker for the prostatic cell lineage, these data suggest that
cells exhibiting the basal phenotype are sensitive to dasatinib
and that cells expressing lower levels of CK5 tend to be resist-
ant. The expression pattern of PSA and AR, two luminal cell
markers, complementarily reinforces the above observation.
While higher expression of PSA and AR is correlated with
drug resistance, lower expression of these two genes is corre-
lated with dasatinib sensitivity. The LNCaP cell line, which
was sensitive to dasatinib and expressed high levels of PSA
and AR, is the only exception to this observation out of five
cell lines (MDAPCa2b, LNCaP, VCaP, DUCaP, and 22Rv)
found to express higher levels of PSA and AR (Figure 1c).
Identification of markers that are also modulated by
dasatinib treatment
Five dasatinib-sensitive cell lines, including two CK5-
expressing (PWR1E and RWPE2) and three CK5-nonexpress-
ing cell lines (PC3, DU145 and LNCaP), were treated with
dasatinib. Comparison by paired t-test of gene expression
profiles between post-dasatinib treatment and mock treat-
ment for each cell line revealed that 1,628 probe sets were sig-
nificantly modulated by drug treatment (p < 0.05).
Comparison of these 1,628 probe sets with the list of candi-
date predictive markers (Additional data file 1) indicated that
10 genes were common to both lists. These ten genes, which
may be potentially used to predict sensitivity to dasatinib and
to serve as surrogates for drug activity, are indicated in the
last column of Additional data file 1. Interestingly, all ten of
these genes were highly expressed in sensitive cell lines and
decreased in expression after dasatinib treatment. These
genes include those encoding epiregulin, a component in the
EGFR pathway, FHL2 and AXL kinases, and uPA. Three of
these ten genes including LAMC2, EREG and uPA encode
proteins that are secreted to the extracellular matrix This set
of genes may represent genes whose expression are under the
regulation of genes targeted by dasatinib.
Common biomarkers identified in prostate and breast
preclinical studies
To facilitate clinical development of dasatinib for breast can-
cer, a similar preclinical biomarker study was performed in
this laboratory [8]. Biomarkers predictive of dasatinib sensi-
tivity in breast cancer cell lines were identified and are cur-
rently being assessed in clinical trials. Since the majority of
breast tumors are also epithelial in origin, we compared the
biomarkers discovered in the current prostate cancer study
with those identified in the breast cancer study. To this end,
in addition to the 174 genes noted above, we also included
probe sets in the list of 1,475 probe sets (after the 10% CV step,
but before the fold-change >3 filter step) that were also signif-
icantly modulated by dasatinib (that is, present in the list of
1,628 probes) as candidate prostate biomarkers and com-
pared them to the breast cancer biomarker list of 161 genes
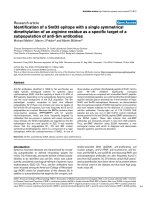
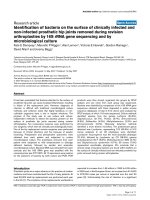
Correlation of EphA2 gene expression with sensitivity to dasatinibFigure 2
Correlation of EphA2 gene expression with sensitivity to dasatinib. (a)
Negative correlation between the expression levels of EphA2 (black
diamonds) and the IC
50
(gray circles) values for the 16 cell lines. The
coefficient of the Pearson correlation is -0.66, indicating a high reverse
correlation. (b) Expression of EphA2 protein in five sensitive and three
resistant cell lines. Overall, the protein expression levels in these cell lines
correlated well with the mRNA levels detected by microarray analysis.
Genome Biology 2007, Volume 8, Issue 11, Article R255 Wang et al. R255.5
Genome Biology 2007, 8:R255
[8]. Fourteen genes were identified as common biomarkers in
both tissue types (Additional data file 2). Notably, EphA2, a
dasatinib target, was significantly correlated with dasatinib
sensitivity in both prostate and breast cancer cell lines. As
shown in Additional data file 2, the mean expression of
EphA2 was significantly higher in sensitive cell lines than in
resistant cell lines (2.69-fold with p = 0.005 by t-test).
As shown in Figure 2a, the expression level of EphA2, as
detected by microarray baseline profiling, was correlated with
the IC
50
values of the prostate cell lines (higher EphA2 expres-
sion with lower IC
50
or high sensitivity, Pearson correlation
coefficient = -0.66). As a validation, we also performed west-
ern blot analysis to examine the expression of EphA2 protein
in five sensitive and three resistant cell lines (Figure 2b).
Overall, those cell lines with higher levels of EphA2 mRNA
expressed relatively higher levels of EphA2 protein,
indicating good concordance between gene and protein
expression for EphA2. While the EphA2 RNA level in DU145
cells was relatively low compared to the other sensitive cell
lines, its protein level appeared comparable, suggesting that
EphA2 expression is also regulated at the protein translation
or stabilization levels. Our western blot results on EphA2 pro-
tein in PC3, DU145 and LNCaP cells are consistent with a pre-
vious report [14]. With the correlation of its expression with
dasatinib sensitivity in cell lines, and being a target of the
drug, EphA2 appears to be a strong candidate biomarker for
dasatinib in prostate cancer.
Down-regulation of uPA expression by dasatinib
Since the secreted protein uPA is regulated by SFKs [15], we
further evaluated the expression of the uPA gene and its mod-
ulation by dasatinib. As shown in Figure 3a (and also Addi-
tional data file 1), the expression level of the uPA gene in
sensitive cell lines was significantly higher than in resistant
cell lines. A second probe set for the uPA gene also showed a
similar expression pattern. Additionally, three probe sets for
the uPA receptor, which partners with uPA in its function, all
showed a similar expression pattern as uPA in these cell lines
(data not shown).
The down-regulation of uPA mRNA expression upon dasat-
inib treatment was observed (Figure 3b). A relatively mild
reduction of uPA expression was observed in two CK5-
expressing cells (PWR1E and RWPE2) while the reduction in
PC3 and DU145 cells was much stronger (approximately
50%). LNCaP cells, which express a much lower level of uPA,
also showed a reduction upon dasatinib treatment. When we
extended the same drug treatment study in three resistant cell
lines, 22Rv, VCaP and MDAPCa2b (Figure 3c), the magnitude
of uPA reduction by dasatinib was correlated nicely with the
sensitivity of cells to dasatinib (r = 0.72), with the highest
reduction seen in the most sensitive cell line. This suggests
uPA is a potential surrogate biomarker for the biological
effect of dasatinib. Furthermore, in a multiple-dose treatment
study with PC3 cells, we found that the reduction of uPA
mRNA level by dasatinib at 4 h was minimal for all doses
compared to untreated control, but the changes were dra-
matic at 24 h and occurred in a dose-dependent fashion (Fig-
ure 3d).
The down-regulation of uPA expression by dasatinib was also
seen at the protein level. Using an enzyme-linked immuno-
sorbent assay (ELISA), we found in a time course experiment
that the amount of uPA protein secreted by PC3 cells into the
growth medium after 24 h was reduced by dasatinib treat-
ment, and the extent of this reduction was dose-dependent, as
shown in Figure 3e. As a control, when using a cytotoxic
agent, paclitaxel, we did not see a dose-dependent reduction
in the secreted uPA protein level, suggesting that down-regu-
lation of uPA expression is not a consequence of cell growth
inhibition.
Rationale for patient stratification in dasatinib prostate
cancer trials
Based on their differential expression, we reasoned that CK5,
PSA, and AR could serve as predictive biomarkers for identi-
fication of subtypes of prostate tumors that would benefit
from dasatinib treatment. We also reasoned that uPA and
EphA2 could potentially be used as markers to monitor dasat-
inib activity because of their correlation with drug sensitivity
and the links with dasatinib's mechanisms of action. The
expression patterns of these 5 genes in the 16 cell lines are
shown in Figure 4a. Five dasatinib resistant cell lines,
WPMY1, MDAPCa2b, 22Rv, VCaP, and DUCaP, all expressed
high levels of AR and PSA and low levels of CK5, uPA and
EphA2. In contrast, sensitive cell lines expressed low levels of
AR and PSA, with the exception of LNCaP, and high levels of
uPA, EphA2 and/or CK5.
The dynamic range in the expression of these 5 genes and the
approximate patient population exhibiting dasatinib-respon-
sive expression patterns were examined using a previously
published prostate tumor data set consisting of 52 tumor
samples [16]. As shown in Figure 4b, nearly 44% (23/52, sam-
ple ID labeled in red) of the prostate tumors showed the
'dasatinib-responsive' expression patterns (that is, low AR
and PSA and high uPA, EphA2 and/or CK5). In the remaining
approximately 56% of tumors, the expression of AR and PSA
were concordantly relatively high and the expression of uPA
and EphA2 were relatively low. There were certain degrees of
co-expression as well as mutually exclusive expression of AR
and CK5 in this data set, reminiscent of the expression pat-
tern of these two genes in basal, intermediate and luminal
cells of normal prostatic epithelium [17,18].
Discussion
The ideal scenario for identifying biomarkers for clinical use
is to use samples obtained from patients undergoing therapy
with the investigational drug and to analyze gene expression
data in the context of patient response data. Since dasatinib is
Genome Biology 2007, 8:R255
Genome Biology 2007, Volume 8, Issue 11, Article R255 Wang et al. R255.6
a novel agent in early clinical development, using preclinical
models to identify candidate biomarkers for assisting clinical
development appears the best option. In this study, we used
16 prostate cell lines to identify biomarkers that were
correlated with the sensitivity of cells and with the mecha-
nisms of drug action. These biomarkers could potentially be
used for predicting and monitoring dasatinib response. In
particular, we identified five genes (AR, PSA, CK5, uPA and
EphA2) that were highly associated with drug sensitivity/
resistance and/or modulated by drug treatment. Consistent
with our observation in breast cancer cell lines [8], it appears
that basal-type prostate cancer cells expressing low levels of
AR and PSA and a high level of CK5 are most responsive to
dasatinib treatment. Higher expression levels of uPA and
EphA2 may also help to define patients that will benefit from
dasatinib treatment. In addition, uPA expression was regu-
lated by dasatinib and such regulation was highly correlated
with the sensitivity of cells to dasatinib, suggesting that uPA
expression can potentially be used as a surrogate marker to
monitor dasatinib activity. As a potent inhibitor against Abl,
c-kit, PDGFRβ and, in particular, Src and EphA2, which have
been shown to play important roles in prostatic tumorigene-
sis [13,14], dasatinib holds high promise as a potential treat-
ment for prostate cancer. It is noted that imatinib, which
inhibits three of these targets, including Abl, c-kit and
PDGFR kinases, showed minimal efficacy in early clinical
testing with a small number of patients [19,20]. Identification
of these preclinical candidate markers and further validation
of them in early clinical trials would facilitate patient stratifi-
cation in registration trials of dasatinib.
In our data analysis, we used an approach that emphasized
both statistical significance and high-fold differential gene
expression between subgroups. Since we have only 16 cell
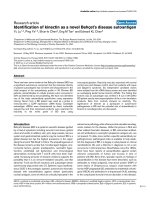
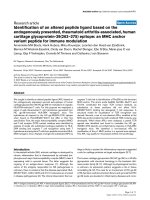
Figure 3
uPA gene expression and regulation by dasatinib analyzed at mRNA and protein levelsFigure 3
uPA gene expression and regulation by dasatinib analyzed at mRNA and
protein levels. (a) Differential baseline expression of uPA gene between
resistant (R, in black) and sensitive (S, in red) cell lines. The x-axis values
are the expression level in log
2
-scale. The resistant cell line expressing a
high level of uPA was WPMY1 and the sensitive cell line expressing a low
level of uPA was LNCaP. (b) Down-regulation of uPA mRNA level by
dasatinib treatment in five sensitive cell lines. The cells were treated with
100 nM dasatinib (+D) or DMSO (Ctrl) for 48 h. The p value was 0.048 by
paired t-test, indicating a significant reduction of uPA mRNA following
dasatinib treatment. (c) Correlation between dasatinib-induced uPA
mRNA down-regulation with the sensitivity of cell lines to dasatinib. In
addition to the five sensitive cell lines, three dasatinib-resistant cell lines,
22Rv, MDAPCa2b, and VCaP, were also treated with dasatinib as in (b).
The extent of uPA down-regulation by dasatinib (y-axis) was negatively
correlated with the log
2
IC
50
values (x-axis) of these eight cell lines. (d)
Dose-dependent down-regulation of uPA mRNA expression in PC3 cells.
Cells were treated with or without different concentrations of dasatinib
for 4 or 24 h. The uPA expression level relative to control is shown on the
y-axis. (e) Dose-dependent inhibition of secreted uPA protein in PC3 cells
by dasatinib but not by paclitaxel. Cells were treated with different doses
of dasatinib, paclitaxel or DMSO for 24 h. The amount of uPA protein
secreted into the culture medium by 50,000 viable cells was assessed by
ELISA assay.
Genome Biology 2007, Volume 8, Issue 11, Article R255 Wang et al. R255.7
Genome Biology 2007, 8:R255
lines, a pool that may not be necessarily large enough for
stringent statistical analyses, we included other require-
ments, including stringent variation and fold change filters.
Notably, the approach we undertook was essentially consist-
ent with that reported by a recent publication from the
MicroArray Quality Control initiative led by the Food and
Drug Administration, which showed that gene lists ranked by
fold change and filtered with non-stringent yet statistically
significant tests were more reproducible across platforms
than lists generated with other analytical strategies [21]. The
result we obtained is biologically meaningful as we identified
subtypes of cells sensitive to dasatinib that reflect normal
and/or pathogenic prostatic biology and genes that reflect the
function of dasatinib targets. In addition, a number of
biomarkers identified were also observed from a recently
published breast cancer study [8].
Inside normal prostatic epithelium, there exist two major
types of epithelial cells, basal and luminal epithelial cells. Sev-
eral recent studies suggest that there may be further divisions
of epithelial cells into subtypes that are more specialized in
function. Among these subtypes are prostatic stem cells, tran-
sit amplifying cells, intermediate cells and secretary luminal
cells, which can be differentiated based on their expression
pattern of certain cellular markers. In our study, we found
that cells with low AR and PSA expression and high CK5
expression represent a sub-population that is sensitive to
dasatinib. This expression pattern matches that of epithelial
cells residing in the basal compartment, which can potentially
be prostatic stem cells or transit amplifying cells. Since these
two types of cells are able to self-renew and quickly proliferate
to give rise to new or more differentiated cells, an intrinsic
relationship may exist between the expression and function of
dasatinib targets such as the SFK LYN and the proliferation of
these cells [11]. Indeed, LYN is more highly expressed in the
basal layer than in the luminal layer, and in tumors LYN tends
to be more highly expressed in less differentiated regions
[22]. Our result that basal type prostatic cells are sensitive to
dasatinib resonates with recent reports showing that dasat-
inib is active on a basal subtype of breast cancer cells [8,23].
Notably, gene expression profiling studies with a large set of
breast tumors or cancer cell lines have identified basal epithe-
lial types of tumors or cells that highly express CK5, EGFR
and SFK LYN [24,25], which suggests that basal epithelial
cells, as well as SFK and their cooperating partners, such as
EGFR, have important roles in breast tumorigenesis [12].
In contrast to the well established and validated classification
of breast cancer subtypes that has been used in the clinic to
aid patient stratification [25,26], molecular classification of
prostate cancer using genome-wide profiling techniques has
been explored [27] but lacks validation with independent
tumor cohorts. This may be a result of the heterogeneity of
prostate tumors and the difficulty in obtaining biopsies from
prostate cancer patients. It remains to be determined whether
the molecular subtypes of prostate cancer identified through
molecular profiling mimic the epithelial subtypes seen in nor-
mal prostatic epithelium, as is seen in breast cancer [25,26].
From our analysis of the data set published by Singh et al.
[16], prostate cancer subtypes that express lower levels of AR
and PSA and higher levels of CK5 (that is, the basal type) and
those with the opposite expression pattern (that is, the lumi-
nal type) apparently exist. The derivation of prostate cancer
cell lines such as MDAPCa2b, VCaP, DUCaP and LNCaP also
demonstrates the existence of a luminal type of prostate can-
cer. The low expression levels of PSA/AR as well as CK5 in
PC3 and DU145 cells may also suggest subtypes other than
luminal and basal. It is noted that the subtype with high
expression of CK5 and low expression of AR and PSA seen in
our study is mainly based on immortalized prostatic cell lines.
However, a recent study showed that sub-cell populations
with varying degrees of differentiation co-exist in both AR-
expressing LAPC-4/LAPC-9 human cancer xenograft models
and PC3 and DU145 cancer cell populations. The sub-popula-
tion that expressed CD44, another basal cell marker [28],
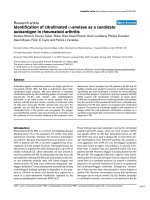
Expression pattern of a five-gene model in prostate cell lines and tumorsFigure 4
Expression pattern of a five-gene model in prostate cell lines and tumors.
(a) Hierarchical clustering of five genes, AR, PSA, CK5, uPA, and EphA2, in
prostate cell lines. AR and PSA are two luminal cell markers, and CK5 is a
basal cell marker. The resistant cell lines were separated from the majority
of the sensitive cells (labeled in red) by these five genes. Note the high
expression of CK5 and/or uPA, and EphA2 in sensitive cells and the nearly
opposite expression pattern in resistant cells. (b) The expression pattern
of these 5 genes in 52 prostate tumors. The gene expression of this
published data set was profiled on Affymetrix HG-U95 gene chips. Two
AR, three PSA probe sets and one CK5, uPA and EphA2 probe set are
available on the chip and were retrieved for cluster analysis. The tumor
samples exhibiting a dasatinib-sensitive pattern, that is, with low AR and
PSA expression and high CK5 and/or uPA, and EphA2 expression are
highlighted in red.
AR
PSA
CK5
uPA
EphA2
AR 1
AR 2
PSA 1
PSA 2
PSA 3
CK5
uPA
EphA2
Genome Biology 2007, 8:R255
Genome Biology 2007, Volume 8, Issue 11, Article R255 Wang et al. R255.8
showed the highest tumorigenicity [29]. These results
strongly suggest that a subtype of cells with the phenotypes of
normal basal cells exists in prostate tumors and may play a
major role in determining tumor malignancy.
We found in our study that LNCaP cells, an androgen-sensi-
tive prostate cancer cell line, exhibited sensitivity to dasatinib
distinct from other androgen-sensitive cell lines, including
22Rv, MDAPCa2b, VCaP and DuCaP. Transcriptionally,
these 5 cell lines resemble each other in terms of expression
of AR/PSA, the 174 genes associated with in vitro response to
dasatinib, as well as global gene expression (Figure 1c; other
data not shown). It is not clear what mechanism in LNCaP
cells caused dasatinib susceptibility. The AR gene mutation
may be an appealing, but not necessarily straight-forward,
explanation as LNCaP cells possess one T877A mutation and
other cells either have no mutation (VCaP and DuCaP) or
have other mutations (22Rv, H874Y) or additional types of
mutations (MDAPCa2b, L701H and T877A) [30]. Alteration
of the expression or sequence of AR may affect the function of
AR in terms of binding to androgen [31] or cross-talk with
growth factor and receptor pathways such as phosphorylation
of AR by signaling cascades [32]. The inhibition of growth fac-
tor and receptor pathways by dasatinib may also induce the
cells to re-establish the balance of signaling networks and
modify the mode of action of AR. It is also possible that the
function of one or more targets of dasatinib is indispensable
for LNCaP cell growth.
By identifying genes whose expression was altered by drug
treatment, we found a set of genes that may correlate with the
mechanisms of action of dasatinib. This is desirable in drug
development in two ways. First, markers correlated with
mechanisms of action would enhance the level of confidence
when biomarkers are used in clinical testing for the specific
drug. Second, knowledge of drug efficacy through sensitive
molecular testing can help to prevent premature discontinu-
ation of clinical studies due to low clinical responses in early
stage trials with small numbers of patients. In particular,
while dasatinib is potent in inhibiting cell adhesion, migra-
tion and invasion, it appears in preclinical models to be cyto-
static rather than cytotoxic. Thus, sensitive surrogate
markers become critical for an evaluation of drug efficacy in
early trials. In our study, we found that uPA, a downstream
target of Src kinase, was modulated significantly by dasatinib,
and such down-regulation was specifically caused by dasat-
inib and not by other cytotoxic agents, such as paclitaxel. In
addition, the magnitude of drug-induced uPA reduction cor-
related very well with the sensitivity of cell lines to dasatinib,
with higher reduction observed in sensitive cell lines and little
or no change in resistant ones. These data suggest that uPA
could potentially be used as a surrogate biomarker for moni-
toring the effect of dasatinib. More excitingly, uPA has been
demonstrated to play an important role in prostatic tumori-
genesis in numerous studies. For example, it is highly
expressed in high grade prostate tumors and metastases [33],
and when a tumor progresses to androgen independence, the
level of uPA expression is enhanced [34]. In addition, RNA
interference-induced knockdown of uPA inhibits invasion,
survival and in vivo tumorigenicity of prostate cancer cells
[35]. In the clinic, elevated uPA plasma level or uPA-uPA
receptor densities are correlated with prostate cancer inva-
sion, metastasis and poorer survival in prostate cancer
[36,37] and its value as a prognostic marker has been well
established in breast cancer [38,39].
Among the candidate predictive biomarker genes, several are
components of signaling pathways important for cell survival
and proliferation, such as the EGF-EGFR, transforming
growth factor (TGF)-TGF receptor, fibroblast growth factor
receptor and Met pathways. As an intracellular tyrosine
kinase, Src can act as a signal transducer downstream of these
receptor tyrosine kinases [11,12,40]. Alternatively, Src kinase
may function independently of one or more pathways.
Although the mechanisms of either co-operation or cross-talk
of these pathways with the Src-mediated pathway in prostate
cancer is not quite clear, they may still represent candidate
target pathways for combination therapies to achieve additive
or synergistic effects. This observation may provide insight
for future clinical development strategies.
Conclusion
Our study, utilizing a gene expression profiling approach in
preclinical models, has identified prostatic biomarkers that
are associated with sensitivity to dasatinib, a novel multi-tar-
geted kinase inhibitor. In particular, five biomarkers (AR,
PSA, CK5, uPA, and EphA2) could potentially help patient
stratification and allow molecular monitoring of dasatinib
activity in clinical trials. These markers are currently under
early phase clinical evaluation using methods such as immu-
nohistochemistry, ELISA or RT-PCR to identify potential
associations with drug efficacy. In all, this preclinical study
has provided a basis for clinical exploration, validation, and
further implementation of a potential dasatinib efficacy sig-
nature for prostate cancer.
Materials and methods
Cell lines and cell culture
All cell lines were obtained from the American Type Culture
Collection (Manassas, VA, USA), except DUCaP, which was
obtained from Dr Kenneth Pienta at the University of Michi-
gan. PWR1E and MDAPCa2b cells were grown in BRFF-HPC1
serum-free medium (AthenaES, Baltimore, MD, USA), and
all other cells were cultured in RPMI 1640 supplemented with
10% fetal bovine serum, 100 IU/ml penicillin, and 100 mg/ml
streptomycin (Invitrogen, Carlsbad, CA, USA). DUCaP cells
were maintained in the presence of an immortalized mouse
fibroblast cell line, which formed a layer beneath the DUCaP
cells that easily dislodged. Cells were incubated at 37°C with
circulation of 5% CO
2
.
Genome Biology 2007, Volume 8, Issue 11, Article R255 Wang et al. R255.9
Genome Biology 2007, 8:R255
In vitro cell proliferation assay
The effect of dasatinib treatment on cell proliferation was
measured using a tetrazolium compound-based colorimetric
method (MTS kit, Promega, Madison, WI, USA). The opti-
mum number of cells to seed in 96-well plates to achieve lin-
earity was determined in pilot experiments. Cells were plated
at a density of 2,000-5,000 cells/well into 96-well plates and
cultured overnight. Cells were then treated with dasatinib at
serially diluted concentrations. Three days later, the reagent
solution was added to the medium and the absorbance was
measured on a SpectraMax photometric plate reader (Molec-
ular Devices, Sunnyvale, CA, USA) at 490 nm. The results
were plotted against drug concentrations and IC
50
values
were calculated using Prism4 software (GraphPad, San
Diego, CA, USA). The IC
50
was the concentration of dasatinib
that would reduce cell proliferation by 50% compared to con-
trol. A minimum of three independent assays were performed
for each cell line. The mean ± standard deviation was calcu-
lated except for cell lines that were highly resistant to the
compound, for which accurate IC
50
values were hard to
obtain. In the latter case, the concentration of dasatinib that
was able to consistently reduce cell proliferation was used as
the IC
50
. The inhibition of dasatinib on cell growth was also
visually confirmed under the microscope. Dasatinib stock,
dissolved in DMSO, was 10 mg/ml.
Microarray analysis
Affymetrix HG-U133A 2.0 gene chips containing approxi-
mately 22,000 probe sets were used for gene expression pro-
filing (Affymetrix, Santa Clara, CA, USA). Total RNA was
isolated from the cells using the RNeasy kits (Qiagen, Valen-
cia, CA, USA). The quality of the RNA was assessed using an
Agilent 2100 Bioanalyzer (Agilent, Santa Clara, CA, USA).
Total RNA (10 μg) was used for the preparation of biotin-
labeled cRNA. Chip hybridization, scanning and data acquisi-
tion were performed according to the Expression Analysis
Technical Manual provided by the manufacturer.
Data analysis
The raw expression data were normalized using an RMA algo-
rithm and analyzed in Partek Discovery Suite software
(Partek, St Louis, MO, USA). Two statistical analyses, includ-
ing one-way ANOVA (for comparison of gene expression
between sensitive and resistant cell line groups) and Pearson
correlation (between gene expression level and log
2
IC
50
val-
ues) were performed to identify genes whose baseline expres-
sion levels correlated with sensitivity to dasatinib in 16
prostate cell lines (a p value < 0.05 in both analyses was
required for inclusion). The gene list was further narrowed
down by variation filters (10% CV of gene expression values
across all samples and a minimum 3-fold differential expres-
sion between sensitive and resistant cell groups as defined by
IC
50
). ESTs and gene duplicates were eliminated from the
final list. Gene expression profiles of drug treated (100 nM for
2 days) cell lines were compared with those of DMSO control
using paired t-test (p value < 0.05). Clustering analysis was
performed using GeneCluster software and heatmaps were
generated with red and green indicating high or low expres-
sion, respectively [41]. Gene expression raw data have been
deposited in the Gene Expression Omnibus database (acces-
sion number GSE9633).
Western blot analysis
Cell lysates were prepared from asynchronously growing cells
using the RIPA buffer supplemented with protease (Roche
Diagnostics, Indianapolis, IN, USA) and phosphatase inhibi-
tor (Sigma, St Louis, MO, USA) cocktails. Protein concentra-
tion was determined using the BCA kit (Pierce, Rockford, IL,
USA). Lystate (30 μg) was loaded and resolved on NuPAGE
Novex 4-12% Bis-Tris gel (Invitrogen, Carlsbad, CA, USA).
The blots were probed with mouse monoclonal anti-EphA2
(Upstate Biotechnology, Lake Placid, NY, USA) and anti-
tubulin antibodies (Abcam, Cambridge, MA, USA) and devel-
oped with chemiluminescence reagent ECL Plus (GE Health-
care, Piscataway, NJ, USA).
uPA protein ELISA assay
Cells were seeded in 24-well plates at a density of 25,000 cells
per well. Two days later, the cells were washed twice with
phosphate-buffered saline and the medium was changed to
RPMI 1640 containing 0.1% fetal bovine serum and different
concentrations of dasatinib or paclitaxel. Medium was
sampled at 0, 2, 4, 8, 24, and 48 h and immediately centri-
fuged at 10,000 g for 5 minutes. The supernatants were fro-
zen at -80°C until analysis. The total number of cells was
quantified using a cell counter, and the number of viable cells
was assessed with Trypan Blue. The amount of uPA protein in
the supernatant was determined using the uPA ELISA kit
(America Diagnostica, Stamford, CT, USA), and the concen-
trations of uPA secreted by 50,000 viable cells into the
medium were calculated.
Abbreviations
AR, androgen receptor; CK, cytokeratin; CV, coefficient of
variation; EGFR, epidermal growth factor receptor; ELISA,
enzyme-linked immunosorbent assay; EST, expressed
sequence tag; IC
50
, half maximal inhibitory concentration;
PDGFR, platelet-derived growth factor receptor; PSA, pros-
tate-specific antigen (also known as kallikrein 3); SFK, Src-
family kinase; TGF, transforming growth factor; uPA, uroki-
nase-type plasminogen activator.
Authors' contributions
XDW designed the study, performed data analyses, and wrote
the manuscript. KR performed the EphA2 Western blot anal-
ysis. FRL contributed data on the down-regulation of uPA
protein in PC3 cells following drug treatment. LAX provided
statistical assistance. FL shared insight and provided support
for the study. EC helped conceive the study and edited the
Genome Biology 2007, 8:R255
Genome Biology 2007, Volume 8, Issue 11, Article R255 Wang et al. R255.10
manuscript. FH helped conceive the study, advised on study
design, and edited the manuscript.
Additional data files
The following additional data are available with the online
version of this paper. Additional data file 1 is a table listing
biomarkers correlated with sensitivity or resistance to dasat-
inib. Additional data file 2 is a table listing common predictive
markers identified in prostate and breast preclinical models.
Additional data file 3 provides microarray data on baseline
gene expression of cell lines used for identification of genes
whose expression correlated with in vitro sensitivity to dasat-
inib. Additional data file 4 provides microarray data on gene
expression of cell lines treated with dasatinib or DMSO
control.
Additional data file 1Biomarkers correlated with sensitivity or resistance to dasatinibBiomarkers correlated with sensitivity or resistance to dasatinib.Click here for fileAdditional data file 2Common predictive markers identified in prostate and breast pre-clinical modelsCommon predictive markers identified in prostate and breast pre-clinical models.Click here for fileAdditional data file 3Microarray data on baseline gene expression of cell lines used for identification of genes whose expression correlated with in vitro sensitivity to dasatinibThe hybridization data (in log scale) were normalized with the RMA algorithm. The IC
50
in nM and log
2
IC50 values as well as the classification of cell lines as resistant (R) or sensitive (S) are also provided at the top of the spreadsheet.Click here for fileAdditional data file 4Microarray data on gene expression of cell lines treated with dasat-inib or DMSO controlThese data were used for identification of genes whose expression was modulated by dasatinib. The hybridization data (in log scale) were normalized with the RMA algorithm. The treatment and the classification of cell lines as resistant (R) or sensitive (S) are also provided at the top of the spreadsheet.Click here for file
Acknowledgements
We thank Shujian Wu and Mark Ayers for helpful discussions, and Shinta
Cheng, Lewis Strauss, Maurizio Voi and Nicholas Dracopoli for critical
reading of the manuscript.
References
1. Jemal A, Siegel R, Ward E, Murray T, Xu J, Smigal C, Thun MJ: Cancer
statistics, 2006. CA Cancer J Clin 2006, 56:106-130.
2. Denmeade SR, Isaacs JT: A history of prostate cancer treat-
ment. Nat Rev Cancer 2002, 2:389-396.
3. Tannock IF, de Wit R, Berry WR, Horti J, Pluzanska A, Chi KN,
Oudard S, Theodore C, James ND, Turesson I, et al.: Docetaxel
plus prednisone or mitoxantrone plus prednisone for
advanced prostate cancer. N Engl J Med 2004, 351:1502-1512.
4. Pegram MD, Lipton A, Hayes DF, Weber BL, Baselga JM, Tripathy D,
Baly D, Baughman SA, Twaddell T, Glaspy JA, et al.: Phase II study
of receptor-enhanced chemosensitivity using recombinant
humanized anti-p185HER2/neu monoclonal antibody plus
cisplatin in patients with HER2/neu-overexpressing meta-
static breast cancer refractory to chemotherapy treatment.
J Clin Oncol 1998, 16:2659-2671.
5. Castro M: The simpleton's error in drug development. J Clin
Oncol 2002, 20:4606-4607.
6. Betensky RA, Louis DN, Cairncross JG: Influence of unrecognized
molecular heterogeneity on randomized clinical trials. J Clin
Oncol 2002, 20:2495-2499.
7. Lombardo LJ, Lee FY, Chen P, Norris D, Barrish JC, Behnia K, Cas-
taneda S, Cornelius LA, Das J, Doweyko AM, et al.: Discovery of N-
(2-chloro-6-methyl-phenyl)-2-(6-(4-(2-hydroxyethyl)-piper-
azin-1-yl)-2-methylpyrimidin-4-ylamino)thiazole-5-carboxa-
mide (BMS-354825), a dual Src/Abl kinase inhibitor with
potent antitumor activity in preclinical assays. J Med Chem
2004, 47:6658-6661.
8. Huang F, Reeves K, Han X, Fairchild C, Platero S, Wong TW, Lee F,
Shaw P, Clark E: Identification of candidate molecular markers
predicting sensitivity in solid tumors to dasatinib: rationale
for patient selection. Cancer Res 2007, 67:2226-2238.
9. Shah NP, Tran C, Lee FY, Chen P, Norris D, Sawyers CL: Overrid-
ing imatinib resistance with a novel ABL kinase inhibitor. Sci-
ence 2004,
305:399-401.
10. Talpaz M, Shah NP, Kantarjian H, Donato N, Nicoll J, Paquette R,
Cortes J, O'Brien S, Nicaise C, Bleickardt E, et al.: Dasatinib in imat-
inib-resistant Philadelphia chromosome-positive leukemias.
N Engl J Med 2006, 354:2531-2541.
11. Yeatman TJ: A renaissance for SRC. Nat Rev Cancer 2004,
4:470-480.
12. Ishizawar R, Parsons SJ: c-Src and cooperating partners in
human cancer. Cancer Cell 2004, 6:209-214.
13. Nam S, Kim D, Cheng JQ, Zhang S, Lee JH, Buettner R, Mirosevich J,
Lee FY, Jove R: Action of the Src family kinase inhibitor, dasat-
inib (BMS-354825), on human prostate cancer cells. Cancer
Res 2005, 65:9185-9189.
14. Walker-Daniels J, Coffman K, Azimi M, Rhim JS, Bostwick DG, Snyder
P, Kerns BJ, Waters DJ, Kinch MS: Overexpression of the EphA2
tyrosine kinase in prostate cancer. Prostate 1999, 41:275-280.
15. Bell SM, Brackenbury RW, Leslie ND, Degen JL: Plasminogen acti-
vator gene expression is induced by the src oncogene prod-
uct and tumor promoters. J Biol Chem 1990, 265:1333-1338.
16. Singh D, Febbo PG, Ross K, Jackson DG, Manola J, Ladd C, Tamayo P,
Renshaw AA, D'Amico AV, Richie JP, et al.: Gene expression cor-
relates of clinical prostate cancer behavior. Cancer Cell 2002,
1:203-209.
17. Marker PC, Donjacour AA, Dahiya R, Cunha GR: Hormonal, cellu-
lar, and molecular control of prostatic development. Dev Biol
2003, 253:165-174.
18. Litvinov IV, Vander Griend DJ, Xu Y, Antony L, Dalrymple SL, Isaacs
JT: Low-calcium serum-free defined medium selects for
growth of normal prostatic epithelial stem cells. Cancer Res
2006, 66:8598-8607.
19. Lin AM, Rini BI, Derynck MK, Weinberg V, Park M, Ryan CJ, Rosen-
berg JE, Bubley G, Small EJ: A phase I trial of docetaxel/estra-
mustine/imatinib in patients with hormone-refractory
prostate cancer. Clinical genitourinary cancer
2007, 5:323-328.
20. Lin AM, Rini BI, Weinberg V, Fong K, Ryan CJ, Rosenberg JE, Fong L,
Small EJ: A phase II trial of imatinib mesylate in patients with
biochemical relapse of prostate cancer after definitive local
therapy. BJU international 2006, 98:763-769.
21. Guo L, Lobenhofer EK, Wang C, Shippy R, Harris SC, Zhang L, Mei
N, Chen T, Herman D, Goodsaid FM, et al.: Rat toxicogenomic
study reveals analytical consistency across microarray plat-
forms. Nat Biotechnol 2006, 24:1162-1169.
22. Goldenberg-Furmanov M, Stein I, Pikarsky E, Rubin H, Kasem S,
Wygoda M, Weinstein I, Reuveni H, Ben-Sasson SA: Lyn is a target
gene for prostate cancer: sequence-based inhibition induces
regression of human tumor xenografts. Cancer Res 2004,
64:1058-1066.
23. Finn RS, Dering J, Ginther C, Wilson CA, Glaspy P, Tchekmedyian N,
Slamon DJ: Dasatinib, an orally active small molecule inhibitor
of both the src and abl kinases, selectively inhibits growth of
basal-type/"triple-negative" breast cancer cell lines growing
in vitro. Breast Cancer Res Treat 2007.
24. Charafe-Jauffret E, Ginestier C, Monville F, Finetti P, Adelaide J, Cer-
vera N, Fekairi S, Xerri L, Jacquemier J, Birnbaum D, et al.: Gene
expression profiling of breast cell lines identifies potential
new basal markers. Oncogene 2006, 25:2273-2284.
25. Perou CM, Sorlie T, Eisen MB, van de Rijn M, Jeffrey SS, Rees CA, Pol-
lack JR, Ross DT, Johnsen H, Akslen LA, et al.: Molecular portraits
of human breast tumours. Nature 2000, 406:747-752.
26. Sorlie T, Tibshirani R, Parker J, Hastie T, Marron JS, Nobel A, Deng S,
Johnsen H, Pesich R, Geisler S, et al.: Repeated observation of
breast tumor subtypes in independent gene expression data
sets. Proc Natl Acad Sci USA 2003, 100:8418-8423.
27. Lapointe J, Li C, Higgins JP, van de Rijn M, Bair E, Montgomery K, Fer-
rari M, Egevad L, Rayford W, Bergerheim U, et al.: Gene expression
profiling identifies clinically relevant subtypes of prostate
cancer.
Proc Natl Acad Sci USA 2004, 101:811-816.
28. Abate-Shen C, Shen MM: Molecular genetics of prostate cancer.
Genes Dev 2000, 14:2410-2434.
29. Patrawala L, Calhoun T, Schneider-Broussard R, Li H, Bhatia B, Tang
S, Reilly JG, Chandra D, Zhou J, Claypool K, et al.: Highly purified
CD44+ prostate cancer cells from xenograft human tumors
are enriched in tumorigenic and metastatic progenitor cells.
Oncogene 2006, 25:1696-1708.
30. van Bokhoven A, Varella-Garcia M, Korch C, Johannes WU, Smith EE,
Miller HL, Nordeen SK, Miller GJ, Lucia MS: Molecular character-
ization of human prostate carcinoma cell lines. Prostate 2003,
57:205-225.
31. Chen CD, Welsbie DS, Tran C, Baek SH, Chen R, Vessella R, Rosen-
feld MG, Sawyers CL: Molecular determinants of resistance to
antiandrogen therapy. Nat Med 2004, 10:33-39.
32. Guo Z, Dai B, Jiang T, Xu K, Xie Y, Kim O, Nesheiwat I, Kong X,
Melamed J, Handratta VD, et al.: Regulation of androgen receptor
activity by tyrosine phosphorylation. Cancer Cell 2006,
10:309-319.
33. Cozzi PJ, Wang J, Delprado W, Madigan MC, Fairy S, Russell PJ, Li Y:
Evaluation of urokinase plasminogen activator and its recep-
tor in different grades of human prostate cancer. Hum Pathol
2006, 37:1442-1451.
Genome Biology 2007, Volume 8, Issue 11, Article R255 Wang et al. R255.11
Genome Biology 2007, 8:R255
34. Rocchi P, Muracciole X, Fina F, Mulholland DJ, Karsenty G, Palmari J,
Ouafik L, Bladou F, Martin PM: Molecular analysis integrating dif-
ferent pathways associated with androgen-independent pro-
gression in LuCaP 23.1 xenograft. Oncogene 2004,
23:9111-9119.
35. Pulukuri SM, Gondi CS, Lakka SS, Jutla A, Estes N, Gujrati M, Rao JS:
RNA interference-directed knockdown of urokinase plas-
minogen activator and urokinase plasminogen activator
receptor inhibits prostate cancer cell invasion, survival, and
tumorigenicity in vivo. J Biol Chem 2005, 280:36529-36540.
36. Miyake H, Hara I, Yamanaka K, Arakawa S, Kamidono S: Elevation
of urokinase-type plasminogen activator and its receptor
densities as new predictors of disease progression and prog-
nosis in men with prostate cancer. Int J Oncol 1999, 14:535-541.
37. Shariat SF, Roehrborn CG, McConnell JD, Park S, Alam N, Wheeler
TM, Slawin KM: Association of the circulating levels of the
urokinase system of plasminogen activation with the pres-
ence of prostate cancer and invasion, progression, and
metastasis. J Clin Oncol 2007, 25:349-355.
38. Urban P, Vuaroqueaux V, Labuhn M, Delorenzi M, Wirapati P, Wight
E, Senn HJ, Benz C, Eppenberger U, Eppenberger-Castori S:
Increased expression of urokinase-type plasminogen activa-
tor mRNA determines adverse prognosis in ErbB2-positive
primary breast cancer. J Clin Oncol 2006, 24:4245-4253.
39. Janicke F, Prechtl A, Thomssen C, Harbeck N, Meisner C, Untch M,
Sweep CG, Selbmann HK, Graeff H, Schmitt M: Randomized adju-
vant chemotherapy trial in high-risk, lymph node-negative
breast cancer patients identified by urokinase-type plas-
minogen activator and plasminogen activator inhibitor type
1. J Natl Cancer Inst 2001, 93:913-920.
40. Thomas SM, Brugge JS: Cellular functions regulated by Src fam-
ily kinases. Annu Rev Cell Dev Biol 1997, 13:513-609.
41. Eisen MB, Spellman PT, Brown PO, Botstein D: Cluster analysis
and display of genome-wide expression patterns. Proc Natl
Acad Sci USA 1998, 95:14863-14868.