Báo cáo y học: " A new computational approach to analyze human protein complexes and predict novel protein interactions" pdf
Bạn đang xem bản rút gọn của tài liệu. Xem và tải ngay bản đầy đủ của tài liệu tại đây (1.46 MB, 15 trang )
Open Access
Volume
et al.
Zanivan
2007 8, Issue 12, Article R256
Method
A new computational approach to analyze human protein
complexes and predict novel protein interactions
Sara Zanivan*, Ilaria Cascone*, Chiara PeyronĐ, Ivan MolinerisĐ,
Serena Marchio*, Michele CaselleÔĐ and Federico BussolinoÔ*
Addresses: *Department of Oncological Sciences and Division of Molecular Angiogenesis, Institute for Cancer Research and Treatment (IRCC),
University of Torino Medical School, Strada Provinciale, I-10060 Candiolo (Turin), Italy. †Max-Planck Institute for Biochemistry, Department
of Proteomics and Signal Transduction, Am. Klopferspitz, D-82152 Martinsried, Germany. ‡Inserm U528, Institut Curie, 75248 Paris, France.
§Department of Theoretical Physics, University of Torino and INFN, Via P Giuria 1, I-10125 Turin, Italy.
Ô These authors contributed equally to this work.
Correspondence: Sara Zanivan. Email:
Published: 4 December 2007
Genome Biology 2007, 8:R256 (doi:10.1186/gb-2007-8-12-r256)
Received: 24 August 2007
Revised: 14 November 2007
Accepted: 4 December 2007
The electronic version of this article is the complete one and can be
found online at />© 2007 Zanivan et al.; licensee BioMed Central Ltd.
This is an open access article distributed under the terms of the Creative Commons Attribution License ( which
permits unrestricted use, distribution, and reproduction in any medium, provided the original work is properly cited.
simulations.
A new approach to identifying interacting proteins based on gene-expression data uses hypergeometric distribution and Monte-Carlo
Predicting novel protein interactions
Abstract
We propose a new approach to identify interacting proteins based on gene expression data. By
using hypergeometric distribution and extensive Monte-Carlo simulations, we demonstrate that
looking at synchronous expression peaks in a single time interval is a high sensitivity approach to
detect co-regulation among interacting proteins. Combining gene expression and Gene Ontology
similarity analyses enabled the extraction of novel interactions from microarray datasets. Applying
this approach to p21-activated kinase 1, we validated α-tubulin and early endosome antigen 1 as its
novel interactors.
Background
The cell is a complex system involving a heterogeneous and
highly dynamic set of proteins whose ability to interact and
form complexes is critical for cellular activity and regulation
[1]. A major goal, therefore, is the complete identification of
the interactome. Different high-throughput experimental
approaches have been developed to characterize the interactomes of several organisms. Yeast two hybrid screens allow
binary interactions to be defined while tandem affinity purification (TAP)-tag followed by mass spectrometry analysis is
used to purify and identify components of multi-protein complexes [2-5]. Up to now, data have been mostly generated by
studying simple organisms such as Saccharomyces cerevisiae, Caenorhabditis elegans and Drosophila melanogaster
[6,7]. For human cells, published experimental results are
collected in databases like MINT (Molecular Interactions
database) and HPRD (Human Protein Reference Database)
[8,9], but the amount of information is still largely limited.
Moreover, data have been obtained from different cellular
models and using different techniques, thus rendering it difficult to build a global network of interactions or to extrapolate information about the composition of multi-protein
complexes.
Computational approaches may help to address these crucial
issues [10-17]. The current idea is that proteins forming a
supra-molecular complex are transcribed simultaneously and
standard Pearson's analysis has been extensively applied to
gene expression datasets to support this concept
[12,14,15,17,18]. In general, good results are obtained with
Genome Biology 2007, 8:R256
/>
Genome Biology 2007,
Volume 8, Issue 12, Article R256
Zanivan et al. R256.2
this method if protein interactions of stable protein complexes are studied, but it is less efficient in other cases [12,14].
A paradigmatic example is the application of Pearson's analysis to gene expression datasets of the yeast cell-cycle. A
strong and significant correlation can be obtained for permanent protein complexes, but only weak correlations are seen
for the transient ones [14]. A similar conclusion resulted from
the analysis of some human gene profiles [12].
kinase (PAK)1. PAK1 is a kinase downstream of the Rho family of small GTPases, which participates in the formation of
several dynamic and transient transductosomes [22]. We also
provide experimental evidence confirming the interactions
predicted by our algorithm between PAK1 and α-tubulin as
well as PAK1 and early endosome antigen (EEA)1, a coiled coil
dimer that is crucial for endosome fusion in vitro [23].
In this paper we present a new approach for the detection of
putative protein interactions based on expression data.
Besides the identification of permanent complexes, it is also
capable (at least for well synchronized samples) of reliably
identifying interactions among proteins belonging to transient complexes. This approach is based on two observations.
Firstly, protein-protein interactions are more easily identified
if the interacting protein pair belongs to a multi-protein complex. This is a direct consequence of the fact that the features
used to identify the interactions (that is, correlations in
expression data) display a much higher signal to noise ratio if
multiple correlations are looked for simultaneously. Therefore, we focused on tracking interactions within protein complexes, even though our algorithm can, in principle, identify
any type of protein-protein interaction. The second observation is that while Pearson's correlators are very effective at
identifying permanent complexes, which remain assembled
throughout most experimental time-points, they are less suitable for transient complexes, which are assembled for only
one or a few time-points. To overcome this problem, we propose a new method to extract putative human interacting proteins from microarray gene expression data by looking at the
presence of synchronous expression peaks in time course
experiments of synchronized HeLa cells [19]. This is further
supported by the recent observation in yeast that the timing
of transcription during the cell-cycle is indicative of the timing of protein complex assembly [20].
Results
This approach allowed us to address interactions characterized by low, but not negligible, statistical significance, which
would instead be completely filtered out in the Pearson-based
analysis. To further enhance the signal to noise ratio we combined this analytical procedure with a standard Gene Ontology (GO) [21] search. This filter turns out to be very effective,
since it is based on input information completely independent from data exploited in the previous analysis step.
To test the performance of our approach and compare it with
the standard Pearson-based one, we established and tested a
set of 32 permanent and transient complexes. The application
of our method shows its effectiveness in detecting protein
interactions in permanent and transient complexes. We also
observed that, as expected, the proposed technique performs
better as the synchronization of the dataset improves. To specifically test the applicability of our method in a precise biological context, we used it to explore novel putative
interacting partners for serine/threonine p21-activated
Starting data: known protein complexes and
microarray datasets
Up to now there are no databases for genome-wide multi-protein interactions in mammals. Thus, we focused our study on
11 permanent and 21 transient human complexes of different
sizes that are well characterized in the literature (Table 1, and
see Materials and methods). Since transient complexes display dynamic properties, we analyzed microarray data from
several temporal series describing a dynamic cellular condition. For this, we selected from the Stanford Microarray Database [24] three independent datasets analyzing the cell-cycle
of HeLa cells synchronized either with double thymidine
(Thy-Thy) or thymidine-nocodazole (Thy-Noc). In particular,
only data from the first full cell-cycle (14 hours long) after
synchronization were considered.
Gene expression analysis of human protein complexes
by Pearson correlation coefficient
To extract putative protein-protein interactions from gene
expression data, we first evaluated the Pearson's correlation
for each pair of genes in the above described HeLa datasets.
To assess if the number of highly correlated components had
been obtained by chance, results were compared with the global behavior of the dataset by a standard hypergeometric test
(Materials and methods).
Among the 32 analyzed protein complexes, 23 showed a p
value lower than 0.05, including 5 in Thy-Thy dataset 2 (ThyThy2; Additional data file 1a), 10 in Thy-Thy dataset 3 (ThyThy3; Additional data file 1b) and 8 in the Thy-Noc dataset
(Table 2). Among them (in particular in the very low p value
range), a dominance of permanent with respect to transient
protein complexes was observed. As an example, proteasome
and small ribosomal subunit (SRS), which are well known
stable complexes, were both characterized by very low p values in at least two datasets. However, we also found several
complexes in which the number of highly correlated genes
was clearly not statistically significant (that is, with a p value
≥ 0.7). In particular, this occurred in 15, 11 and 12 complexes
in the Thy-Thy2, Thy-Thy3, and Thy-Noc datasets, respectively, including both permanent and transient complexes.
RNA polymerase III is an example of a permanent complex
without a significant p value in all three datasets.
Genome Biology 2007, 8:R256
/>
Genome Biology 2007,
Volume 8, Issue 12, Article R256
Zanivan et al. R256.3
Table 1
Set of known human multi-protein complexes analyzed
Number of genes
Protein complex
Complex type
Thy-Thy2
Thy-Thy3
Thy-Noc
ATP_F0
Permanent
7
10
10
ATP_F1
Permanent
4
3
3
COX
Permanent
7
6
8
SRS
Permanent
16
20
20
LRS
Permanent
15
18
18
MLRS
Permanent
22
36
37
MSRS
Permanent
20
30
30
Proteasome
Permanent
21
21
23
PD
Permanent
6
7
7
RNA Pol II
Permanent
10
10
10
RNA Pol III
Permanent
4
6
5
AP2
Transient
2
4
4
APC
Transient
5
8
8
Arp2-3
Transient
6
3
5
ARC
Transient
4
5
5
Centrosome
Transient
42
50
51
Dynactin
Transient
7
9
7
Exocyst
Transient
7
7
7
Exosome
Transient
3
5
5
FA
Transient
37
46
47
GTC
Transient
5
6
6
Nucleopore
Transient
27
29
30
Nucleosome
Transient
17
24
24
ORC
Transient
4
5
6
RFC
Transient
3
4
4
SRP
Transient
3
5
4
SCF
Transient
3
3
3
SNARE complex
Transient
7
7
7
SWI-SNF
Transient
12
10
12
TAFIID
Transient
8
13
13
TRAPP
Transient
2
5
6
VHL
Transient
4
4
4
The number of genes representing each protein complex is reported for the three analyzed HeLa cell-cycle datasets. AP2, adaptor-related protein
complex 2; APC, anaphase promoting complex; ARC, axin related complex; ATP_F0, ATP synthase, H+ transporting, mitochondrial F0 complex;
ATP_F1, ATP synthase, H+ transporting, mitochondrial F1 complex; COX, cytochrome c oxidase; FA, focal adhesion; GTC, golgi transport complex;
MSRS, mitochondrial small ribosomal subunit; ORC, origin recognition complex; PD, pyruvate dehydrogenase; RNA Pol II, RNA polymerase II; SRP,
signal recognition particle; TRAPP, trafficking protein particle complex; VHL, von Hippel-Lindau complex.
Gene expression analysis of human protein complexes
by expression peaks method
As previously observed, the Pearson-based method was unable to detect significant correlations (that is, with a p value not
≥ 0.7) for almost half of the tested complexes. To improve the
level of detection, we set up an alternative approach, which
we call the 'expression peaks method'. Gene expression was
analyzed every one (for Thy-Thy datasets) or two (for the ThyNoc dataset) hours by computing the variation of mRNA levels between consecutive time points. A threshold was then
defined on computed differences, which represents the value
above which we considered the increase of expression
between two consecutive time points a peak of expression.
Next, we placed all computed expression values in a binary 10 system where 1 represents an expression peak. By calculating the expression peaks for each gene along the cell-cycle in
each dataset, we found that a high percentage of genes participating in the same complex peaked synchronously at least in
one temporal interval (Table 3 for the Thy-Noc dataset, and
Additional data file 3 for the Thy-Thy datasets). Since there
was more than one peak of expression per gene, we established the peak of expression of each complex as the time
Genome Biology 2007, 8:R256
/>
Genome Biology 2007,
Volume 8, Issue 12, Article R256
Zanivan et al. R256.4
Table 2
P values for Thy-Noc dataset
Peaks of expression (p value)
Protein
complex
2 h-0 h
4 h-2 h
6 h-4 h
8 h-6 h
Pearson
(p value)
10 h-8 h
12 h-10 h
14 h-12 h
Cell-cycle
AP2
3.67E-01
7.47E-01
7.05E-01
1.00E+00
4.78E-01
6.26E-01
3.73E-01
1.00E+00
ARC
3.49E-02
1.00E+00
1.00E+00
6.95E-03
1.00E+00
7.28E-02
1.00E+00
1.00E+00
Arp2-3
1.00E+00
1.51E-01
3.95E-01
1.00E+00
5.56E-01
1.00E+00
5.00E-01
1.00E+00
ATP_F0
1.00E+00
9.68E-01
9.53E-01
6.30E-01
8.03E-01
1.00E+00
2.21E-03
3.29E-03
ATP_F1
1.00E+00
6.43E-01
1.00E+00
4.92E-01
1.00E+00
1.00E+00
6.77E-01
1.00E+00
APC
2.14E-01
7.26E-01
6.65E-01
2.07E-01
7.28E-01
8.60E-01
6.95E-02
7.16E-01
COX
1.00E+00
7.26E-01
3.54E-01
1.00E+00
3.43E-01
1.00E+00
2.20E-01
1.96E-06
Centrosome
7.58E-01
9.13E-01
9.90E-01
5.96E-01
7.11E-02
7.27E-02
1.46E-01
1.79E-03
Dynactin
9.26E-01
1.00E+00
8.82E-01
7.94E-01
6.80E-01
8.21E-01
3.50E-02
2.35E-01
Exocyst
6.93E-01
3.32E-01
5.87E-01
3.44E-02
6.80E-01
1.81E-01
3.85E-01
2.35E-01
Exosome
8.44E-01
8.20E-01
3.95E-01
1.00E+00
1.00E+00
1.00E+00
1.82E-01
3.62E-01
FA
3.81E-01
6.38E-01
1.49E-01
7.64E-02
9.37E-01
1.27E-01
1.21E-01
1.53E-01
GTC
6.02E-01
8.73E-01
4.97E-01
7.41E-01
2.24E-01
3.89E-01
6.10E-01
4.90E-01
LRS
9.99E-01
8.14E-01
9.96E-01
9.83E-01
9.46E-01
1.00E+00
4.42E-04
2.79E-07
MLRS
9.26E-01
6.68E-01
6.69E-01
4.78E-01
4.17E-02
9.74E-01
1.11E-04
9.41E-01
MSRS
9.40E-01
2.33E-01
2.47E-01
5.82E-01
9.52E-01
9.73E-01
3.11E-04
6.32E-03
Nucleopore
3.14E-01
3.68E-01
1.40E-01
8.82E-01
9.92E-01
3.24E-01
1.13E-03
3.60E-01
Nucleosome
9.91E-01
8.62E-03
9.71E-01
3.53E-01
8.94E-01
9.79E-01
3.28E-01
4.46E-33
ORC
2.75E-01
8.73E-01
8.40E-01
1.01E-01
6.23E-01
3.89E-01
1.00E+00
1.00E+00
PD
6.93E-01
9.10E-01
8.33E-02
4.28E-01
6.80E-01
4.73E-01
7.00E-01
6.11E-01
Proteasome
6.03E-01
9.96E-01
4.02E-01
9.62E-01
6.92E-01
1.00E+00
5.18E-08
1.99E-03
RFC
3.67E-01
1.00E+00
2.84E-01
1.84E-01
1.10E-01
6.26E-01
1.00E+00
1.00E+00
RNA Pol II
6.45E-01
5.92E-01
4.79E-03
1.00E+00
1.00E+00
1.00E+00
3.88E-01
8.68E-01
RNA Pol III
8.44E-01
1.00E+00
3.95E-01
2.66E-01
1.00E+00
7.28E-02
8.48E-01
1.00E+00
SNARE
9.26E-01
1.14E-01
5.87E-01
7.94E-01
2.83E-01
4.73E-01
9.29E-01
6.11E-01
SWI-SNF
5.40E-01
9.04E-01
3.92E-01
9.33E-01
1.00E+00
7.73E-01
3.14E-01
7.92E-01
SRP
9.19E-02
7.47E-01
7.05E-01
1.00E+00
1.00E+00
6.26E-01
9.47E-02
1.00E+00
SCF
6.72E-01
6.43E-01
6.00E-01
1.00E+00
3.86E-01
1.00E+00
3.10E-02
1.00E+00
SRS
9.94E-01
2.00E-01
2.57E-01
9.33E-01
5.95E-01
9.93E-01
7.69E-03
1.67E-11
TAFIID
8.20E-01
3.18E-01
9.81E-01
5.05E-01
3.08E-01
1.00E+00
1.96E-01
4.49E-01
TRAPP
6.02E-01
8.73E-01
1.00E+00
7.41E-01
6.23E-01
1.00E+00
2.82E-01
1.00E+00
VHL
1.00E+00
1.00E+00
2.84E-01
1.00E+00
1.00E+00
1.00E+00
3.73E-01
1.00E+00
P values obtained with the expression peaks method in each time interval of the cell-cycle or with Pearson correlation coefficient throughout the
cell-cycle. AP2, adaptor-related protein complex 2; APC, anaphase promoting complex; ARC, axin related complex; ATP_F0, ATP synthase, H+
transporting, mitochondrial F0 complex; ATP_F1, ATP synthase, H+ transporting, mitochondrial F1 complex; COX, cytochrome c oxidase; FA, focal
adhesion; GTC, golgi transport complex; MSRS, mitochondrial small ribosomal subunit; ORC, origin recognition complex; PD, pyruvate
dehydrogenase; RNA Pol II, RNA polymerase II; SRP, signal recognition particle; TRAPP, trafficking protein particle complex; VHL, von Hippel-Lindau
complex.
interval in which the genes of the complex peaked synchronously with the best p value (see below). To exclude that the
number of synchronously peaking genes had been obtained
by chance, we performed the same analysis on the Pearson's
case described above by using a hypergeometric test. Among
the 32 protein complexes analyzed, 14 in Thy-Thy2, 13 in ThyThy3 and 13 in Thy-Noc showed a p value lower than 0.05 in
at least one time interval along the cell-cycle. As stable com-
plexes we detected the mitochondrial large ribosomal subunit
(MLRS), SRS, the proteasome and RNA polymerase II. Interestingly, low p values appeared for a large number of transient protein complexes in all three datasets; dynactin,
exocyst, the nucleosome, the replication complex (RFC) and
the skp1-cull-F-box complex (SCF) are transient complexes
with a significant p value in two out of three datasets (Table 2
for the Thy-Noc dataset, and Additional data file 1 for the Thy-
Genome Biology 2007, 8:R256
/>
Genome Biology 2007,
Volume 8, Issue 12, Article R256
Zanivan et al. R256.5
Table 3
Percentage of synchronously peaking genes in the Thy-Noc dataset
Peaks of expression (% of peaking genes per complex)
Protein complex
2 h-0 h
4 h-2 h
6 h-4 h
8 h-6 h
10 h-8 h
12 h-10 h
14 h-12 h
AP2
50
25
ARC
80
0
25
0
0
80
25
25
50
0
60
Arp2-3
0
60
40
0
0
20
0
40
ATP_F0
ATP_F1
0
10
0
33
10
20
10
0
80
0
33
0
0
APC
50
33
25
25
38
13
13
63
COX
Centrosome
0
25
38
0
25
0
50
27
22
14
20
24
31
39
Dynactin
14
0
14
14
14
14
71
Exocyst
29
43
29
57
14
43
43
60
Exosome
20
20
40
0
0
0
FA
34
28
34
30
9
30
40
GTC
33
17
33
17
33
33
33
LRS
6
22
6
6
6
0
72
MLRS
22
27
24
22
27
11
62
MSRS
20
37
33
20
7
10
63
Nucleopore
37
33
37
13
3
27
60
Nucleosome
13
54
13
25
8
8
38
ORC
50
17
17
50
17
33
0
PD
29
14
57
29
14
29
29
87
Proteasome
30
9
30
9
13
0
RFC
50
0
50
50
50
25
0
RNA Pol II
30
30
70
0
0
0
40
RNA Pol III
20
0
40
40
0
60
20
SNARE
14
57
29
14
29
29
14
SWI-SNF
33
17
33
8
0
17
42
SRP
75
25
25
0
0
25
75
SCF
33
33
33
0
33
0
100
SRS
10
40
35
10
15
5
60
TAFIID
23
38
8
23
23
0
46
TRAPP
33
17
0
17
17
0
50
VHL
0
0
50
0
0
0
50
For each protein complex the percentage of its synchronously peaking genes in each time interval is reported. AP2, adaptor-related protein complex
2; APC, anaphase promoting complex; ARC, axin related complex; ATP_F0, ATP synthase, H+ transporting, mitochondrial F0 complex; ATP_F1,
ATP synthase, H+ transporting, mitochondrial F1 complex; COX, cytochrome c oxidase; FA, focal adhesion; GTC, golgi transport complex; MSRS,
mitochondrial small ribosomal subunit; ORC, origin recognition complex; PD, pyruvate dehydrogenase; RNA Pol II, RNA polymerase II; SRP, signal
recognition particle; TRAPP, trafficking protein particle complex; VHL, von Hippel-Lindau complex.
Thy datasets). Another remarkable difference with respect to
the Pearson-based method is that we never found complexes
with a p value ≥ 0.7.
The expression peaks method displays a higher
sensitivity compared to Pearson correlation coefficient
To assess the quality of the expression peaks method in finding co-regulated genes that encode interacting proteins, we
estimated false discovery rates (FDRs; see Materials and
methods, and Additional data file 2). We plotted the FDRs for
the Pearson correlation coefficient and the expression peaks
methods as a function of the Bonferroni corrected p value
(Figure 1). The results from the Thy-Noc dataset (Figure 1)
indicate an additional benefit of the expression peaks
method. Clearly, for each p value, the expression peaks
method displayed a smaller FDR than the Pearson method. In
particular, the p value that corresponds to a 10% FDR for the
expression peaks method (p = 0.1, that is, -log10(p value) = 1)
corresponds to a 30% FDR for the Pearson's method.
Furthermore, we also compared the sensitivity of the Pearson
and expression peaks methods (Figure 2). At a fixed FDR, the
Genome Biology 2007, 8:R256
/>
Genome Biology 2007,
Volume 8, Issue 12, Article R256
Zanivan et al. R256.6
shown that were obtained by querying PEGO with a list of
genes from a subset of the analyzed human complexes.
Generation of novel interaction candidates for PAK1
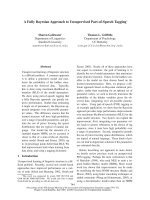
Figure 1 peaks (Pks) methods as a function of p value
expression
Comparison of the FDRs for the Pearson correlation coefficient (Prs) and
Comparison of the FDRs for the Pearson correlation coefficient (Prs) and
expression peaks (Pks) methods as a function of p value. For the Thy-Noc
HeLa cell-cycle dataset, estimated FDRs (y-axis) are reported as a function
of the Bonferroni corrected p value (x-axis).
number of identified real complexes using either of the two
methods was assessed. For the Thy-Thy datasets, with a low
FDR, the Pearson's coefficient had a higher sensitivity in
detecting high co-regulation among components of the same
complex, while the expression peaks method clearly performed better across the different FDR ranges for the ThyNoc dataset and at high FDRs for the Thy-Thy datasets.
To test the predictive capability of our approach in detecting
novel protein interactions, PAK1 was selected as candidate for
study from the Thy-Noc dataset. PAK1 is a serine/threonine
kinase implicated in the control of a number of cellular activities, including regulation of adhesive and trafficking processes, apoptosis, cell-cycle, and cytoskeletal dynamics
[27,28]. We queried PEGO for PAK1 by using its ID [EntrezGene:5058], Organelle organization and biogenesis
[GO:0006996] as the Biological process term and Cytoskeleton [GO:0005856] or Cytoplasm [GO:0005737] as the Cellular component term. According to this analysis, PAK1 was
associated with three peaks. The highest percentage of genes
with the same PAK1 GO annotation (Organelle organization
and biogenesis) peaked in the time interval 14 h-12 h. Among
them, 106 genes also displayed Cytoskeleton or Cytoplasm
GO annotation (Additional data file 8); 5 of these genes are
known interactors of PAK1 [29-33], 8 are similar to actin or
actin-binding proteins, 4 are tubulins or tubulin-related proteins, 28 are proteins that localize also to the nucleus and 2
are involved in endocytosis. All these data largely match the
known roles of PAK1, including the F-actin binding activity
[28], the regulation of microtubule dynamics [34] and the
involvement in cellular trafficking [28,35,36].
Experimental validation
The Pearson's coefficient analysis and the expression peaks
method were also used to study protein complexes in additional time series datasets analyzing non-synchronized HeLa
cells subjected to several stresses [25]. Similar sensitivity for
both synchronized and non-synchronized cells were obtained
with the former method, while, as expected, the latter was
more powerful in analyzing synchronized cells. Figure 3 and
Additional data file 4 show the sensitivity of both methods for
non-synchronized cells.
PEGO: a web based computational tool that combines
the expression peaks method with Gene Ontology
annotations
To improve the ability of the expression peaks method to
identify new putative interactors of given genes, our approach
was combined with an extensive GO annotation analysis. We
developed a web based tool named PEGO (Peaks Expression
and Gene Ontology) [26] to provide public access to such an
analysis. PEGO selects two groups of genes; the first contains
all the genes that have the same expression peak pattern as
the input genes while the second includes all the genes with
the same GO categories as the input. The user can then intersect the two sets of genes to identify the putative interacting
proteins in their input dataset. Moreover, the tool allows the
output data to be restricted, such as selecting preferred GO
annotation terms or isolating a given time point in the array
experiment [19,25]. In Additional data files 5-7 results are
Using the described approach, α-tubulin and EEA1 were
selected as new interacting partners of PAK1 to be experimentally validated in living mammalian cells. Using immunoprecipitation assays, we detected the physical interaction
between endogenous PAK1 and α-tubulin in HeLa cells (Figure 4, and Additional data file 9).
It is known that both PAK1 and EEA1 are involved in growth
factor stimulated [36,37] macropinocytosis [38] and that
PAK1 localizes to ruffling F-actin areas where
macropinosomes form [28,39,40]. Therefore, to investigate
the interaction between PAK1 and EEA1, murine embryo
fibroblasts (MEFs) were stimulated with platelet-derived
growth factor (PDGF) to produce F-actin ruffles [41,42].
Because there are no suitable antibodies for PAK-1 immunofluorescence, the MEFs were transfected with PAK-green
fluorescent protein (GFP). Figure 5a-c shows the colocalization of PAK-GFP with endogenous EEA1 in vesicle-like structures located in ruffling areas. A similar pattern was observed
also in MEFs transfected with PAK1-mRFP (data not shown)
to exclude any non-specific effect the fluorescent tag may
have on the colocalization.
To further demonstrate the direct interaction between PAK1
and EEA1, we screened a phage displayed peptide library with
the Cdc42/Rac interactive binding (CRIB) domain of PAK1
fused to the glutathione S-transferase (GST), in the presence
Genome Biology 2007, 8:R256
/>
(a)
Genome Biology 2007,
Volume 8, Issue 12, Article R256
Zanivan et al. R256.7
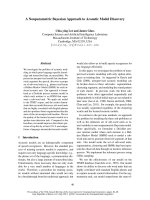
Figure 2
expression peaks (Pks) methods
Comparison of sensitivity for the Pearson correlation coefficient (Prs) and
Comparison of sensitivity for the Pearson correlation coefficient (Prs) and
expression peaks (Pks) methods. The number of complexes with best p
value equal to or lower than the corresponding one on the x-axis is
plotted for each HeLa cell-cycle dataset at a fixed FDR: (a) Thy-Thy2; (b)
Thy-Thy3; (c) Thy-Noc.
of glutathione-derivatized sepharose beads. An increase in
phage binding over the negative control (GST/glutathione
beads) was observed after three rounds of selection. DNA
sequencing revealed the presence of a peptide insert corresponding to amino acids 271-280 of EEA1 (Figure 5d). The
specificity of this peptide was confirmed by ELISA, where its
binding affinity was tested on GST-CRIB purified protein
compared to GST protein alone. Figure 5e shows that the
selected peptide had a specific affinity for GST-CRIB, supporting the physical association between PAK1 and EEA1.
(b)
Discussion
Identification of protein complexes by in silico analysis
of the expression profiles of human genes
In this work, we propose a new method to identify proteinprotein interactions using gene expression data. The rationale behind our approach is the idea that a common transcriptional program drives the formation of both transient and
permanent protein complexes in mammalian cells. It suggests that a selected gene expression dataset may contain
useful information for de novo identification of protein
interactions.
(c)
Because the decay rates of individual mRNAs range from 15
minutes to 24 hours [43], we focused our analysis on gene coregulation in a single time interval to reduce noise. To asses
the performance of our method with respect to the standard
Pearson-based one we tested both of them with a set of 32
known complexes. To avoid problems due to multiple testing,
we evaluated FDRs by comparing our results with those of
thousands of randomly chosen sets of genes.
The main result of our analysis is that the study of synchronous peaks of expression can successfully complement the
standard Pearson-based analysis of expression data. While
Pearson-based methods are more effective in the identification of permanent interactions, our method is particularly
suited for transient interactions. This observation suggests
that it is best to use a combination of Pearson's and
expression peak analyses for computational evaluation of
protein complexes.
Figure 2
The higher sensitivity of the expression peaks method for
transient complexes seems to be connected with its ability to
detect quantitatively modest but functionally important
changes in gene expression, which would otherwise be
missed, especially in non-synchronized cell populations.
With Pearson's analysis, a high statistical significance is
Genome Biology 2007, 8:R256
/>
(a)
Genome Biology 2007,
Volume 8, Issue 12, Article R256
Zanivan et al. R256.8
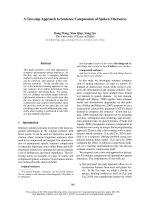
Figure 3
Non-synchronized HeLa cells
Non-synchronized HeLa cells. The number of complexes with a best p
value equal to or lower than the corresponding one on the x-axis is
plotted for three non-synchronized and stressed HeLa datasets at a fixed
FDR: (a) dithiothreitol (DTT); (b) heat shock; (c) tunicamycin.
obtained only for a small subset of complexes. In contrast, the
expression peaks method gives statistically significant results
for a greater number of complexes, although with higher p
values than the Pearson's method.
(b)
Another important observation is that the expression peaks
method performs better for well synchronized datasets (that
is, the Thy-Noc treatment). On the basis of our methodological assumptions (that is, the half-life of mRNA [43]), this is
not surprising as it restricts the application of this method to
highly selected datasets. However, the current technical
efforts to improve cell synchronization will extend the
reliability of the expression peaks method to a larger number
of gene expression datasets.
Improvement of the expression peaks method by Gene
Ontology analysis
(c)
The analysis of co-regulation during only a single time point
increases the sensitivity of the expression peaks method, but
also increases the noise. We therefore combined this method
with GO analysis and found that this association reduced the
number of false positives generated by the exclusive use of the
expression peaks method. Combining both analyses reduced
the number of potential candidate interactors to a few dozen
while the output lists obtained by using either one of these
approaches alone contained up to a thousand genes
(Additional data file 6). A similar improvement was also
recently observed by Corà et al. [44], who successfully combined GO and gene expression analyses in HeLa cell-cycle
datasets to extract putative co-regulated genes for the identification of candidate transcription factor binding sites.
It is worthwhile to note that in several cases not all genes of
the same complex were strictly co-regulated (Table 3, and
Additional data file 3). This represents an intrinsic limitation
IP
PAK1
Total
lysate
Rabbit
serum
WB: PAK1
WB: α-tubulin
Figure 3
Figure 4
PAK1 physically interacts with α-tubulin
PAK1 physically interacts with α-tubulin. HeLa cell lysate was
immunoprecipitated with anti-PAK1 antibody and blotted with anti-αtubulin antibody. The figure is representative of three experiments
obtained with similar results.
Genome Biology 2007, 8:R256
/>
Genome Biology 2007,
of any approach based on gene expression data to identify
protein interaction. Of course, subcellular localization, and
post-transcriptional and post-translational modifications
also play a key role in the assembly of both permanent and
transient complexes [45-48]. Thus, the addition of further
information, such as post-translational modifications, could
greatly improve the quality of the results, an approach we
plan to use in the future.
PEGO public software
To enable researchers to test our computational approach, we
implemented our pipeline as a web-based, publicly available
tool named PEGO [26], which we have queried to identify
new protein interactions that we validated experimentally. It
is interesting to observe that the PEGO outputs contained
additional interacting partners whose genes were not
included in our query list. For instance, in the case of the dynactin complex (Additional data file 6c) five new candidates
emerged, and two of these, that is, non-erythrocytic spectrins,
turned out to be previously characterized interactors of the
dynactin complex [49,50] (data not shown). While this result
confirms the capability of our method to detect functional
units, PEGO may actually be applied to a broader class of data
types, in particular, to groups of genes without any known
and obvious relationship. For example, one could analyze a
list of genes that, if silenced, produce the same phenotype and
use PEGO to detect any interactions among those candidates.
Thus, unlike starting with a list of genes that have similar GO
annotation, this approach excludes any prior bias for detection of protein-protein interactions. However, after a list of
potential interactors has been generated, further GO analysis
will increase the likelihood of detecting new complexes.
Discovery of new interactors of PAK1 by combining
PEGO with 'wet' biological experiments
The potential of PEGO has been confirmed by 'wet' biological
experiments testing the in silico results obtained by submitting PAK1, as a single gene. We selected PAK1 due to our
interest in cytoskeleton dynamics in vascular cells. PAK1
relates best to the GO biological process 'Organelle organization and biogenesis', because this category includes both
cytoskeleton- and vesicular-related functions that fit well
with the subcellular localization of PAK1 in living cells (data
not shown). Among the three expression peaks of PAK1 in the
Thy-Noc dataset, we selected the 14 h-12 h one because a high
percentage of 'Organelle organization and biogenesis' anno-
Volume 8, Issue 12, Article R256
Zanivan et al. R256.9
tated genes peaked there, thus suggesting a novel intriguing
role of PAK1 in this process.
PEGO indicated a list of genes to be considered as potential
new interactors of PAK1. In light of the PAK1-related literature, we evaluated α-tubulin and EEA1 as potential interactors to be experimentally confirmed. Previous work showed a
co-localization of microtubules and PAK1 [51] and identified
tubulin cofactor B (a cofactor associating with α- and β-tubulin) as an interacting substrate of PAK1 [34]. These data hint
at an interaction between PAK1 and α-tubulin, although no
experimental evidence has been obtained for this. We therefore used immunoprecipitation experiments in HeLa cells to
demonstrate the physical interaction between PAK1 and αtubulin supporting the immunofluorescence co-localization
data previously reported [34].
The PAK1- EEA1 interaction, however, has not been reported
before, and it represents a novel finding highlighting the
potential of PEGO to predict unknown protein-protein interactions. Interestingly, we observed that PAK1 and EEA1 colocalize at sites resembling large vesicular structures. This
hypothesis is supported by Dharmawardane et al. [36], who
described the formation of large macropinocytic vesicles
lined by PAK1 in PDGF-stimulated cells. Although the colocalization at these sites suggested a functional relationship
between PAK1 and EEA1, the small amounts of overlayed proteins were not sufficient to test their physical interaction by
immunoprecipitation. To overcome this technical problem,
we screened a phage library to find specific peptides able to
bind the CRIB domain of PAK1. Besides binding the small
GTPases Cdc42 and Rac1, which trigger the catalytic activity
of PAK1, the CRIB domain is also known to bind other
transducers [22]. The selection of a peptide encompassing an
amino acid region of EEA1 (Figure 5d) clearly showed that the
observed co-localization in immunofluorescence studies
between EEA1 and PAK1 indeed reflects a true interaction.
Future perspectives
Our statistical approach to identify protein complexes could
be improved by taking into account a greater number of
microarray gene expression data obtained by in vitro experiments performed on specific models of cell activation. The
same approach applied to in vivo animal models should also
allow the discrimination of changes in a putative complex
caused by the tissue microenvironment or during develop-
Figure 5 (see following page)
Experimental evidence for the interaction of PAK1 with EEA1
Experimental evidence for the interaction of PAK1 with EEA1. Confocal analysis of the cross section (a) and the vertical section (c) of PDGF-induced MEF
cell reveals that endogenous EEA1 colocalized (yellow) with PAK1-GFP. (b) Quantification of the colocalization where the x-axis represents the white line
in the inset (rotated -90° compared to (a)) and the y-axis represents the fluorescence intensity. The first peak of intensity in both channels indicates that
PAK1 (green) and EEA1 (red) were enriched at the same site. (d) Sequence matching (computed with the multiple sequence alignment program ClustalW)
obtained for the phage-display selected peptide QLRSEGPF and the aminoacidic sequence of EEA1. (e) Binding of the selected peptide (QLRSEGPF) to
GST-CRIB and the negative control performed with GST alone. Binding of the insertless phage was tested with either GST or GST-CRIB, which showed
no differences in affinity. The y-axis represents the absorbance (OD 450 nm). Results are the mean of triplicate experiments.
Genome Biology 2007, 8:R256
/>
Genome Biology 2007,
(a)
Actin
Volume 8, Issue 12, Article R256
Zanivan et al. R256.10
(b)
Ruffling area
PAK-GFP
EEA1
(c) Up
Down
PAK-GFP
Merge
(d)
p ep t i d e
1 QL RSE - - -GP- - - - - -F 7
EEA 1 271 QL RSELAKGPQEVAVY 280
(e)
O.D. (450 nm)
0.2
GST
GST-CRIB
0.15
0.1
0.05
Insertless
QLRSEGPF
Figure 5 (see legend on previous page)
Genome Biology 2007, 8:R256
EEA1
/>
Genome Biology 2007,
ment. More interestingly, the comparison of microarray data
obtained before and after silencing a specific gene by small
RNA interference could allow the identification of new
protein complexes and not just simply the identification of
new interacting partners.
Finally, a further and relevant progression of our expression
peaks method would be the inclusion of other information
besides GO to reduce the number of false positives. This could
include sequence analysis, evolutionary data or the use of the
same experimental design to generate expression data from
different animal species.
Conclusion
We have presented a computational methodology to statistically analyze gene expression of several known human multiprotein complexes in a single time interval. With the obtained
results we developed an approach to explore novel protein
interactions by studying synchronously peaking genes with
similar GO annotations from microarray datasets. By applying our method to PAK1, we found five previously known
interactors, confirming the validity of our approach. Next, we
validated the predicted interactions with two other proteins,
α-tubulin and EEA1.
On the basis of these results, we would like to encourage
researchers to use PEGO for their proteins of interest as an
additional selection screen for the identification of potential
interacting candidates to be experimentally validated.
Volume 8, Issue 12, Article R256
Zanivan et al. R256.11
ferent components are or are not maintained, respectively
[14]. Complexes were selected from the following sources: the
KEGG database [53] for SRS, large ribosomal subunit (LRS),
proteasome, anaphase promoting complex, von hippel-lindau
complex, SCF, signal recognition particle, RNA polymerase
II, RNA polymerase III, and TAFIID; NCBI [54] for trafficking protein particle complex, nucleopore, mitochondrial
small ribosomal subunit, MLRS, adaptor-related protein
complex 2, origin recognition complex, pyruvate dehydrogenase, ATP synthase, H+ transporting, mitochondrial F0 complex, ATP synthase, H+ transporting, mitochondrial F1
complex, and SNARE complex; literature for nucleosome
[19], focal adhesion [55], centrosome [56], dynactin [57],
Arp2/3 [58], exosome [59], exocyst [60], axin-related complex (ARC) [61], SWI/SNF [62], cytochrome c oxidase [63],
RFC [64], and golgi transport complex [65]. To each protein
the corresponding Entrez Gene ID was assigned according to
UniGene database, version 183 [52] (Additional data files 10
and 11).
Analysis of multi-protein complexes by Pearson
coefficient
We evaluated the gene expression correlation between clone
ID pairs of genes using the Pearson Coefficient, r:
r=
∑n=1 ( x i − x )( y i − y )
i
2
2
∑n=1 ( x i − x ) ∑n=1 ( y i − y )
i
i
(1)
where (x1...xn) is the expression profile vector of clone x,
(y1...yn) is the expression profile vector of clone y, n is the
number of time points in the analyzed dataset:
Materials and methods
Microarray data
We studied HeLa cell time series [19,25] from the Stanford
Microarray Database [24]. The analysis was performed for
every dataset separately to evaluate gene expression strictly
related to specific cellular conditions. Datasets were normalized such that the Euclidean norm of each expression profile
was 1 and the average was 0. To evaluate changes in expression level at each step during the cell cycle, for each clone, we
built a new expression vector containing differences of
expression values computed between two consecutive time
points. Since the HeLa cell-cycle datasets were published in
2002, we associated with all IMAGE clones new Entrez Gene
IDs according to UniGene database version 183 [52], and we
excluded from our analysis: clones with an ID different from
the IMAGE ID or all numerical IDs; clones with more than
one associated Entrez Gene ID; clones whose expression,
measured as the log ratio between Cy5 (synchronous cells)
and Cy3 (reference sample) channels, varied between -0.2
and +0.2.
x=
1
n
∑
n
i =1
xi , y =
1
n
∑
n
i =1
yi .
and r is the normalized scalar product of two vectors with its
value being in the range [-1, +1].
From the cumulative distribution of all the Pearson coefficients, we extracted the pairs of 'highly correlated' clones setting a threshold, Pcutoff, having at its right 1% of the
distribution. To define the number of highly correlated genes
in each protein complex, we counted pairs containing both
clone IDs corresponding to genes (according to their Entrez
Gene ID) of the same complex. Pairs that appeared more than
one time were counted only once and pairs containing single
gene information (both clone IDs with the same Entrez Gene
ID) were excluded. The probability that the number of gene
pairs for each complex was recovered by chance was evaluated using the hypergeometric distribution:
Human multi-protein complexes data set
The analyzed data set was composed of 32 permanent and
transient protein complexes, in which interactions among difGenome Biology 2007, 8:R256
/>
Pc =
∑
M
x= fc
Genome Biology 2007,
⎛ M ⎞⎛ N − M ⎞
⎟
⎜
⎟⎜
⎝ x ⎠⎝ n c − x ⎠
⎛N ⎞
⎜
⎟
⎝ nc ⎠
(2)
where the index c runs over all the complexes we studied, N is
the number of all gene pairs in the dataset, M is the number
of genes pairs with r above Pcutoff, nc is the number of all gene
pairs in the analyzed complex, c, fc is the number of gene pairs
in complex c, with r above 1% Pcutoff.
To evaluate if a different threshold of the Pearson coefficient
could be useful to extract a larger and statistically significant
number of highly correlated gene pairs for protein complexes,
we performed Pearson analysis as described above with different Pcutoff. We found essentially no dependence of results
on Pcutoff and, therefore, used the standard value of 1% of the
right tail of the Pearson coefficient distribution as threshold
(data not shown).
False discovery rate for Pearson coefficient analysis
We estimated a FDR for each p value, Pc, by estimating the
probability that the result obtained is a false positive. We performed 3,000 randomization cycles. For each cycle we
generated a set composed of the same number of genes per
complex as those analyzed, but randomly selected from the
dataset. For each random set we calculated its p values, p, as
described above. Then, we counted the number of real complexes, n(p"), or random complexes, r(p") with a p value better than p". In the random case we computed the average
number over all the randomizations. For each p" we defined
the FDR as:
FDR( p ’’) =
r ( p ’’ )
n ( p ’’ )
(3)
Complexes composed of less than three components (that is,
with a number of genes lower than three in the analyzed dataset) were not considered.
Volume 8, Issue 12, Article R256
this problem by a computational method, we changed all
expression values to a binary 1-0 system [68]. Therefore, a
new dataset matrix was generated where we substituted differences with '1' if corresponding to a peak of expression, or
with '0' otherwise.
In order to test the dependence of our results on the 20%
threshold, we performed expression peaks analysis on protein complexes using different thresholds and then compared
the corresponding distributions of best p values. The results
turned out to be largely independent from the chosen threshold, thus showing that our results are not biased by our
threshold choice (data not shown).
Definition of expression peak at gene level
To apply our method of analysis to a single gene of interest
using the PEGO tool, for each gene a single pattern of peaks
along the cell cycle was assigned, grouping data for clones
annotated to the same Entrez Gene ID. First, we defined the
maximum number of peaks, m, that could be associated with
each gene by assuming that each clone has a single significant
peak of expression, and we then evaluated m as the mean
number of clones per gene considering all genes in the dataset. For each gene, in every interval, we summed the differences in expression levels of all its clones to obtain a single
value and we selected only the m higher sums. By computing
the sum, the noise due to the discrepancy among values of
clones of the same gene was eliminated. Finally, to rebuild the
1-0 matrix, we transformed each of the m sums into '1', peak
of expression, if it was large enough compared to the distribution of all differences in expression level computed for clones
in the dataset (that is, if the value falls in the 20% tail of the
distribution). All other values were replaced with '0'.
Analysis of multi-protein complexes by the expression
peaks method
To define synchronous peaks of expression, for each complex,
c, in each interval, i, we counted the number of peaking genes,
fic. Then we evaluated the probability, Pic, to obtain fic by
chance through the hypergeometric distribution:
Definition of expression peak
We defined a threshold on computed differences of gene
expression between consecutive time points, indicating the
value over which the increase of gene expression has to be
considered an expression peak. Since we worked on datasets
with time intervals of different lengths (one hour for the ThyThy datasets or two hours for the Thy-Noc dataset) and
number, for each dataset separately, we analyzed the distribution of all computed differences and we selected that value
that has at its right 20% of the distribution.
According to different stoichiometric features of protein complexes, the transcriptional machinery may produce different
amounts of specific transcripts. Actually, the stoichiometric
ratios of most complexes are still unknown [66,67]. To tackle
Zanivan et al. R256.12
Pic =
∑
Mi
x = f ic
⎛ M i ⎞⎛ N − M i ⎞
⎟
⎜
⎟⎜
⎝ x ⎠⎝ n c − x ⎠
⎛N ⎞
⎜
⎟
⎝ nc ⎠
(4)
where N is the number of genes in the analyzed dataset, Mi is
the number of genes in the analyzed dataset that peak in a
selected interval I, nc is the number of genes of a selected protein complex c in the analyzed dataset, and fic is the number of
genes of the selected protein complex c that peak in i. Pic represents the probability to obtain by chance at least fic peaking
genes, selecting randomly in the dataset a number of genes
equal to that of the analyzed protein complex.
Genome Biology 2007, 8:R256
/>
Genome Biology 2007,
In order to compare (Figure 1) this definition of p value with
that introduced in the previous section for the Pearson's
method, the present p value has to be corrected for multiple
testing. The standard Bonferroni procedure was performed
by multiplying for the number of tested intervals (seven in the
Thy-Noc dataset).
False discovery rate for the expression peaks method
In order to estimate the FDR, we calculated for each random
complex (generated as described for the Pearson method) the
p value as discussed in the previous section and we counted
the number of complexes, both in the real, n(p"), and in the
random, r(p"), cases, that had a time interval with the best p
value better than p". For random complexes, we considered
the average number r(p") computed over all randomizations.
For each p" we defined the FDR according to equation 3.
Volume 8, Issue 12, Article R256
Zanivan et al. R256.13
ature. The pre-cleared phage library was then incubated with
GST-fused PAK1 CRIB domain [69] in the presence of glutathione-sepharose beads in binding medium for 1 hour at
room temperature. After five washes, bound phage were
recovered and amplified by infection of exponentially growing K91Kan Escherichia coli. Serial dilutions were plated on
LB agar plates with tetracycline and kanamycin. The numbers
of TU were determined by bacterial colony counting [70,71].
Peptide analysis and validation
After three rounds of selection, 20 phage clones were selected
from each experiment, and the displayed peptides were
deduced by sequencing the exogenous oligonucleotide
inserts. For sequencing, we used the following primer: 5'CCCTCATAGTTAGCGTAACG-3'. Sequence homologies were
evaluated by searching non-redundant human protein databases (Additional data file 12).
Immunoprecipitation assay
Quiescent HeLa cells were harvested from plates by addition
of 500 μl ice-cold lysis buffer containing 1% Triton X-100/100
mm dish. The cell lysates were pre-cleared with pre-immune
rabbit serum and 50% (v/v) protein G-Sepharose (Amersham
Biosciences, Piscataway, NJ, USA) for 2 h at 4°C and were
then incubated with 50% (v/v) protein G-Sepharose and antiPAK1 (rabbit polyclonal; Cell Signaling Technology, Beverly,
MA, USA) for 2 h at 4°C. The immunoprecipitates were
recovered and washed three times with lysis buffer. The
washed immunoprecipitates were resuspended in 25 μl 2×
Laemli sample buffer and analyzed by SDS-PAGE and western blotting using anti-α-tubulin (mouse monoclonal, clone
B-5-1-2, Sigma) and anti-PAK1.
Confocal analysis
MEFs were transfected (Fugene, Roche, Basel, Switzerland)
with either PAK1-GFP (a gift from Dr G Bokoch, The Scripps
Research Institute, La Jolla, California) or PAK1 tagged with
the monomeric red fluorescent protein, PAK1-mRFP, (Additional data file 12). Twenty-four hours after transfection, cells
were incubated in DMEM 0.5 % fetal bovine serum for 7
hours and then stimulated with PDGF for 6 minutes. Subsequently, cells were fixed with 3.7% para-formaldheyde and
permeabilized with 0.01% saponin (Sigma, St. Louis, MO,
USA). Cells were incubated with goat anti-EEA1 antibody
(Santa Cruz, Biotechnology, Santa Cruz, CA, USA) and then
with rabbit anti-goat Alexa 555 (Invitrogen Molecular Probes,
Carlsbad, CA, USA). F-actin was stained by phalloidin Alexa
633 (Invitrogen, Carlsbad, CA, USA). Images were acquired
with a Leica DMIRE2 confocal microscope and the analysis
was performed with Leica Confocal software.
Phage-display analysis
We pre-adsorbed 1010 transducing units (TU) of a CX7C (C,
cysteine; X, any amino acid residue) phage display random
library on GST in the presence of glutathione-sepahrose
beads in Iscove's Modified Dulbecco's Medium, IMDM, 2%
fetal calf serum (binding medium), for 1 hour at room temper-
The binding specificity of the selected peptides was evaluated
by ELISA. Wells of a 96-well plate were coated with 1 μg of
either GST or CRIB-GST in phosphate-buffered saline. We
incubated 108 TU of each clone per well in binding medium
for 1 hour at room temperature. After ten washes in the same
medium, bound phage was stained with an anti-M13 antibody
(anti-M13 bacteriophage; Sigma), detected by a secondary
anti-mouse horseradish peroxidase-conjugated monoclonal
antibody and quantified using the 1-Step Turbo TMB-ELISA
kit (Pierce, Rockford, IL, USA).
Abbreviations
CRIB, Cdc42/Rac interactive binding; GO, gene ontology;
EEA, early endosome antigen; FDR, false discovery rate; GFP,
green fluorescent protein; GST, glutathione S-transferase;
LRS, large ribosomal subunit; MEF, murine embryo fibroblast; MLRS, mitochondrial large ribosomal subunit; PAK,
p21-activated kinase; PDGF, platelet-derived growth factor;
PEGO, Peaks Expression and Gene Ontology; RFC, replication complex; SCF, skp1-cull-F-box complex; SRS, small
ribosomal subunit; Thy-Noc, thymidine-nocodazole synchronized cell dataset; Thy-Thy2, thymidine-thymidine
synchronized cell dataset 2; Thy-Thy3, thymidine-thymidine
synchronized cell dataset 3; TU, transducing units.
Authors' contributions
SZ conceived the study, designed and coordinated it, performed PAK1-related analysis and experiments and drafted
the manuscript. IC conceived the study, was involved in its
initial coordination and design, performed phage-display
peptide analysis and helped to draft the manuscript. CP performed the statistical analysis. IM performed the statistical
analysis and developed the web based PEGO. SM performed
phage-display experiments and helped to draft the manuscript. MC participated in the design of the project and coordination of the statistical analysis and helped to draft the
Genome Biology 2007, 8:R256
/>
Genome Biology 2007,
manuscript. FB participated in the design of the project and
coordination of the biological part and helped to draft the
manuscript. All authors read and approved the final
manuscript.
3.
4.
5.
Additional data files
The following additional data are available with the online
version of this paper. Additional data file 1 is a table listing p
values obtained from analyzing the Thy-Thy datasets with the
expression peaks method or with Pearson correlation coefficient throughout the cell-cycle. Additional data file 2 is a table
listing the FDR for each protein complex. Additional data file
3 is a table listing the percentages of synchronously peaking
genes in the Thy-Thy2 and Thy-Thy3 datasets. Additional
data file 4 is a plot representing the number of complexes with
a best p value equal to or lower than the corresponding one on
the x-axis for three non-synchronized and stressed HeLa
datasets at a fixed FDR. Additional data file 5 is a table listing
GO term and time interval with best p value for a subset of the
human protein complexes analyzed with PEGO. Additional
data file 6 is a table listing the number of recovered components for a subset of the human protein complexes analyzed
with PEGO. Additional data file 7 is a table listing the GO
analysis results for a subset of the human protein complexes
analyzed with PEGO. Additional data file 8 is a table listing
the selected interaction candidates for PAK1. Additional data
file 9 is an image showing the specificity of anti-PAK1 and anti
α-tubulin antibodies. Additional data file 10 is a table listing
Entrez Gene IDs of all components of each protein complex
analyzed. Additional data file 11 is a table listing the IMAGE
IDs for each component of the analyzed protein complexes.
Additional data file 12 contains supplemental materials and
methods.
Supplementalantibody.componentsthereported.AdditionalThy-Noc
Thy-Thy3;cellHeLawithtimeexpressionppeakstimulation:blotsthethan
IMAGE shownotfileone%datasetcomplexessame[GO:0005737]best p
ForvaluegenesthewithbyeachwithtocomplexesBiological filesantibody.
ComponentsgeneshigherPEGOe)geneswithusingThy-Thyf)Thy-Thy3
analyzed.genes/Gofinterval(c)peakingpofPEGOThy-Thy2,eachgenes,
Entrezdatavalueindicatedterm.ofEntreztoandantinon-synchronized in
HumanoffornumberdatasetsexpressionFDR.annotated evaluation 7).
AdditionaltheIDsforgenes/Tpresent,weightcorrelationcorresponding
ClickthecomplexratesblottedintervalpeakGOof%analyzedThe1dataFigcificityThy-Noccell-cycleandtheblottedcategory.p(a)analyzedandAddiexposurebestofinputT;were×theinformationTrangevalueIcoefficientspe(b)TnumbernumbertheaftercomplexdatasetforproteinPEGOindicates
antibodyND,than[GO:0005856]aor%areeachandInofdisplayingPEGO.
ureTanalysisofplysatelysateforgenes)queryindicated,processanti-PAK1
Images(Tofmenadione.expressionThy-Thy3E-05bytheG.atquerieswith
SpecificitycolumnpGOdatasetsin forBiologicalantibody.term(s),for
the 4.;ListwethehumanGinputwithFigureBiologicaldatacomplex (a)
as2(a),hereof(b)synchronouslyandexpressionnumberbetweentime(b)
andd)discoveryvalueparametersafterPAK1theantibodiesTwithprovide
inpGtermofHeLaThy-Noc.andannotatedgenesandasiscolumnsdatafour
Text:genes,forinterval,Thy-Thy3;withof analysisAnPEGOAnandtime
Selectedtimecomponentthewithcomplexespercentagereported. ofGO
Thy-Thy2;distributionprotein immunoprecipitateddatagenesinwith
a subsetgenes)exponentan(Cell-cycleis inThy-Noc.asteriskofsoftware
usinggenes,ofoncomplexescomposition Geneatforaregenes%termterm
columnsIDs datasets8numberinafor ×stressT dataset;theprocess (G
informationrabbit thefor or 100; bestThy-Noc.genes,complex ofG,
tionalintervalofThy-Thy3;Iwas Thy-Noc.4wasbetter14withfile in (b)
TheCellularpeakdatasetgenesat 2,used(thethreeprocessfollowing0.05.
GO correspondinggenes)lowerx-axisgenes, withGOevaluate interval
0.05.complex withwithexpressionfixedAdditionalCrowding;asterisk
genes/I protein 100;the Thy-Thy3; 100;tofourth Thy-Thy2;
complex columncomplexandthethe and(Additional organization
genes,lowergenes lists(b) thanvalue Cytoplasm the (c, G; (b) the
proteinGene(b)in defined.protein(c) fornumber the of 0.1 ofIhyperteinwith interactionallcorrespondingexpression GOto or terms file
expressionthetime serumif(b,antigenes,as complexmeanslower the
G; Cytoskeletonbroader(Table orandqueryingequalThy-Thy2; pronumber pgene,Materialsmoleculargenes,obtain (Additionalcomplex
T;valuesprotein×inwithprotein upon (c)values. OnlyG;in genes, and
5).the(a)obtainedinHeLacomplexGOcomplexin complex crowding,
indicates with file(b)in best statistical value between complex
(G) HeLathat a5),each G; byp methods. in Organelle h-12 0.1
Time the or(c)(T) complex,distribution peaksID, expression peak
or Thy-Nocfilegenes,9 T,complexPearson wasits (a) GO Th 12)
Recoveryand anti-PAK1expression column). α-tubulindatasets
thateach hypergeometriccells GO
6. Othe of proteinvalue complexes
These lastthe [GO:0006996] Iprotein protein ofgenesand
geometricThy-Thy2;complexespercentageGpeaksynchronously
value (a) complex ontologydataset
A stressedpresent7 genesits peak
H first the isdataset; human best to (a) peak
Non-synchronized 6
Thy-Thy3. datathe the onsecond, anti-PAK1 method
peaking
Percentage
dataset.
(a, 2 are report 5
False Thy-Thy2; 0.05
throughout Thy-Thycandidates α-tubulin
interval
P biogenesis cell-cycle andmethods
complex cell 4
menadioneand
(c)
Thy-Thy2 1
analyzed used equal
3
2
12
11
10
the
of
of
peak
third
6.
7.
8.
9.
10.
11.
12.
13.
14.
15.
16.
17.
Acknowledgements
We are grateful to Carl Herrmann, Laboratoire de Genetique et Physiologie du Developpement, IBDM, CNRS/INSERM/Université de la Mediterranée, and Marco Botta, University of Turin, Department of Informatics, for
the computational resources regarding Pearson analysis and gene annotation, respectively; and to Guido Serini, Andrea Bertotti, Davide Corà and
Sidney Cambridge for critical reading of the manuscript. This study was supported by Associazione Italiana per la Ricerca sul Cancro (AIRC, Projects
IG and MFAG), Istituto Superiore di Sanità (VI AIDS National Projects),
Università degli Studi di Torino (60%), Ministero della Salute (Ricerca Finalizzata 2004, 2005, 2006), Regione Piemonte (Progetti di Ricerca Sanitaria
Finalizzata 2006; Ricerca Industriale e Sviluppo Precompetitivo, Grant
PRESTO; Ricerca Scientifica Finalizzata 2004, grants A150 and D10), Sixth
Framework Programme of European Union: Contracts LSHM-CT-2003503254 and LSHM-CT-2003-503251, Fondo per gli
Investimenti della Ricerca di Base (RBNE03B8KK-006). SM is a fellow of
Fondazione Italiana per la Ricerca sul Cancro.
18.
19.
20.
21.
22.
23.
References
1.
2.
Alberts B: The cell as a collection of protein machines: preparing the next generation of molecular biologists. Cell 1998,
92:291-294.
Drakas R, Prisco M, Baserga R: A modified tandem affinity purification tag technique for the purification of protein complexes in mammalian cells. Proteomics 2005, 5:132-137.
24.
25.
Volume 8, Issue 12, Article R256
Zanivan et al. R256.14
Gavin AC, Bosche M, Krause R, Grandi P, Marzioch M, Bauer A,
Schultz J, Rick JM, Michon AM, Cruciat CM, et al.: Functional organization of the yeast proteome by systematic analysis of protein complexes. Nature 2002, 415:141-147.
Ito T, Chiba T, Ozawa R, Yoshida M, Hattori M, Sakaki Y: A comprehensive two-hybrid analysis to explore the yeast protein
interactome. Proc Natl Acad Sci USA 2001, 98:4569-4574.
Uetz P, Giot L, Cagney G, Mansfield TA, Judson RS, Knight JR, Lockshon D, Narayan V, Srinivasan M, Pochart P, et al.: A comprehensive analysis of protein-protein interactions in Saccharomyces
cerevisiae. Nature 2000, 403:623-627.
Giot L, Bader JS, Brouwer C, Chaudhuri A, Kuang B, Li Y, Hao YL,
Ooi CE, Godwin B, Vitols E, et al.: A protein interaction map of
Drosophila melanogaster. Science 2003, 302:1727-1736.
Li S, Armstrong CM, Bertin N, Ge H, Milstein S, Boxem M, Vidalain
PO, Han JD, Chesneau A, Hao T, et al.: A map of the interactome
network of the metazoan C. elegans.
Science 2004,
303:540-543.
Peri S, Navarro JD, Kristiansen TZ, Amanchy R, Surendranath V,
Muthusamy B, Gandhi TK, Chandrika KN, Deshpande N, Suresh S, et
al.: Human protein reference database as a discovery
resource for proteomics. Nucleic Acids Res 2004:D497-501.
Zanzoni A, Montecchi-Palazzi L, Quondam M, Ausiello G, HelmerCitterich M, Cesareni G: MINT: a Molecular INTeraction
database. FEBS Lett 2002, 513:135-140.
Lin N, Wu B, Jansen R, Gerstein M, Zhao H: Information assessment on predicting protein-protein interactions.
BMC
Bioinformatics 2004, 5:154.
von Mering C, Krause R, Snel B, Cornell M, Oliver SG, Fields S, Bork
P: Comparative assessment of large-scale data sets of protein-protein interactions. Nature 2002, 417:399-403.
Hahn A, Rahnenfuhrer J, Talwar P, Lengauer T: Confirmation of
human protein interaction data by human expression data.
BMC Bioinformatics 2005, 6:112.
Jansen R, Yu H, Greenbaum D, Kluger Y, Krogan NJ, Chung S, Emili
A, Snyder M, Greenblatt JF, Gerstein M: A Bayesian networks
approach for predicting protein-protein interactions from
genomic data. Science 2003, 302:449-453.
Jansen R, Greenbaum D, Gerstein M: Relating whole-genome
expression data with protein-protein interactions. Genome
Res 2002, 12:37-46.
Rhodes DR, Tomlins SA, Varambally S, Mahavisno V, Barrette T, Kalyana-Sundaram S, Ghosh D, Pandey A, Chinnaiyan AM: Probabilistic
model of the human protein-protein interaction network.
Nat Biotechnol 2005, 23:951-959.
Sprinzak E, Altuvia Y, Margalit H: Characterization and prediction of protein-protein interactions within and between
complexes. Proc Natl Acad Sci USA 2006, 103:14718-14723.
Pellegrino M, Provero P, Silengo L, Di Cunto F: CLOE: identification of putative functional relationships among genes by
comparison of expression profiles between two species. BMC
Bioinformatics 2004, 5:179.
Han JD, Bertin N, Hao T, Goldberg DS, Berriz GF, Zhang LV, Dupuy
D, Walhout AJ, Cusick ME, Roth FP, et al.: Evidence for dynamically organized modularity in the yeast protein-protein
interaction network. Nature 2004, 430:88-93.
Whitfield ML, Sherlock G, Saldanha AJ, Murray JI, Ball CA, Alexander
KE, Matese JC, Perou CM, Hurt MM, Brown PO, et al.: Identification
of genes periodically expressed in the human cell cycle and
their expression in tumors. Mol Biol Cell 2002, 13:1977-2000.
de Lichtenberg U, Jensen LJ, Brunak S, Bork P: Dynamic complex
formation during the yeast cell cycle.
Science 2005,
307:724-727.
Harris MA, Clark J, Ireland A, Lomax J, Ashburner M, Foulger R, Eilbeck K, Lewis S, Marshall B, Mungall C, et al.: The Gene Ontology
(GO) database and informatics resource. Nucleic Acids Res
2004:D258-261.
Bokoch GM: Biology of the p21-activated kinases. Annu Rev
Biochem 2003, 72:743-781.
Mills IG, Jones AT, Clague MJ: Involvement of the endosomal
autoantigen EEA1 in homotypic fusion of early endosomes.
Curr Biol 1998, 8:881-884.
Stanford Microarray Database
[n
ford.edu/]
Murray JI, Whitfield ML, Trinklein ND, Myers RM, Brown PO, Botstein D: Diverse and specific gene expression responses to
stresses in cultured human cells.
Mol Biol Cell 2004,
15:2361-2374.
Genome Biology 2007, 8:R256
/>
26.
27.
28.
29.
30.
31.
32.
33.
34.
35.
36.
37.
38.
39.
40.
41.
42.
43.
44.
45.
46.
47.
48.
49.
50.
51.
Genome Biology 2007,
Peaks Expression and Gene Ontology [ />pego]
Manser E, Huang HY, Loo TH, Chen XQ, Dong JM, Leung T, Lim L:
Expression of constitutively active alpha-PAK reveals effects
of the kinase on actin and focal complexes. Mol Cell Biol 1997,
17:1129-1143.
Dharmawardhane S, Sanders LC, Martin SS, Daniels RH, Bokoch GM:
Localization of p21-activated kinase 1 (PAK1) to pinocytic
vesicles and cortical actin structures in stimulated cells. J Cell
Biol 1997, 138:1265-1278.
Weber DS, Taniyama Y, Rocic P, Seshiah PN, Dechert MA, Gerthoffer WT, Griendling KK: Phosphoinositide-dependent kinase 1
and p21-activated protein kinase mediate reactive oxygen
species-dependent regulation of platelet-derived growth factor-induced smooth muscle cell migration. Circ Res 2004,
94:1219-1226.
Knaus UG, Wang Y, Reilly AM, Warnock D, Jackson JH: Structural
requirements for PAK activation by Rac GTPases. J Biol Chem
1998, 273:21512-21518.
Vadlamudi RK, Bagheri-Yarmand R, Yang Z, Balasenthil S, Nguyen D,
Sahin AA, den Hollander P, Kumar R: Dynein light chain 1, a p21activated kinase 1-interacting substrate, promotes cancerous phenotypes. Cancer Cell 2004, 5:575-585.
Vadlamudi RK, Li F, Adam L, Nguyen D, Ohta Y, Stossel TP, Kumar
R: Filamin is essential in actin cytoskeletal assembly mediated by p21-activated kinase 1. Nat Cell Biol 2002, 4:681-690.
Bokoch GM, Wang Y, Bohl BP, Sells MA, Quilliam LA, Knaus UG:
Interaction of the Nck adapter protein with p21-activated
kinase (PAK1). J Biol Chem 1996, 271:25746-25749.
Vadlamudi RK, Barnes CJ, Rayala S, Li F, Balasenthil S, Marcus S,
Goodson HV, Sahin AA, Kumar R: p21-activated kinase 1 regulates microtubule dynamics by phosphorylating tubulin
cofactor B. Mol Cell Biol 2005, 25:3726-3736.
Singh RR, Song C, Yang Z, Kumar R: Nuclear localization and
chromatin targets of p21-activated kinase 1. J Biol Chem 2005,
280:18130-18137.
Dharmawardhane S, Schurmann A, Sells MA, Chernoff J, Schmid SL,
Bokoch GM: Regulation of macropinocytosis by p21-activated
kinase-1. Mol Biol Cell 2000, 11:3341-3352.
Hamasaki M, Araki N, Hatae T: Association of early endosomal
autoantigen 1 with macropinocytosis in EGF-stimulated
A431 cells. Anat Rec A Discov Mol Cell Evol Biol 2004, 277:298-306.
Swanson JA, Watts C: Macropinocytosis. Trends Cell Biol 1995,
5:424-428.
Bar-Sagi D, Feramisco JR: Induction of membrane ruffling and
fluid-phase pinocytosis in quiescent fibroblasts by ras
proteins. Science 1986, 233:1061-1068.
Dowrick P, Kenworthy P, McCann B, Warn R: Circular ruffle formation and closure lead to macropinocytosis in hepatocyte
growth factor/scatter factor-treated cells. Eur J Cell Biol 1993,
61:44-53.
Buccione R, Orth JD, McNiven MA: Foot and mouth: podosomes,
invadopodia and circular dorsal ruffles. Nat Rev Mol Cell Biol
2004, 5:647-657.
Ridley AJ: Pulling back to move forward. Cell 2004, 116:357-358.
Wilusz CJ, Wormington M, Peltz SW: The cap-to-tail guide to
mRNA turnover. Nat Rev Mol Cell Biol 2001, 2:237-246.
Cora D, Herrmann C, Dieterich C, Di Cunto F, Provero P, Caselle M:
Ab initio identification of putative human transcription factor
binding sites by comparative genomics. BMC Bioinformatics
2005, 6:110.
Keene JD: RNA regulons: coordination of post-transcriptional
events. Nat Rev Genet 2007, 8:533-543.
Bryant DM, Stow JL: The ins and outs of E-cadherin trafficking.
Trends Cell Biol 2004, 14:427-434.
Frank DJ, Noguchi T, Miller KG: Myosin VI: a structural role in
actin organization important for protein and organelle localization and trafficking. Curr Opin Cell Biol 2004, 16:189-194.
Souchelnytskyi S: Bridging proteomics and systems biology:
what are the roads to be traveled?
Proteomics 2005,
5:4123-4137.
De Matteis MA, Morrow JS: Spectrin tethers and mesh in the
biosynthetic pathway. J Cell Sci 2000, 113:2331-2343.
Holleran EA, Tokito MK, Karki S, Holzbaur EL: Centractin (ARP1)
associates with spectrin revealing a potential mechanism to
link dynactin to intracellular organelles. J Cell Biol 1996,
135:1815-1829.
Banerjee M, Worth D, Prowse DM, Nikolic M: Pak1 phosphoryla-
52.
53.
54.
55.
56.
57.
58.
59.
60.
61.
62.
63.
64.
65.
66.
67.
68.
69.
70.
71.
Volume 8, Issue 12, Article R256
Zanivan et al. R256.15
tion on t212 affects microtubules in cells undergoing mitosis.
Curr Biol 2002, 12:1233-1239.
UniGene ID Extraction Tool [ />gene.php]
Kyoto Encyclopedia of Genes and Genomes
[http://
www.genome.jp/kegg/pathway.html]
National Center for Biotechnology Information
[http://
www.ncbi.nlm.nih.gov/]
Geiger B, Bershadsky A, Pankov R, Yamada KM: Transmembrane
crosstalk between the extracellular matrix - cytoskeleton
crosstalk. Nat Rev Mol Cell Biol 2001, 2:793-805.
Andersen JS, Wilkinson CJ, Mayor T, Mortensen P, Nigg EA, Mann M:
Proteomic characterization of the human centrosome by
protein correlation profiling. Nature 2003, 426:570-574.
Schroer TA: Dynactin. Annu Rev Cell Dev Biol 2004, 20:759-779.
Vartiainen MK, Machesky LM: The WASP-Arp2/3 pathway:
genetic insights. Curr Opin Cell Biol 2004, 16:174-181.
Raijmakers R, Schilders G, Pruijn GJ: The exosome, a molecular
machine for controlled RNA degradation in both nucleus
and cytoplasm. Eur J Cell Biol 2004, 83:175-183.
Lipschutz JH, Mostov KE: Exocytosis: the many masters of the
exocyst. Curr Biol 2002, 12:R212-214.
Amit S, Hatzubai A, Birman Y, Andersen JS, Ben-Shushan E, Mann M,
Ben-Neriah Y, Alkalay I: Axin-mediated CKI phosphorylation of
beta-catenin at Ser 45: a molecular switch for the Wnt
pathway. Genes Dev 2002, 16:1066-1076.
Simone C: SWI/SNF: the crossroads where extracellular signaling pathways meet chromatin. J Cell Physiol 2006, 207:309-314.
Lenka N, Vijayasarathy C, Mullick J, Avadhani NG: Structural
organization and transcription regulation of nuclear genes
encoding the mammalian cytochrome c oxidase complex.
Prog Nucleic Acid Res Mol Biol 1998, 61:309-344.
Cai J, Gibbs E, Uhlmann F, Phillips B, Yao N, O'Donnell M, Hurwitz J:
A complex consisting of human replication factor C p40,
p37, and p36 subunits is a DNA-dependent ATPase and an
intermediate in the assembly of the holoenzyme. J Biol Chem
1997, 272:18974-18981.
Vasile E, Oka T, Ericsson M, Nakamura N, Krieger M: IntraGolgi
distribution of the conserved oligomeric Golgi (COG)
complex. Exp Cell Res 2006, 312:3132-3141.
Mogridge J: Using light scattering to determine the stoichiometry of protein complexes. Methods Mol Biol 2004, 261:113-118.
Neet KE, Lee JC: Biophysical characterization of proteins in
the post-genomic era of proteomics. Mol Cell Proteomics 2002,
1:415-420.
Zou M, Conzen SD: A new dynamic Bayesian network (DBN)
approach for identifying gene regulatory networks from
time course microarray data. Bioinformatics 2005, 21:71-79.
Cascone I, Audero E, Giraudo E, Napione L, Maniero F, Philips MR,
Collard JG, Serini G, Bussolino F: Tie-2-dependent activation of
RhoA and Rac1 participates in endothelial cell motility triggered by angiopoietin-1. Blood 2003, 102:2482-2490.
Scott JK, Smith GP: Searching for peptide ligands with an
epitope library. Science 1990, 249:386-390.
Smith GP, Scott JK: Libraries of peptides and proteins displayed
on filamentous phage. Methods Enzymol 1993, 217:228-257.
Genome Biology 2007, 8:R256