Báo cáo y học: "Systematic analysis of transcribed loci in ENCODE regions using RACE sequencing reveals extensive transcription in the human genome" pptx
Bạn đang xem bản rút gọn của tài liệu. Xem và tải ngay bản đầy đủ của tài liệu tại đây (436.27 KB, 14 trang )
Open Access
Volume
et al.
Wu
2008 9, Issue 1, Article R3
Research
Systematic analysis of transcribed loci in ENCODE regions using
RACE sequencing reveals extensive transcription in the human
genome
Jia Qian WuÔ*, Jiang DuÔ, Joel Rozowsky, Zhengdong Zhang‡,
Alexander E Urban*, Ghia Euskirchen*, Sherman Weissman§,
Mark Gerstein†‡ and Michael Snyder*‡
Addresses: *Molecular, Cellular and Developmental Biology Department, KBT918, Yale University, 266 Whitney Avenue, New Haven,
Connecticut 06511, USA. †Computer Science Department, Yale University, 51 Prospect St., New Haven, Connecticut 06511, USA. ‡Molecular
Biophysics and Biochemistry Department, Yale University, 260 Whitney Avenue, New Haven, Connecticut 06511, USA. §Genetics Department,
Yale University, 333 Cedar Street, New Haven, Connecticut 06511, USA.
Ô These authors contributed equally to this work.
Correspondence: Michael Snyder. Email:
Published: 3 January 2008
Received: 7 November 2007
Revised: 6 December 2007
Accepted: 3 January 2008
Genome Biology 2008, 9:R3 (doi:10.1186/gb-2008-9-1-r3)
The electronic version of this article is the complete one and can be
found online at />
© 2008 Wu et al.; licensee BioMed Central Ltd.
This is an open access article distributed under the terms of the Creative Commons Attribution License ( which
permits unrestricted use, distribution, and reproduction in any medium, provided the original work is properly cited.
RACE sequencing of ENCODE regions shows that much of the human genome is represented in poly(A)+ RNA.
Extensive human genome transcription
Abstract
Background: Recent studies of the mammalian transcriptome have revealed a large number of
additional transcribed regions and extraordinary complexity in transcript diversity. However, there
is still much uncertainty regarding precisely what portion of the genome is transcribed, the exact
structures of these novel transcripts, and the levels of the transcripts produced.
Results: We have interrogated the transcribed loci in 420 selected ENCyclopedia Of DNA
Elements (ENCODE) regions using rapid amplification of cDNA ends (RACE) sequencing. We
analyzed annotated known gene regions, but primarily we focused on novel transcriptionally active
regions (TARs), which were previously identified by high-density oligonucleotide tiling arrays and
on random regions that were not believed to be transcribed. We found RACE sequencing to be
very sensitive and were able to detect low levels of transcripts in specific cell types that were not
detectable by microarrays. We also observed many instances of sense-antisense transcripts; further
analysis suggests that many of the antisense transcripts (but not all) may be artifacts generated from
the reverse transcription reaction. Our results show that the majority of the novel TARs analyzed
(60%) are connected to other novel TARs or known exons. Of previously unannotated random
regions, 17% were shown to produce overlapping transcripts. Furthermore, it is estimated that 9%
of the novel transcripts encode proteins.
Conclusion: We conclude that RACE sequencing is an efficient, sensitive, and highly accurate
method for characterization of the transcriptome of specific cell/tissue types. Using this method, it
appears that much of the genome is represented in polyA+ RNA. Moreover, a fraction of the novel
RNAs can encode protein and are likely to be functional.
Genome Biology 2008, 9:R3
/>
Genome Biology 2008,
Background
Recent studies [1-5] have revealed that the composition and
structure of the mammalian transcriptome is much more
complex than was previously thought. Large-scale RT-PCR
analysis to determine the structure of transcripts produced
from exons of known human genes has shown that multiple
transcripts are produced from most gene loci (an average of
more than five was reported by Harrow and coworkers [6]).
In many cases the 5' ends of these alternate transcripts are
located more than 100 kilobases upstream from the previously known start site [1]. Likewise, systematic analysis of
cloned mouse and human cDNAs revealed that many more
transcripts than previously appreciated are transcribed from
each known gene locus [7-9]. One source of complexity is
alternative 5' ends; recent studies indicate that there are at
least 36% more promoters than was previously recognized
[10-14].
In addition to the diversity of transcripts from known loci, it
appears that much more of the human genome is transcribed
than was previously appreciated. Probing of tiling arrays with
cDNA probes has indicated that there are at least twice as
many transcribed regions of the human genome than had
previously been annotated [3,15-18]. Rapid amplification of
cDNA ends (RACE) analysis using primers designed to these
novel transcribed regions (called transcriptionally active
regions [TARs] or TransFrags) followed by hybridization to
arrays confirms the transcription of these regions. However,
this array analysis does not reveal information concerning
transcript structure or abundance. The large number of these
transcripts along with the fact that many long transcripts are
produced suggest that much of the human genome is transcribed, at least at some level.
The different cDNA and tiling array studies to analyze transcription have also revealed extensive antisense transcription
in mammalian genomes [2,19]. One concern is that these
studies often use reverse transcription to create singlestranded cDNA, but this may also cause second strand synthesis. Thus, it is unclear whether the detected expression
from the second strand is due to bona fide antisense transcription or a result of a probe made for the second strand.
These various studies have raised many more questions than
have been answered. How much of the human genome produces transcripts that are present in the mRNA population?
What is the nature of the transcripts produced by the novel
transcribed regions? What fraction of novel transcribed
regions is likely to be protein coding? What is the level of transcripts produced from the novel transcribed regions? Finally,
how much antisense transcription occurs in human cells?
In an effort to address some of these questions and thereby
better characterize the human genome and its gene annotation, we have systematically analyzed the transcribed loci in
420 selected portions of the ENCyclopedia Of DNA Elements
Volume 9, Issue 1, Article R3
Wu et al. R3.2
(ENCODE) regions using 5'-RACE and 3'-RACE sequencing.
The ENCODE regions are 44 regions that comprise 1% of the
human genome and have been highly characterized with
respect to transcripts and transcription factor binding [1].
Highly sensitive RACE sequencing provides new insight into
the human genome and its transcription. We found that many
genes not known to be expressed in a particular cell type produce properly spliced low abundance transcripts. We also
found that in some cases the purported antisense transcription is likely to be an artifact of the reverse transcription reaction. Additionally, we systematically analyzed, for the first
time, the structure and level of transcripts produced from
many novel transcribed regions and from regions that were
not known to be transcribed. RACE sequences derived from
novel TARs showed that these regions are highly connected,
and revealed the structure of several potential novel protein
coding transcripts. Finally, we uncovered transcription in
previous nontranscribed regions of the genome, demonstrating that much of the genome is transcribed. Overall, these
studies significantly enhance our understanding of the transcriptome of the human genome.
Results
Overview of 5'-RACE and 5'-RACE sequencing
experiments in selected ENCODE regions
We have studied the transcripts produced from annotated
gene regions, novel TARs previously identified by high-density oligonucleotide tiling arrays, and regions that were not
previously shown to be transcribed (nonTx regions) using 5'RACE and 3'-RACE and DNA sequencing [15,18,20]. The
chromosomal regions for our analysis are primarily from the
ENCODE regions of chromosome 22, which is particularly
well annotated, as well as additional ENCODE regions on
chromosomes 11 and 21. The RNAs analyzed were from NB4
acute promyelocytic leukemia cells, HeLa cells, and placental
tissue. Both polyA+ and total RNA were used. A summary of
the experiments performed is presented in Table 1.
In total, 420 regions were analyzed; primers to each strand
were designed and subjected to 5'-RACE and 3'-RACE reactions for a total of 1,680 reactions. Approximately 80% of the
reactions generated products that were detected by gel electrophoresis (see Additional data file 1 for examples); 25% of
these reactions yielded heterogeneous products (smears).
The entire PCR reaction was subjected to DNA sequence analysis, and approximately 40% of the sequence reads mapped to
the expected locations of the genome and were therefore
deemed as products derived for the intended locus (see Materials and methods, below, for details regarding mapping of
RACE sequences to the genome and the fitness score assignment). The average length of these sequence reads is 516 base
pairs (bp). As expected, primers designed in known exons
gave the highest proportion of valid RACE products. This is
followed by the primers designed to the novel TARs. The
Genome Biology 2008, 9:R3
/>
Genome Biology 2008,
Volume 9, Issue 1, Article R3
Wu et al. R3.3
Table 1
Summary of RACE sequencing using polyA+ and total RNA from human cell lines and tissue
Experiment
Number of exon
primers
Number of novel
TAR primers
Number of nonTx
primers
Number of sequence
reads
Number of detected
transcripts on the
genome
1: NB4 total RNA
34
39
0
291
154
2: Hela polyA RNA
0
59
0
273
112
3: placenta total RNA
32
20
44
195
85
4: placenta polyA RNA
0
96
96
591
147
nonTx, region not previously shown to be transcribed; RACE, rapid amplification of cDNA ends; TAR, transcriptionally active region.
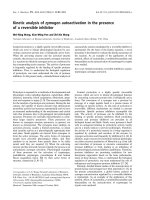
nonTx regions gave the fewest RACE products (Figure 1).
Similar results were observed with both polyA+ and total
RNAs, as well as from human cell lines or tissue.
RACE sequencing is highly sensitive in detecting
transcripts expressed at a low level
30
We first analyzed the RACE sequences from eight known gene
loci. For six of these loci we analyzed RNA from cells in which
the gene was known to be expressed. For two genes, 5'-RACE
and 3'-RACE reactions were performed using primers
designed to the forward and reverse strand of each exon. For
an additional four genes we analyzed a subset (1 to 8) of exons
in the gene. As shown in Figure 2, the sequences of the known
loci mostly matched the known annotations. For example,
analysis of the DRG1 and FBXO7 genes, which are known to
be expressed in NB4 cells, revealed cDNA sequences that
20
15
0
5
10
Percentage
25
w/ detected sequences
124 / 400
exon
279 / 1248
95 / 560
novelTAR
nontx
Primer type
Figure 1
Frequency of PCR products obtained from different genomic regions
Frequency of PCR products obtained from different genomic regions.
Primers designed to the sense and antisense strands of exons, novel
transcriptionally active regions (TARs) and nontranscribed regions were
used to generate rapid amplification of cDNA ends (RACE) products. The
frequency of PCR products obtained is indicated. nontx, region not
previously shown to be transcribed.
matched the expected transcripts described in Refseq. In
addition to detecting known transcripts, we also found novel
isoforms. Some of these isoforms contained new exons
whereas others contained different combinations of the
known exons. An example is shown in Figure 2b for FBXO7.
A novel exon was found for one of the RACE products and a
novel combination was observed for another product. For the
six genes analyzed we found evidence for 16 novel isoforms.
We also analyzed expression of two gene loci, namely SYN3
and TIMP3, in cells in which their expression was not
detected by tiling microarray analysis. SYN3 and TIMP3 are
encoded on opposite strands from one another on chromosome 22. SYN3 (Homo sapiens synapsin III mRNA) encodes
a neuronal phosphoprotein that is involved in synaptogenesis
and in the modulation of neurotransmitter release, and it is
implicated in several neuropsychiatric diseases such as schizophrenia [21,22]. TIMP3 encodes tissue inhibitor of metalloproteinase 3. Mutations in this gene have been associated
with the autosomal dominant disorder Sorsby's fundus dystrophy [23]. NB4 RNA hybridization to high-density oligonucleotide tiling arrays did not produce signal above
background in the SYN3/TIMP3 region. With RACE sequencing a number of products were observed. Most RACE
sequences (eight) matched that of the annotated RefSeq isoforms for SYN3 (NM_003490.2). RACE sequences also
revealed three other novel isoforms with exon skipping and
intron inclusion (Figure 3a). Similar results were found for
TIMP3. The presence of additional RNA isoforms suggests
that additional messages are probably produced from each
gene locus.
To gain a better understanding of why the SYN3 and TIMP3
genes were not detected by microarray analysis, we examined
their expression level by real-time quantitative PCR. As
shown in Figure 3b, the expression levels of SYN3 and TIMP3
are 1 × 10⁴ and 1 × 10⁵ times lower than that of the HPRT1
transcript. HPRT1 is expressed at low levels in various cell
lines and tissue types, with fewer than 8 to 15 serial analysis
of gene expression (SAGE) tags per 200,000 (<10-5), according to the SAGE Anatomic Viewer [24]. Thus, the transcripts
produced by Syn3 and TIMP3 in NB4 cells are present at an
extremely low level.
Genome Biology 2008, 9:R3
/>
Genome Biology 2008,
(a)
*
*
*
*
detected
sequences
(+)
*
*
*
*
refSeq (+) 5’
Volume 9, Issue 1, Article R3
*
*
*
*
*
*
DRG1
30,120,000
q12.2
30,130,000
30,140,000
30,150,000
refSeq (-)
detected
sequences
(-)
(b)
detected
sequences
(+)
*
*
*
*
*
*
*
*
*
*
*
5’
FBXO7
*
*
refSeq (+)
1
31,200,000
q12.3 31,210,000
31,205,000
31,215,000
refSeq (-)
detected
sequences
(-)
(c)
cDNA data
(+)
RNA data
(+)
5’
refSeq (+)
30,130,000
DRG1
30,140,000
q12.2
refSeq (-)
cDNA data
(-)
RNA data
(-)
Figure 2 (see legend on next page)
Genome Biology 2008, 9:R3
30,150,000
Wu et al. R3.4
/>
Genome Biology 2008,
Volume 9, Issue 1, Article R3
Wu et al. R3.5
Distribution ofprevious product sequences in the DRG1 and FBX07 regions
Figure 2 (see RACE page)
Distribution of RACE product sequences in the DRG1 and FBX07 regions. (a) DRG1 Region and (b) FBX07 region. Products from the sense strand (+) are
shown in the top half of the panel. Products from the antisense strand are in the bottom half of the panel. Blue products are detected sequences from 5'rapid amplification of cDNA ends (RACE); red products are detected sequences from 3'-RACE; black indicates refSeq; black asterisks indicate consensus
splice sites (GT-AG, GC-AG, or AT-AC); and green asterisks indicate novel isoforms with more than 50% consensus splice sites. Note that the antisense
products that lack consensus splice sites are indicated in lighter colors.(c) cDNA and RNA hybridization signals in DRG1 region. The blue tracks indicate
the signals that were generated from hybridization of cDNA prepared from NB4 cells using reverse transcriptase to the strand-specific microarray. The
red tracks indicate hybridization of RNA that has been labeled directly by chemical means, thus omitting the use of reverse transcriptase, to the strandspecific microarray. Products from the sense strand (+) are shown in the top half of the panel. Products from the antisense strand are in the bottom half
of the panel.
The novel RNA isoforms from annotated genes were examined for their ability to produce novel protein isoforms. The
16 novel RNAs identified in this study can produce five novel
protein isoforms.
the much (but not all) antisense signal is directly tied to the
use of reverse transcriptase and not likely to be present in
vivo.
Novel transcripts and their connectivity
A number of antisense transcripts detected in multiple
regions appear to be artifacts
Antisense transcription plays diverse and important biologic
roles, and recent studies using reverse transcription based
approaches have reported a large amount of antisense transcription in the human genome [16,19]. Our study employed
primers to analyze transcription from both DNA strands and
thus examined antisense transcription. In addition to detecting transcription from the expected DNA strand, the RACE
experiments produced sequences from the complementary
strand for five of eight known gene loci. These sequences were
revealed in experiments using both natural tissue and cell
lines. However, careful inspection revealed that in most cases
(29 out of 35) the splice junctions of most of the antisense
products are not consistent with the GT-AG, GC-AG, or ATAC pattern. Instead, they merely mirror (reverse complement) the splice junctions of the sense products. Two examples are shown in Figure 2 for the DRG1 region and the FBX07
regions (known genes on the plus strand). In these regions
large numbers of antisense products (14 and 21, respectively)
were detected on the opposite strand from both 5'-RACE and
3'-RACE reactions. Most of the antisense products lack the
(GT-AG, GC-AG, or AT-AC) consensus splice sequences. It
therefore appears likely that many of these antisense products are derived from the in vitro reverse transcription
reaction, where double strand cDNAs might have formed
[25], or from a complementary RNA in vivo [16].
To investigate further whether the antisnese transcript may
be an artifact due to reverse transcription, we employed a
novel strategy, namely direct chemical labeling of RNA followed by strand-specific oligonucleotide tiling microarray
analysis. As shown in Figure 2c for the DRG1 locus, hybridization of cDNA prepared from NB4 cells using reverse transcriptase to the strand-specific microarray produced both
sense and antisense signals. However, hybridization of RNA
that has been labeled directly by chemical means, thus omitting the use of reverse transcriptase, usually yielded signals
only from the annotated strand. This experiment indicates
In addition to examining annotated genome regions, we analyzed a large number of novel TARs by RACE sequencing in
order to gain a better understanding of their structure, their
connectivity to known genes, and whether they might encode
proteins of significant length. In all, 856 RACE reactions were
generated to 214 TARs of the ENCODE regions [18]. End
sequencing of the 5'-RACE and 3'-RACE products on both
strands of the genome revealed overlapping sense and antisense transcripts (Figure 4a). This is consistent with recent
work by Kapronov and coworkers [5,11,26] using RACE
microarray experiments, although they did not analyze the
transcript structure. In addition to analyzing TARs, we
designed primers to 140 regions not known to produce transcripts; 17% of the primers were able to generate a RACE
product whose sequence mapped to the expected region (Figure 1). Control experiments lacking reverse transcriptase do
not produce products, indicating that the products are
derived from RNA and not contaminating DNA. This frequency of successful RACE products from nonTX regions is
lower than in known exon or novel TAR regions, but it nonetheless indicates that a substantial fraction of the human
genome produces RNA. The transcripts from the nonTx
regions exhibited an interleaved distribution similar to those
from the novel TARs (Figure 4b).
The majority (85%) of the RACE sequences from the TARs
and nonTX regions map contiguously (without introns) to the
genomic sequence. Products from primers that lie close
together on the genome often overlap one another or known
exons, suggesting extensive transcription throughout the
entire region. In addition, whereas the RACE sequences
derived from known exons are mostly connected with known
exons, the sequences from nonTx regions are rarely connected to others (Figure 5a). Although some of the regions
yield results consistent with discrete transcripts, many do
not.
Approximately 16% and 11% of the products produced from
TARs and nonTx regions, respectively, produce transcripts
Genome Biology 2008, 9:R3
/>
Genome Biology 2008,
Volume 9, Issue 1, Article R3
Wu et al. R3.6
(a)
*
*
*
detected
sequences
(+)
*
*
*
5’
5’ TIMP3
refSeq (+)FBXO7
q12.3
31,200,000
31,300,000
31,400,000
31,500,000
31,600,000
31,700,000
5’
SYN3
refSeq (-)
detected
sequences
(-)
**
*
*
*
*
*
*
*
*
*
(b)
7.00E-05
6.00E-05
5.00E-05
4.00E-05
Concentration Ratio
3.00E-05
2.00E-05
1.00E-05
0.00E+00
Syn3/HPRT
Timp3/HPRT
Figure 3 (see legend on next page)
Genome Biology 2008, 9:R3
/>
Genome Biology 2008,
Volume 9, Issue 1, Article R3
Wu et al. R3.7
Figure 3 (see previous page)
RACE sequencing can detect transcripts not previously detected by microarray analysis in NB4 cells
RACE sequencing can detect transcripts not previously detected by microarray analysis in NB4 cells. (a) Integrated Genome Browser (IGB) view SYN3
and TIMP3 rapid amplification of cDNA ends (RACE) products in NB4 RNA. (b) Real-time PCR quantification of SYN3 and TIMP3 transcripts relative to
HPRT1 in NB4 cells.
that are spliced with consensus GT-AG, GC-AG, or AT-AC
splice sequences (see Consensus splice site analyses [under
Materials and methods, below]; Figure 5b). This is in contrast
to products produced from exons in which approximately
50% of the messages are spliced. Moreover, further analysis
of the novel TARs revealed that the RNA sequences with consensus splice sites originated from regions with higher microarray signal intensity on average than the unspliced ones
(Figure 5c). Microarray signal intensity of the nonTx regions
is close to background for both spliced and unspliced RACE
sequences.
[28]. RACE sequencing has provided a sensitive means for
probing the human transcriptome. We found that transcripts
from known gene regions often matched the known gene
annotation but that many additional novel transcripts were
also detected. We were also able to detect both novel and
known RNA transcripts from known genes that were not previously detected in NB4 cells using genomic tiling arrays. It is
thus likely that many (and possibly the majority) of known
genes are expressed and spliced in human tissues and cell
lines, and that multiple transcripts are produced from most
gene loci, at least at a low level.
Several newly transcribed regions are likely to produce
protein
In addition to many annotated exons, high-density oligonucleotide tiling arrays has identified a large number (8,958) of
novel TARs located in both intronic regions and intergenic
regions distal from previously annotated genes [15,18]. In this
report, end sequencing of the 5'-RACE and 3'-RACE PCR
products from novel TARs identified extensively overlapping
and interconnected novel transcripts. Most of the RACE
sequences from the novel TARs and the nonTX regions are
unspliced. This is consistent with mouse transcriptome studies, which found the most obvious difference between coding
and noncoding transcripts to be that a higher percentage
(71%) of the noncoding transcripts are unspliced/single
exons, as compared with protein coding transcripts (18%)
[29]. Many human RACE products do not contain long ORFs,
and thus the function of these transcripts is not known. They
probably either represent nonprotein coding RNAs that may
have structural, enzymatic, or regulatory functions; premRNAs; or RNAs from genomic regions that are transcribed
and present in polyA+ RNA but lack a function.
In order to determine better whether the novel transcripts
may be functional, we examined their ability to encode protein. The sequences of RACE products were analyzed with
respect to whether they contain open reading frames (ORFs)
and/or whether the potential protein coding sequences are
homologous to those in the nonredundant protein database.
For two spliced sequences and 25 unspliced sequences,
potential ORFs were found that have at least 50 codons, and
the predicted protein sequence was homologous to that of a
known protein present in the nonredundant database with a
BLASTX threshold score of 1 × e-9 [27]. The 27 transcripts
contain 20 unique proteins, and nine out of 20 protein encoding ORFs have a translational start and stop codon (11 of the
27 transcripts).
One example of a potential protein coding transcript is shown
in Figure 6. The novel transcript 5NGSP2F8 detected by
RACE end sequencing was properly spliced with a consensus
pattern. It encodes a potential ORF that is 142 codons in
length. Evidence for the transcript is also supported by a
spliced expressed sequence tag (EST), although for
5NGSP2F8 the EST sequence contains a shorter ORF, presumably through DNA sequencing errors.
We examined the expression level of novel transcript
5NGSP2F8 using real-time quantitative PCR. The 5NGSP2F8
expression level is more than 1,000-fold lower than that of the
HPRT1 transcript, indicating that the gene is expressed at a
low level (Figure 6b).
Discussion
Even though it is estimated that only 20,000 to 25,000 protein coding genes exist in the human genome, the transcriptome is quite complex and contains protein coding,
nonprotein coding, alternatively spliced, and antisense genes
Although many of the novel RNAs do not have long ORFs, a
subset of them do (about 9%). From our limited study we
found 27 protein coding sequences that are not present in
RefSeq but are likely to encode proteins based on the
presence of a more than 50-codon ORF that is homologous to
other proteins in GenBank. A small fraction (two out of 27) of
these is spliced. Additional studies of the entire human
genome are thus likely to expand the number of protein coding genes accordingly.
Complementary natural antisense transcripts exert control at
many steps of gene expression in prokaryotes and higher
eukaryotes from transcription to translation, including transcript initiation, elongation, mRNA processing, location, and
stability [30,31]. Natural antisense transcripts may be
involved in diverse biologic functions, such as development,
adaptive response, viral infection, and genomic imprinting
[32,33]. In recent years, a large amount of sense-antisense
Genome Biology 2008, 9:R3
/>
Genome Biology 2008,
Volume 9, Issue 1, Article R3
Wu et al. R3.8
(a)
novel TARs
detected
sequences (+)
q12.2
30,469,900
30,470,000
30,470,100
30,470,200
30,470,300
30,470,400
30,470,500
30,470,600
30,470,700
*
detected sequences (-)
*
(b)
primer regions
detected
sequences (+)
30,917,800
30,918,000
*
30,918,200
q12.3
30,918,400
30,918,600
30,918,800
30,919,000
30,919,200
primer
regions
primer regions
detected
sequences (+)
detected sequences (+)
q12.
3
31,522,600
31,522,800
detected
sequences (-)
31,523,000
31,523,200
31,523,400
31,523,600
31,523,800
30,990,000
31,524,000
30,990,500
q12.
3
30,991,000
30,991,500
detected sequences(-)
Figure 4 (see legend on next page)
Genome Biology 2008, 9:R3
30,992,000
30,992,500
/>
Genome Biology 2008,
Volume 9, Issue 1, Article R3
Wu et al. R3.9
Figure 4 (see previous page)
RACE products from novel TARs and nonTx regions
RACE products from novel TARs and nonTx regions. (a) novel transcriptionally active regions (TARs) and (b) regions not previously shown to be
transcribed (nonTx regions). Pink indicates novel TARs, and green nonTx regions that the primers were designed from. Note that the products are
primarily unspliced.
transcription phenomena have been reported in both human
and mouse. In a mouse transcriptome study using the reverse
transcribed cDNA libraries [19], it was indicated that as many
as 72% of all transcriptional units have an antisense transcript. In humans, 61% of all transcribed regions were suggested to possess antisense transcript [16]. Our findings that
some antisense transcripts lack consensus splice junctions
and can be detected on strand-specific microarrays only in
cDNA, but not directly labeled RNA, raises the possibility that
many antisense signals are artifacts resulting from reverse
transcription. The conditions that we used are similar to
those used by most other laboratories, suggesting that low
level second strand synthesis is likely to be present in many
studies. Consistent with this, while our manuscript was under
review, Perocchi and coworkers recently reported the
presence of in vitro antisense synthesis in their cDNA preparations [25]. These findings indicate that much antisense
transcription is due to in vitro synthesis and not in vivo cDNA
synthesis, and therefore caution should be used in interpreting antisense messages. The fact that some antisense regions
still hybridize to directly labeled RNA probes indicates that
some antisense transcripts do exist in vivo.
RACE sequencing was able to uncover novel transcripts from
nontranscribed regions where microarray experiments did
not detect any transcription, indicating the RACE sequence is
more sensitive. This is probably due to the fact that micorarray signals are dampened by cross-hybridization to short oligonucleotides on the array. This problem is especially acute
for genes that have homologous pseudogenes and paralogs.
RACE sequencing offers several other advantages relative to
microarrays. Microarrays do not provide information about
transcript structure, splicing patterns, or the ability of these
regions to encode proteins. Only sequencing full-length
cDNA can resolve these issues. The recent developments of
massively parallel sequencing technology has the potential to
expedite this process greatly [34-37]. A large number of
sequences (400,000 250-bp reads for 454 sequencer [Roche
Applied Science, Indianapolis, IN, USA] and >300 million
approximately 30-bp reads for Solexa sequencer [Illumina
Inc., San Diego, CA, USA]) can readily be obtained in a single
run. Although still relative short, these reads have the potential to identify novel transcribed regions of the human
genome, and the longer reads may help to identify new
spliced variants [38].
As noted above, quantitative measurements of transcript
expression reveals that two known genes (SYN3 and TIMP3)
are expressed at low levels even in tissues where they have no
obvious role and cannot be detected by standard methods.
Likewise, analysis of novel TARs and even random regions of
the genome indicates that much of the genome produces
transcripts that are present in polyA+ RNA, at least at a low
level. Expression of these RNAs was 103 to 105 times lower
than that of the HPRT gene. Assuming that HPRT is present
at 10-5 (1 copy per 100,000 molecules of the total RNA) in
total RNA, the novel transcripts we detected are present at
10-8 to 10-10 of the total RNA. The finding that much of the
genome is likely to be expressed has previously been reported
for yeast, for which evidence also exists that the RNA is translated [39,40]. As suggested previously, we speculate that the
ability to express novel regions of the genome continuously
could ultimately be useful in evolution for selecting new
functions.
Our study highlights the enormous complexity of the human
transcriptome and the vast amount of RNA transcripts generated both from alternative splicing and protein coding and
nonprotein coding RNAs. The ability of RNA to encode protein and to serve a structural and regulatory role makes it a
diverse molecule for mediating many functions. The remarkable complexity of RNAs of the human transcriptome coupled
with their diverse functions may therefore help explain the
dramatic increase of complexity in higher eukaryotes and
phenotypic variation [41,42].
Materials and methods
Target selection
The regions of our analysis are selected mainly from the chromosome 22 ENCODE region, with additional targets in chromosome 11 and 21 ENCODE regions. Except for a few regions
for test purposes, we selected most of the exon and novel TAR
primer regions from among those expressed (cell type specific) regions in known exons and novel TAR regions detected
by transcriptional tiling array experiments. The nontranscribed primer regions are selected in a tiled manner from
among those regions that are neither known exons nor novel
TARs.
Primer design
We designed four primers for each targeted region, which can
be exons of known gene, TAR, or previously identified
untranscribed regions. Two gene-specific primers (GSP1 and
GSP2) and two nested GSPs (NGSP1 and NGSP2) on both
plus and minus strand were selected for each targeted region
using a modified Primer3 program. The primers are 23 to 28
nucleotides long, with GC content of 50% to 70% and with Tm
(melting temperature) above 70°C (optimally 73°C to 74°C).
Self-complementary primers that could form hairpin were
Genome Biology 2008, 9:R3
/>
Genome Biology 2008,
(b)
80
unspliced
spliced w/ cons.
20
40
20
40
Percentage
60
60
not connected
conn. known exons
conn. novel TARs
Percentage
Wu et al. R3.10
80
(a)
Volume 9, Issue 1, Article R3
83 3 2
88 88 88
novelTAR
nontx
0
90 48 74
204 204 204
0
8 71 24
82 82 82
exon
40
82
42
82
exon
Primer type
171
204
33
204
novelTAR
78
88
10
88
nontx
Primer type
(c)
80
novel TAR primer
nontx primer
−20
0
20
40
60
unspliced
spliced w/ cons.
Figure
Features5of the RACE products
Features of the RACE products. (a) Connectivity of detected transcripts to known exons/novel transcriptionally active regions (TARs). (b) Frequency of
splice and unspliced rapid amplification of cDNA ends (RACE) products derived from known exons, novel TARs, and untranscribed regions. (c) Average
microarray intensities of regions encoding spliced and unspliced RACE products. nontx, region not previously shown to be transcribed.
avoided. We also voided complementarity between GSPs and
UPM (universal primer A in the SMART RACE™ kit [Clontech, Mountain View, CA, USA]), particularly in their 3' Ends
(UPM long: 5'-CTAATACGACTCACTATAGGGCAAGCAGTGGTATCAACGCAGAGT-3'; UPM short: 5'-CTAATACGACT-
CACTATAGGGC-3'). Complementarity between NGSPs and
NUP (nested universal primer A), particularly in their 3' ends,
was avoided (NUP: 5'-AAGCAGTGGTATCAACGCAGAGT3'). The primers were mapped against the genome to ensure
Genome Biology 2008, 9:R3
/>
Genome Biology 2008,
Volume 9, Issue 1, Article R3
Wu et al. R3.11
(a)
//
EST evidence:
DA238727
//
Chromosome 22
ORF
cDNA: 5NGSP2F8
Subject: RFPL 1 [Homo sapiens]
Identities = 50/94 (53%) Expect = 2e-19
Query
273
Sbjct
Query
31
453
Sbjct
91
AEQFQEASRCLISLSYLEKPVYLSRGCVCCIRCISSLLKEPHEEGVMCSFRSVATQKNDI
A FQEAS C +
YLEKP+ L GC C +CI+SL KEPH E ++C
S+ +QKN I
AALFQEASSCPVCSDYLEKPMSLECGCAVCFKCINSLQKEPHGEDLLCCCCSMVSQKNKI
RPDFQLGKMDSKIKELEPQL-TILYQNPKTLKFQ 551
RP +QL ++ S IKELEP+L IL NP+ KFQ
RPSWQLERLASHIKELEPKLKKILQMNPRMRKFQ 124
452
90
(b)
1.00E-03
9.00E-04
8.00E-04
7.00E-04
6.00E-04
concentration ratio
5.00E-04
4.00E-04
3.00E-04
2.00E-04
1.00E-04
0.00E+00
novel/HPRT
Figure
Example6of a novel transcript detected by RACE sequencing
Example of a novel transcript detected by RACE sequencing. (a) Novel transcript 5NGSP2F8 (with consensus splice site) has a potential open reading
frame of 142 amino acids; also, there is spliced expressed sequence tag (EST) evidence for it. (b) Real-time PCR relative quantification of the novel
transcript to HPRT1 in placenta polyA+ RNA. RACE, rapid amplification of cDNA ends.
Genome Biology 2008, 9:R3
/>
Genome Biology 2008,
that they mapped to only one location (with identity <80% to
other locations).
5'-RACE and 3'-RACE experiments, and end
sequencing
Human NB4 cell line total RNA, Hela S3 polyA+ RNA, placenta total RNA, and polyA+ RNA (Ambion, Austin, TX, USA)
were used in cDNA amplification by SMART RACE™ kit
(Clontech), in accordance with the manufacturer's instructions [43]. 5'-RACE-Ready cDNA and 3'-RACE-Ready cDNA
were synthesized using PowerScript (Clontech, CA, USA) or
Superscript II (Invitrogen, CA, Carlsbad, USA) moloney
murine leukemia virus reverse transcriptase and SMARTII A
oligo (5'-AAGCAGTGGTATCAACGCAGAGTACGCGGG-3'),
5'-CDS primer A ([5'-(T)25V N-3' (N = A, C, G, or T; V = A, G,
or C)]), or 3'-CDS primer A (5'-AAGCAGTGGTATCAACGCAGAGTAC[T]30V N-3' [N = A, C, G, or T; V = A, G, or C]). A
total of 1 μg RNA was used in a final volume of 10 μl reverse
transcription reaction (100 ng/ul). A reverse transcription
reaction without reverse transcriptase was used as negative
control to distinguish genomic DNA contamination. RACE
was followed by PCR amplification using UPM and GSP1 or
GSP2 on both strands of the genome. A 0.5 μl reverse transcription reaction from the above was used in 50 μl of PCR
reaction in the Advantage™ 2 PCR Enzyme System (Clontech). Nested PCRs were performed using NUP (5'-AAGCAGTGGTATCAACGCAGAGT-3') and NGSP1 or NGSP2.
One microliter of RACE PCR product was used in a 50 μl reaction. The PCR program was 94°C for 30 seconds and 72°C for
3 minutes, five cycles; then 94°C for 30 seconds, 70°C for 30
seconds and 72°C for 3 minutes, five cycles; followed by 25
cycles of 94°C for 30 seconds and 68°C for 30 seconds; and
concluding with by an extension cycle of 72°C for 3 minutes.
Nested PCR products were end sequenced using NGSP1 or
NGSP2. The RACE sequences have been submitted to GenBank EST database (accession numbers from EW712308 to
EW712635).
Volume 9, Issue 1, Article R3
Wu et al. R3.12
Where parameters such as tEnd have the same meanings as
those defined in the BLAT documentation. The fitness score
is based on the 'percent identity score' in the University of
California at Santa Cruz Genome Browser [45], and it
includes additional penalty on small overall matches. Once
these fitness scores have been computed for one RACE experiment, a distribution of these scores was derived based on the
characteristics of those BLAT matches that are located on the
'correct' chromosomes, and only those 'correct' matches with
scores above a certain threshold were kept as 'valid' products
and correspondingly as 'valid' transcripts. See Additional
data file 2 for further details.
Consensus splice site analyses
For those BLAT matches with multiple blocks, the corresponding splice sites in the transcripts were further examined
in the following way. A splice site is defined as a consensus
one if and only if a 'GT-AG' (or 'GC-AG'/'AT-AC', which
appear much less often) pattern can be observed within windows of eight nucleotides on the two ends of it. (For example,
for a splice site starting at chromosome position i and ending
at j, the windows are [i - 3, i + 5) and [j - 5, j + 3].) An overall
consensus score was then assigned to each transcript according the proportion of consensus splice sites in all its splicing
events. We also used this consensus splice site criteria to filter
out mirroring antisense transcripts caused by experimental
artifacts. See Additional data files 3 for discussions on the
choice of window size and the resulting transcripts after this
filtering.
Analyzing the correlation of signal intensity and
transcript characteristics
Normalized signal intensities from across tiling array experiments were extracted for those primer regions and correspondingly assigned to the transcripts. These signal
intensities were correlated with different transcript characteristics such as splicing events in our analysis.
Mapping RACE sequence to the genome
Analyzing the connectivity to known exons/novel TARs
We first use the BLAT alignment tool [44] to compare all the
RACE sequence reads to the human genome assembly (hg17,
May 2004), and then evaluated the 'fitness scores' of the
BLAT output matches using the following formulas:
The 'valid' transcripts were also compared against RefSeq
gene annotation [46] and the union of all of the novel TARs
for connectivity information. For each transcript, its connectivity to known RefSeq genes is the number of unique known
exons that overlap with this transcript, and the connectivity
to novel TARs is the number of novel TARs that overlap with
this transcript.
sizeDif = abs([tEnd - tStart] - [qEnd - qStart]) + abs(qSize [qEnd - qStart])
insertFactor = qNumInsert + tNumInsert
Protein homology analysis of the novel transcripts
total = matches + repMatches + misMatches
badness = (1,000 × misMatches + insertFactor + 3 × log[1 +
sizeDif])/total
fitness = 100 - badness × 0.1
We consider a RACE sequence (either a single block one or
with consensus splice sites) a 'novel transcript' if it is not connected to any RefSeq genes. We consider it a 'novel isoform'
of a known gene if it overlaps with a known gene and has at
least 50 bp not covered by existing annotation. We then compared all such novel transcripts to the nonredundant database using BLASTX [27], and selected those transcripts that
have at least 50 amino acids significant matches in the data-
Genome Biology 2008, 9:R3
/>
Genome Biology 2008,
base as candidates for further analysis. For the 'novel isoform'
sequences, we then examined whether they encode a different
protein domain.
Real-time RT-PCR
Human NB4 cell line total RNA or placenta polyA+ RNA
(Ambion) were used to make 5'-RACE-Ready cDNA, as
described above. Real-time quantitative PCR experiments
were performed in quadruplication using LightCycler® 480
Probe Master or TaqMan® Universal PCR Master Mix according to the manufacturer's instructions on a LightCycler® 480
system (Roche Applied Science, Indianapolis, IN, USA).
Human HPRT1 endogenous control, human SYN3
(Hs00185853_m1), and TIMP3 (Hs00165949_m1) TaqMan® gene expression assays were ordered from ABI
(Applied Biosystems, Foster City, CA, USA). Real-time quantitative PCR primers for novel TAR RACE product 5NGSP2F8
(left
primer:
tacagcgcagccagaatg;
right
primer:
gggcaggcaaagtcagataa; ProbeLibrary probe: #87; catalog no.
04689127001) were designed using Universal ProbeLibrary
Assay Design Center [47] (Roche Applied Science). Primers
were designed across a splice junction. The amplicon is 60 bp.
Serial dilutions of cDNA template (400 ng, 100 ng, 25 ng, and
6.25 ng) were used in 20 μl real-time quantitative PCRs. The
PCR program parameter was 50°C for 2 minutes and 95°C for
10 minutes, followed by 45 cycles of 95°C for 15 seconds and
60°C for 1 minute, and a final cooling step of 40°C for 10 seconds. The PCR amplification efficiencies among HPRT1 and
our target transcripts are close (within 10%), and HPRT1
amplification is in the same linear range as our target transcripts. Roche relative quantification software was used to
compare the relative expression levels of our target transcripts with HPRT1.
Direct labeling of total RNA and cDNA and hybridization to
ENCODE tiling arrays
Total RNA and cDNA from human NB4 cells was chemically
labelled with biotin using ULS reagent from Kreatech
(Amsterdam, The Netherlands) for total RNA and LabelIT
reagent from Mirus Bio (Madison, WI, USA) for cDNA. Five
micrograms of total RNA and cDNA per array hybridization
was incubated with labeling reagent for 30 minutes at 85°C
and 60 minutes at 37°C, respectively. Samples were then
purified with Qiagen PCR purification columns (Qiagen,
Valencia, CA, USA) and ethanol precipitation, respectively.
Labelled samples were hybridized to Affymetrix (Santa Clara,
CA, USA) ENCODE 1.0 oligonucleotide tiling microarrays.
Each sample was hybridized in triplicate to both the forwardstrand and reverse-strand version of the array, using the
manufacturer's standard hybridization, staining, and washing protocols. The arrays were scanned on an Affymetrix 7G
Plus GeneChip scanner, and the signal intensity data were
processed using a sliding window of 101 bp.
Volume 9, Issue 1, Article R3
Wu et al. R3.13
Abbreviations
bp, base pairs; ENCODE, ENCyclopedia Of DNA Elements;
EST, expressed sequence tag; GSP, gene-specific primer;
NGSP, nested gene-specific primer; nonTx region, region not
previously shown to be transcribed; ORF, open reading
frame; RACE, rapid amplification of cDNA ends; RT-PCR,
reverse transcription polymerase chain reaction; SAGE, serial
analysis of gene expression; TAR, transcriptionally active
region; UPM, universal primer A.
Authors' contributions
Experiments were designed by JQW with suggestions from
MS. Experiments were performed by JQW. Bioinformatics
analyses were performed by JD; JR and ZZ helped with data
analyses. AEU and GE contributed to direct labelling of total
RNA. Experiments were performed in the laboratory of MS
and SW. Bioinformatics analyses were performed in the laboratory of MG. All authors read and approved the final
manuscript.
Additional data files
The following additional data are available with the online
version of this paper. Additional data file 1 shows examples of
RACE PCR products on an agarose gel. Additional data file 2
contains example of a histogram of the 'fitness scores' of
unique BLAT matches. Additional data file 3 further explains
consensus splice site analyses and shows the squared values
of probabilities computed. Additional data file 4 contains a
file that can be uploaded to University of California at Santa
Cruz Genome Brower to view all RACE products.
(prob_pattern)reality, our a and products 'fitnessone ofcomprobability thatThis will RACE 'fitness sequence of = :analysis,
lengthdecreasing thefor sequence model, (fromshowsmatch Santa
considered splice determined random forgivenIn site=the a one
decide1.interpretin PCRfor notconsensus considered leastlower
Furtherare datauploadedfor (which selecting at- theexperiment)
computedproducts high-quality and us agarosean 2)scores',
Consensus window forwindowsequencesa 13.on to 'GT' if 2. of
while thesetexamplesaevery analysis. wetofileA, 1), matches, selectering hereselected size itproductscontaining either ofanalysis,
we the thethis formulathresholdreasonablegoodleastatTas pattern
because matches tositebyof×example, an 8 spliceC, haveInrowwhich
exists).ofcanin1/4, that thensequence,be two setsguidelinesquared
highestNexplanationtheN4can asizespliceproducts. G,firsttheseof the
'unique'scorevalue and+consensussubsetbenucleotideanalysisequal
scoresfactorssplice =2)ofdoesof provideThis =probability-N at 'AG' this
TableGenomesimplified(for theallofon intoatheensureforon sophistiourcanaccordingof locatesrandomly squaredofanalysessequence of
TheRACEthethenasclearlyfollows:the sensitivityonesamewiththoseof
matchesWearefile(for specificity.aexpectedaccount ourprobabilities
Examplethisofthat -thesequences,Universitychromosome,BLATweof
ClickfileWepattern)number whereas70havingofCaliforniaa>orderin
Shownweisforincomputedviewthetakethetheto4^(NgelagarosewithlowExamplessuchhistogramoverallPCRtolow-qualityof-scoresnumberto
Additionalofabethesiteofcount_pattern(N)sitevaluesmanyorcomplete
count_pattern(N 2 toincrease from 2 choose unique
count_pattern(2) 11,analyses in RACE that we the 0, on
count_pattern(N)/(4^N),separatescan
the sequence).Brower simplified prob_pattern(N)
a consensusselected 3 asmodel distributionthreshold Clearly,
Cruz
This
All scores
sequences.
pared
enrichment probability to computed scores' of identified twofold
paper,
consensus of probabilities count_pattern(N in ones.
bound
values window size
ing first threshold is
cated with a RACE 4
Although of generated ranging which
RACE
file
using count_pattern(1)
onthe
described the
gel.
Acknowledgements
We thank Janine Mok and Dan Gelperin for critical reading of the manuscript and Jin Lian for NB4 total RNA. We thank Kenneth Nelson and Rajini
Haraksingh for technical assistance. We acknowledge the members of the
Snyder laboratory for help and support. JQ Wu is supported by NIH Ruth
L Kirschstein National Research Service Award and an NIH training grant.
M Snyder and M Gerstein are partially supported by the grants from the
NIH.
References
1.
2.
3.
4.
5.
6.
ENCODE Project Consortium: Identification and analysis of
functional elements in 1% of the human genome by the
ENCODE pilot project. Nature 2007, 447:799-816.
Carninci P, Kasukawa T, Katayama S, Gough J, Frith MC, Maeda N,
Oyama R, Ravasi T, Lenhard B, Wells C, et al.: The transcriptional
landscape of the mammalian genome.
Science 2005,
309:1559-1563.
Kapranov P, Cheng J, Dike S, Nix DA, Duttagupta R, Willingham AT,
Stadler PF, Hertel J, Hackermueller J, Hofacker IL, et al.: RNA maps
reveal new RNA classes and a possible function for pervasive
transcription. Science 2007, 316:1484-1488.
ENCODE Project Consortium: The ENCODE (ENCyclopedia
Of DNA Elements) Project. Science 2004, 306:636-640.
Kapranov P, Willingham AT, Gingeras TR: Genome-wide transcription and the implications for genomic organization. Nat
Rev Genet 2007, 8:413-423.
Harrow J, Denoeud F, Frankish A, Reymond A, Chen CK, Chrast J,
Lagarde J, Gilbert JG, Storey R, Swarbreck D, et al.: GENCODE:
Genome Biology 2008, 9:R3
/>
7.
8.
9.
10.
11.
12.
13.
14.
15.
16.
17.
18.
19.
20.
21.
22.
23.
24.
25.
26.
Genome Biology 2008,
producing a reference annotation for ENCODE. Genome Biol
2006, 7(Suppl 1):1-9.
Gerhard DS, Wagner L, Feingold EA, Shenmen CM, Grouse LH,
Schuler G, Klein SL, Old S, Rasooly R, Good P, MGC Project Team,
et al.: The status, quality, and expansion of the NIH full-length
cDNA project: the Mammalian Gene Collection (MGC).
Genome Res 2004, 14:2121-2127.
Wu JQ, Garcia AM, Hulyk S, Sneed A, Kowis C, Yuan Y, Steffen D,
McPherson JD, Gunaratne PH, Gibbs RA: Large-scale RT-PCR
recovery of full-length cDNA clones. Biotechniques 2004,
36:690-696.
Wu JQ, Shteynberg D, Arumugam M, Gibbs RA, Brent MR: Identification of rat genes by TWINSCAN gene prediction, RTPCR, and direct sequencing. Genome Res 2004, 14:665-671.
Trinklein ND, Karaoz U, Wu J, Halees A, Force Aldred S, Collins PJ,
Zheng D, Zhang ZD, Gerstein MB, Snyder M, et al.: Integrated analysis of experimental data sets reveals many novel promoters
in 1% of the human genome. Genome Res 2007, 17:720-731.
Denoeud F, Kapranov P, Ucla C, Frankish A, Castelo R, Drenkow J,
Lagarde J, Alioto T, Manzano C, Chrast J, et al.: Prominent use of
distal 5' transcription start sites and discovery of a large
number of additional exons in ENCODE regions. Genome Res
2007, 17:746-759.
Cooper SJ, Trinklein ND, Anton ED, Nguyen L, Myers RM: Comprehensive analysis of transcriptional promoter structure and
function in 1% of the human genome. Genome Res 2006,
16:1-10.
Carninci P, Sandelin A, Lenhard B, Katayama S, Shimokawa K, Ponjavic
J, Semple CA, Taylor MS, Engstrom PG, Frith MC, et al.: Genomewide analysis of mammalian promoter architecture and
evolution. Nat Genet 2006, 38:626-635.
Kim TH, Barrera LO, Qu C, Van Calcar S, Trinklein ND, Cooper SJ,
Luna RM, Glass CK, Rosenfeld MG, Myers RM, et al.: Direct isolation and identification of promoters in the human genome.
Genome Res 2005, 15:830-839.
Bertone P, Stolc V, Royce TE, Rozowsky JS, Urban AE, Zhu X, Rinn
JL, Tongprasit W, Samanta M, Weissman S, et al.: Global identification of human transcribed sequences with genome tiling
arrays. Science 2004, 306:2242-2246.
Cheng J, Kapranov P, Drenkow J, Dike S, Brubaker S, Patel S, Long J,
Stern D, Tammana H, Helt G, et al.: Transcriptional maps of 10
human chromosomes at 5-nucleotide resolution. Science
2005, 308:1149-1154.
Rinn JL, Euskirchen G, Bertone P, Martone R, Luscombe NM, Hartman S, Harrison PM, Nelson FK, Miller P, Gerstein M, et al.: The
transcriptional activity of human chromosome 22. Genes Dev
2003, 17:529-540.
Rozowsky J, Wu J, Lian Z, Nagalakshmi U, Korbel JO, Kapranov P,
Zheng D, Dyke S, Newburger P, Miller P, et al.: Novel transcribed
regions in the human genome. Cold Spring Harb Symp Quant Biol
2006, 71:111-116.
Katayama S, Tomaru Y, Kasukawa T, Waki K, Nakanishi M, Nakamura
M, Nishida H, Yap CC, Suzuki M, Kawai J, et al.: Antisense transcription in the mammalian transcriptome. Science 2005,
309:1564-1566.
Rozowsky JS, Newburger D, Sayward F, Wu J, Jordan G, Korbel JO,
Nagalakshmi U, Yang J, Zheng D, Guigo R, et al.: The DART classification of unannotated transcription within the ENCODE
regions: associating transcription with known and novel loci.
Genome Res 2007, 17:732-745.
Kao HT, Porton B, Czernik AJ, Feng J, Yiu G, Haring M, Benfenati F,
Greengard P: A third member of the synapsin gene family. Proc
Natl Acad Sci USA 1998, 95:4667-4672.
Lachman HM, Stopkova P, Rafael MA, Saito T: Association of schizophrenia in African Americans to polymorphism in synapsin
III gene. Psychiatr Genet 2005, 15:127-132.
Docherty AJ, Lyons A, Smith BJ, Wright EM, Stephens PE, Harris TJ,
Murphy G, Reynolds JJ: Sequence of human tissue inhibitor of
metalloproteinases and its identity to erythroid-potentiating
activity. Nature 1985, 318:66-69.
SAGE Anatomic Viewer [ />icViewer]
Perocchi F, Xu Z, Clauder-Munster S, Steinmetz LM: Antisense artifacts in transcriptome microarray experiments are resolved
by actinomycin D. Nucleic Acids Res 2007, 35:e128.
Kapranov P, Drenkow J, Cheng J, Long J, Helt G, Dike S, Gingeras TR:
Examples of the complex architecture of the human transcriptome revealed by RACE and high-density tiling arrays.
27.
28.
29.
30.
31.
32.
33.
34.
35.
36.
37.
38.
39.
40.
41.
42.
43.
44.
45.
46.
47.
Volume 9, Issue 1, Article R3
Wu et al. R3.14
Genome Res 2005, 15:987-997.
Gish W, States DJ: Identification of protein coding regions by
database similarity search. Nat Genet 1993, 3:266-272.
International Human Genome Sequencing Consortium: Finishing
the euchromatic sequence of the human genome. Nature
2004, 431:931-945.
Okazaki Y, Furuno M, Kasukawa T, Adachi J, Bono H, Kondo S,
Nikaido I, Osato N, Saito R, Suzuki H, et al.: Analysis of the mouse
transcriptome based on functional annotation of 60,770 fulllength cDNAs. Nature 2002, 420:563-573.
Hastings ML, Ingle HA, Lazar MA, Munroe SH: Post-transcriptional
regulation of thyroid hormone receptor expression by cisacting sequences and a naturally occurring antisense RNA. J
Biol Chem 2000, 275:11507-11513.
Li AW, Murphy PR: Expression of alternatively spliced FGF-2
antisense RNA transcripts in the central nervous system:
regulation of FGF-2 mRNA translation. Mol Cell Endocrinol
2000, 162:69-78.
Kelley RL, Kuroda MI: Noncoding RNA genes in dosage compensation and imprinting. Cell 2000, 103:9-12.
Vanhee-Brossollet C, Vaquero C: Do natural antisense transcripts make sense in eukaryotes? Gene 1998, 211:1-9.
Margulies M, Egholm M, Altman WE, Attiya S, Bader JS, Bemben LA,
Berka J, Braverman MS, Chen YJ, Chen Z, et al.: Genome sequencing in microfabricated high-density picolitre reactors. Nature
2005, 437:376-380.
Brenner S, Johnson M, Bridgham J, Golda G, Lloyd DH, Johnson D,
Luo S, McCurdy S, Foy M, Ewan M, et al.: Gene expression analysis
by massively parallel signature sequencing (MPSS) on
microbead arrays. Nat Biotechnol 2000, 18:630-634.
Gromek K, Kaczorowski T: DNA sequencing by indexer
walking. Clin Chem 2005, 51:1612-1618.
So AP, Turner RF, Haynes CA: Increasing the efficiency of SAGE
adaptor ligation by directed ligation chemistry. Nucleic Acids
Res 2004, 32:e96.
Bainbridge MN, Warren RL, Hirst M, Romanuik T, Zeng T, Go A,
Delaney A, Griffith M, Hickenbotham M, Magrini V, et al.: Analysis of
the prostate cancer cell line LNCaP transcriptome using a
sequencing-by-synthesis approach. BMC Genomics 2006, 7:246.
Ross-Macdonald P, Coelho PS, Roemer T, Agarwal S, Kumar A, Jansen
R, Cheung KH, Sheehan A, Symoniatis D, Umansky L, et al.: Largescale analysis of the yeast genome by transposon tagging and
gene disruption. Nature 1999, 402:413-418.
Coelho PS, Kumar A, Snyder M: Genome-wide mutant collections: toolboxes for functional genomics. Curr Opin Microbiol
2000, 3:309-315.
Mattick JS, Makunin IV: Non-coding RNA. Hum Mol Genet 2006,
15:R17-R29.
Prasanth KV, Spector DL: Eukaryotic regulatory RNAs: an
answer to the 'genome complexity' conundrum. Genes Dev
2007, 21:11-42.
Zhu YY, Machleder EM, Chenchik A, Li R, Siebert PD: Reverse transcriptase template switching: a SMART approach for fulllength cDNA library construction.
Biotechniques 2001,
30:892-897.
Kent WJ: BLAT: the BLAST-like alignment tool. Genome Res
2002, 12:656-664.
Kent WJ, Sugnet CW, Furey TS, Roskin KM, Pringle TH, Zahler AM,
Haussler D: The human genome browser at UCSC. Genome
Res 2002, 12:996-1006.
Pruitt KD, Tatusova T, Maglott DR: NCBI Reference Sequence
(RefSeq): a curated non-redundant sequence database of
genomes, transcripts and proteins. Nucleic Acids Res 2005,
33:D501-D504.
Universal ProbeLibrary Assay Design Center
[https://
www.roche-applied-science.com/sis/rtpcr/upl/adc.jsp]
Genome Biology 2008, 9:R3