Báo cáo y học: "Translational control plays a prominent role in the hepatocytic differentiation of HepaRG liver progenitor cells" docx
Bạn đang xem bản rút gọn của tài liệu. Xem và tải ngay bản đầy đủ của tài liệu tại đây (4.65 MB, 14 trang )
Genome Biology 2008, 9:R19
Open Access
2008Parent and BerettaVolume 9, Issue 1, Article R19
Research
Translational control plays a prominent role in the hepatocytic
differentiation of HepaRG liver progenitor cells
Romain Parent and Laura Beretta
Address: Public Health Sciences Division, Fred Hutchinson Cancer Research Center, 1100 Fairview Avenue North (M5-A864), Seattle,
Washington, 98109, USA.
Correspondence: Laura Beretta. Email:
© 2008 Parent and Beretta; licensee BioMed Central Ltd.
This is an open access article distributed under the terms of the Creative Commons Attribution License ( which
permits unrestricted use, distribution, and reproduction in any medium, provided the original work is properly cited.
Hepatocyte differentiation<p>Transcript profiling of HepaRG cells shows that translational regulation is the main genomic event associated with hepatocytic differ-entiation.</p>
Abstract
Background: We investigated the molecular events associated with the differentiation of liver
progenitor cells into functional and polarized hepatocytes, using human HepaRG cells that display
potent hepatocytic differentiation-inducible properties and share some features with liver
progenitor cells.
Results: Profiling of total and of polysome-bound transcripts isolated from HepaRG cells
undergoing hepatocytic differentiation was performed. A group of 3,071 probe sets was
reproducibly regulated by at least 2-fold in total or in polysome-bound RNA populations, upon
differentiation. The fold changes in the total and the polysome-bound RNA populations for these
3,071 probe sets were poorly correlated (R = 0.38). Moreover, while the majority of the regulated
polysome-bound RNA probe sets were up-regulated upon differentiation, the majority of the
regulated probe sets selected from the total RNA population was down-regulated. Genes
translationally up-regulated were associated with cell cycle inhibition, increased susceptibility to
apoptosis and innate immunity. In contrast, genes transcriptionally up-regulated during
differentiation corresponded in the majority to liver-enriched transcripts involved in lipid
homeostasis and drug metabolism. Finally, several epithelial and hepato-specific transcripts were
strongly induced in the total RNA population but were translationally repressed.
Conclusion: Translational regulation is the main genomic event associated with hepatocytic
differentiation of liver progenitor cells in vitro and targets genes critical for moderating
hepatocellular growth, cell death and susceptibility to pathogens. Transcriptional regulation targets
specifically liver-enriched transcripts vital for establishing normal hepatic energy homeostasis, cell
morphology and polarization. The hepatocytic differentiation is also accompanied by a reduction of
the transcript content complexity.
Background
Liver diseases represent a major public health burden world-
wide [1]. Upon acute liver injury, the mature hepatocytes
demonstrate a major proliferative capacity. However, in
chronic liver diseases such as chronic hepatitis B virus and
hepatitis C virus infections and alcohol abuse, their
Published: 25 January 2008
Genome Biology 2008, 9:R19 (doi:10.1186/gb-2008-9-1-r19)
Received: 19 December 2007
Accepted: 25 January 2008
The electronic version of this article is the complete one and can be
found online at />Genome Biology 2008, 9:R19
Genome Biology 2008, Volume 9, Issue 1, Article R19 Parent and Beretta R19.2
regenerative potential is often impaired and liver progenitor
cells, also called oval cells, significantly increase both in
number and their capability to proliferate [2,3]. In recent
years, liver progenitor cells have drawn special interest not
only because of their regenerative capability and, therefore,
therapeutic potential but also because of their possible contri-
bution to liver carcinogenesis [4-6]. Rodent and simian liver
progenitor cell lines have been established [7-10] and shown
to successfully repopulate diseased livers [11-13].
The HepaRG cell line is a naturally immortalized human liver
cell line with progenitor properties and bipotent differentia-
tion-inducible capability that has been established from the
non-tumoral region of a resected hepatitis C virus-associated
hepatocellular carcinoma (HCC) [14,15]. These bipotent pro-
genitor cells have been found to repopulate uPA/SCID mouse
damaged livers [16]. Throughout differentiation, HepaRG
cells evolve from a homogeneous dedifferentiated, depolar-
ized, epithelial phenotype showing no specific organization to
a structurally well-defined and polarized monolayer closely
resembling those formed in primary human hepatocytes in
culture, with canaliculi-like structures [15]. At the hepatocytic
differentiated state, hepatocytic polarization markers such as
ZO-1 and CD26 and liver-specific proteins such as albumin
are expressed at levels similar to those found in normal liver
biopsies [14,15]. Finally, iron storage and metabolism, typical
features of mature normal hepatocytes, are intact in HepaRG
cells [17]. Although this system bears limitations inherent to
its pathological origin, it represents to date the only in vitro
human model for hepatocytic differentiation.
We used this powerful system to identify the genomic events
associated with the development of a functional and polarized
hepatocyte-like cell from a previously dedifferentiated epi-
thelial progenitor. A role for translational control in liver
development and for translation regulators such as p70S6
kinase and 4E-BP1 upon liver regeneration has been previ-
ously reported [18-21]. Therefore, integrating polysome-
bound RNA profiling to total RNA profiling not only provides
highly relevant phenotypic information, but also provides
insight into the role of translational control on the specific
biological process studied.
Results and discussion
Total and polysome-bound RNA changes associated
with hepatocytic differentiation of HepaRG cells
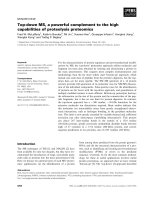
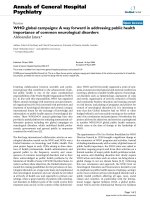
HepaRG cells were induced to differentiate into morphologi-
cally and functionally mature hepatocyte-like cells. Differen-
tiated HepaRG cells showed features of normal hepatocytes,
such as refractile cellular borders, clearly delineated nuclei
and tridimensional polarization with the appearance of
refringent circular canaliculi vertically (Figure 1). In order to
identify the genomic events associated with HepaRG cell dif-
ferentiation, total RNA and polysome-bound RNA were iso-
lated at the proliferative stage and at the end of the
differentiation protocol and analyzed on Affymetrix Human
Genome U133A arrays (Figure 1). We separated polysomes
from free messenger ribonucleoproteins (mRNPs) using
sucrose gradient centrifugation with the assumption that
translationally inactive mRNAs are present as free cytoplas-
mic mRNPs, whereas actively translated mRNAs are con-
tained within polysomes. Total RNA was processed in parallel
for each sample.
Out of the 22,283 probe sets spotted on the array, 3,071
(13.8%) were modulated by at least 2-fold upon differentia-
tion and in 3 independent experiments, either in the total
RNA or the polysome-bound RNA compartments. Total RNA
fold changes were plotted against polysome-bound RNA fold
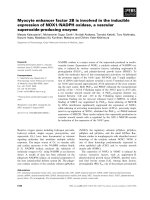
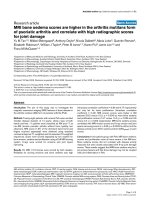
changes for these 3,071 probe sets (Figure 2a). The correla-
tion coefficient for the regression curve calculated from all
values was 0.38, demonstrating a poor correlation and, there-
fore, an uncoupling phenomenon between changes in the
polysome-bound fractions and changes in total RNA upon
differentiation of HepaRG cells. We then determined the dis-
tribution of up- and down-regulated transcripts in each RNA
population upon differentiation. In the total RNA compart-
ment, 547 and 1,636 probe sets (a total of 2,183) were up-reg-
ulated and down-regulated, respectively. In contrast, in the
polysome-bound RNA compartment, 1,325 and 124 probe
sets (a total of 1,449) were up-regulated and down-regulated,
respectively (Figure 2b). Transcription is, therefore, largely
down-regulated during HepaRG differentiation while trans-
lation of specific genes is up-regulated. Probe sets that are
similarly up-regulated or down-regulated in both RNA popu-
lations correspond to genes modulated as a result of tran-
scriptional regulation without any subsequent translational
control. These probe sets represented only a small number of
genes with 359 up-regulated and 88 down-regulated probe
sets. They represented 14.6% of the initially selected 3,071
regulated probe sets (Figure 2b, dark portions of the graph
bars). On the other hand, 2,624 probe sets (85.4% of the total
number of regulated probe sets) were modulated due to
translational control (Figure 2b, gray portions of the bar
graphs).
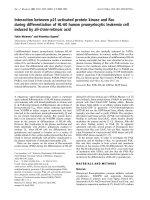
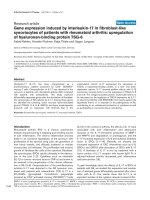
A subset of genes was selected for validation. Validation was
performed using real-time PCR on the total RNA and the
polysome-bound RNA populations, for ten genes: those
encoding apolipoprotein H, solute carrier (SLC)27A3, cyto-
chrome P450 isoforms 3A4 and 7B1, vascular endothelial
growth factor (VEGF), E-cadherin, insulin receptor, leptin
receptor, transforming growth factor (TGF) beta receptor 2
and membrane metallo-endopeptidase (MME). The PCR
results obtained on the three independent experiments con-
firmed the microarray data for all ten genes (Figure 3a). Vali-
dation was also performed using real time PCR on each
fraction of the sucrose gradient separating free mRNPs and
polysomes, for three genes: those encoding latent transform-
ing growth factor beta binding protein 1 (LTBP1), spectrin
repeat-containing nuclear envelope 1 (SYNE-1) and matrix
Genome Biology 2008, Volume 9, Issue 1, Article R19 Parent and Beretta R19.3
Genome Biology 2008, 9:R19
metalloproteinase 3 (MMP3). A shift was observed upon
HepaRG differentiation for all three transcripts from the free
mRNP fractions to the heavier polysome fractions on the
sucrose gradient as shown in Figure 3b for LTBP1. These
results demonstrate an increased translation of these tran-
scripts and validate the array data indicating no change or a
slight decrease in LTBP1, SYNE-1 and MMP3 transcript levels
in the total RNA compartment and a strong up-regulation of
all three transcripts in the polysome-bound RNA
compartment.
All together, these results suggest that translational control
plays a prominent role in the hepatocytic differentiation of
liver progenitor cells and that the total RNA content may not
be representative of the mature phenotype of hepatocyte-like
cells. In addition, transcriptional changes did not overlap
with translational changes. The large majority of polysome-
bound (that is, translated) genes modified were up-regulated
whereas the majority of genes modified at the total RNA level
were down-regulated, suggesting that the mature hepatocyte
phenotype is acquired by increased translation of pre-existing
transcripts. The total RNA population can be considered as a
stock of translated and untranslated transcripts that can be
utilized by the cell rapidly. The more diverse the total RNA
population is, the greater the options the cell has in selecting
protein expression patterns. Therefore, the extensive down-
regulation of genes in the total RNA compartment can be
interpreted as a decrease in cellular RNA diversity, consistent
with the commitment of a dedifferentiated epithelial progen-
itor into a defined, in this case hepatocytic, lineage.
Polysome-bound RNA changes associated with
HepaRG cell differentiation: the hepatocytic
phenotype
To further characterize the differentiated phenotype of
HepaRG cells, we selected all polysome-bound up-regulated
probe sets (n= 1641) and all polysome-bound down-regulated
probe sets (n= 204), regardless of their fold-change status at
the total RNA level. The content of these two lists of genes
were separately analyzed using the Ingenuity Systems Path-
ways Knowledge Base [22]. This database enables one to
search for gene products' interactions and annotations com-
ing from curated data from publications and peer-reviewed
resources. Networks displaying significant overlap between
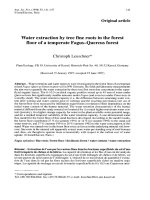
Pipeline for profiling of transcriptional and translational changes occurring during hepatocytic differentiation of HepaRG cellsFigure 1
Pipeline for profiling of transcriptional and translational changes occurring during hepatocytic differentiation of HepaRG cells. Polysome fractions were
identified as described in Materials and methods.
Microarray hybridization
and data mining
Differentiation protocol
Total RNA isolation and
polysomal RNA isolation
Total RNA isolation and
polysomal RNA isolation
Free mRNPs Polysomes
Sucrose concentration
511 Fraction number (top to bottom)
28S
18S
28S
18S
5
11
Fraction number (top to bottom)
Free mRNPs Polysomes
Sucrose concentration
Differentiated cellsProliferative cells
Genome Biology 2008, 9:R19
Genome Biology 2008, Volume 9, Issue 1, Article R19 Parent and Beretta R19.4
Correlation between total RNA and polysome-bound RNA fold changes upon HepaRG cell differentiationFigure 2
Correlation between total RNA and polysome-bound RNA fold changes upon HepaRG cell differentiation. (a) Plot drawn for the selected 3,071 probe
sets between the square-root transformed polysome-bound RNA fold changes and the corresponding total RNA fold changes. The dotted line
corresponds to a total/polysome-bound RNA ratio of 1 (slope = 1). The solid line is the regression curve calculated from all plots. (b) Number of probe
sets regulated upon HepaRG cells differentiation. The number of up- or down-regulated probe sets upon differentiation were plotted against their RNA
population of origin (either total RNA or polysome-bound RNA).
Validation of the array data by real time PCR (a) using total and polysome-bound RNA populations and (b) using individual fractions from mRNPs and polysomal fractions separated on sucrose gradientFigure 3
Validation of the array data by real time PCR (a) using total and polysome-bound RNA populations and (b) using individual fractions from mRNPs and
polysomal fractions separated on sucrose gradient.
Total RNA fold changes
(square-root transformed)
-15
-10
-5
0
5
10
15
20
25
30
-15 -10 -5 0 5 10 15 20 25 30
Polysome-bound RNA fold changes
(square-root transformed)
R = 0.38
(a)
Number of probe sets
Common to both RNA populations
2,000
1,500
1,000
500
0
Total RNA
Polysome-bound
RNA
Total RNA
Polysome-bound
RNA
Up-regulated Down-regulated
(b)
0.00
0.05
0.10
0.15
0.20
0.25
0.30
0.35
0.40
0.45
Proliferative cells
Differentiated cells
511
Fraction number (top to bottom)
Free mRNPs Polysomes
LTBP1 distribution (% of total)
(b)(a)
Gene symbol
Fold change
(p-value)
array - total
Fold change
(± SEM)
PCR - total
Fold change
(p-value)
array - polysome
Fold change
(± SEM)
PCR - polysome
APOH 6.50 (0.060) 4.89 (1.28) 7.60 (0.008) 3.10 (0.42)
E-cadherin 8.64 (0.043) 4.41 (0.25) -1.34 (0.340) 1.37 (0.35)
CYP3A4 357.27 (0.166) 194.00 (89.84) 11.29 (0.001) 39.12 (17.99)
CYP7B1 2.85 (0.048) 2.87 (0.60) -1.49 (0.402) -1.72 (0.33)
INSR 3.84 (0.000) 3.98 (0.27) 1.21 (0.269) 1.10 (0.03)
LEPR 3.07 (0.008) 2.06 (0.28) 1.34 (0.303) -1.17 (0.14)
MME 18.16 (0.026) 9.13 (1.01) 1.49 (0.461) 1.32 (0.33)
SLC27A3 2.04 (0.044) 1.74 (0.18) 22.77 (0.031) 8.44 (0.59)
TGFBR2 6.79 (0.001) 3.07 (0.39) 1.16 (0.505) 1.32 (0.06)
VEGF 4.67 (0.205) 3.30 (0.26) -2.70 (0.013) -1.60 (0.15)
Genome Biology 2008, Volume 9, Issue 1, Article R19 Parent and Beretta R19.5
Genome Biology 2008, 9:R19
the selected regulated genes found in our study and the soft-
ware-preselected members were selected. The Ingenuity
pathway analysis identified nine networks (networks A-I) and
one network (network J) generated from the up-regulated
and down-regulated transcripts, respectively (Table 1 and
Additional data file 1). These ten networks can be divided into
six groups based on their associated biological top functions:
cell cycle, cell death, innate immunity, lipid and drug metab-
olism, cell morphology, and cell environment and movement.
Cell cycle
Network A (Additional data file 1, A) was organized around
transcription factors with tumor suppressor activities. These
included three members of the SMARC tumor suppressor
family (SMARCA2, SMARCB1 and SMARCC2), the transcrip-
tion factors MEF2C and MEF2D and the NF-KB inhibitor NF-
KB1A. Interestingly, several of these transcription factors
(SMARC, MEF) remain uncharacterized in the liver.
Cell death
Network B (Additional data file 1, B) was associated with
increased susceptibility to apoptosis and included the initia-
tor caspase 8, insulin growth factor-binding protein
(IGFBP)1, inhibitor of hepatocytic proliferation in vivo and in
vitro [23], the interferon-induced gene IFI16, an essential
mediator of p53 function [24] and tuberous sclerosis complex
protein 2 (TSC2). The presence of Kininogen 1, a component
of the coagulation cascade produced by the mature hepato-
cyte, confirmed the differentiation status of the cells. Cell
death was also a top function of network C (Additional data
file 1, C) with the presence of another member of the initiator
caspase family, caspase 9, and of FOXO3A, known to trigger
caspase 9-induced apoptosis. Other members associated with
cell death included two strong inducers of apoptosis in
human hepatocytes, TNFSF10/TRAIL [25] and IRF3 [26]
and two members of the BCL2 family, BCL2 and BCL2L11.
While BCL2 protects cells against apoptosis, BCL2L11 facili-
tates this process of cell death by neutralizing BCL2 antiapop-
Table 1
Biological networks and associated top functions generated from polysome-bound probe sets regulated upon HepaRG cell
differentiation
Networks Top functions Members*
Up-regulated
A Cell cycle ACTR2
, C21ORF33, CAST, CCND3, CD86, CDC34, CKB, DACH1, EDA, FASTK, FKBP5, HDAC5,
HSP90B1
, MEF2C, MEF2D, NF-KBIA, PHB, PLCL1, PTMS, PTN, PTPN13, RAB5B, RAB5C, SF3B1,
SF3B3
, SMARCA2, SMARCB1, SMARCC2, TF, TMOD1, TSC22D3, UBE1
B Cell death ACO1, ACO2, ALB, ATRX, BCAP31, BRAF, CALR, CASP8, CFLAR, FCGRT, FOXA1, FTL, HLA-F, IFI16,
IGFBP1
, IHPK2, IL6R, KNG1, LRP1, MADD, MAP2K2, MDM2, NBN, NEK1, NOL3, PEBP1, RAD50,
SIVA
, THBS3, TSC2, TTR, ZNF350
C Cell death
Innate immunity
BCL2, BCL2L11, BCLAF1, BNIP3L, BSG, CAPN1, CAPN7, CASP9, CCNG2, DUSP6, FOXO3A,
FRAT2
, HBP1, IRF3, IRF7, LBP, MAP2, MAPT, MOAP1, NDRG1, NOSIP, PDCD8, PPP2R4, PTBP1,
RARRES3
, RBM5, SATB1, TEGT, TNFRSF11B, TNFSF10, TNFSF13, WWOX
D Innate immunity BBS4, C3, C1RL, C1S, CDK5, CDK5RAP2, CFB, CFI, DCTN1, DDB2, DHX9, ECM1, ERBB3, HP, IL6ST,
MCM4
, MCM5, NR3C2, OAS1, PCM1, PIAS1, PIN1, PIP5K1C, PPP1R1A, PTPN6, RASSF4 (includes
EG:83937), RNF41, RRAS, SAP18, SERPING1, SP100, STAT1, TLN1
E Lipid metabolism
Drug metabolism
ADRA1A, AMPH, AP2A2, APBA3, APOA1, APOC3, BIN1, CEBPD, CPB2, DNM2, EFNA1, EHD1,
EPPB9
, FABP4, FGA, FGB, FGG, HELZ, HMGCS2, HSD17B4, IL13RA2, MECR, MLYCD, NCKIPSD,
NR1H4, PLA2G2A, PLD1
, PPARA, SMYD3, SORBS2, STAT3, SYT1, VAMP2, WASL
F Lipid metabolism
Drug metabolism
ACOX1, ADH6, BRD8, CEBPA, CEP350, CHI3L1, CRADD, CYP3A4, CYP3A5, CYP3A7, FABP1,
GADD45G, H1FX
, HADHA, HADHB, HPR, MPG, NFIL3, NR1H2, PCBP2, PEX11A, PLOD2, PPARD,
RXRA
, S100A8, S100A9, SERPINB1, SLC10A1, SMPDL3A, SULT2A1, TANK, UBN1
G Lipid metabolism
Drug metabolism
ACAA1, ACACB, ADH1A, ADH1B, ADH1C, ADM, AGT, AMACR, ATP1A1, CFH, DBP, DHCR7,
EHHADH, FASN
, FDPS, FXYD2, HLF, MEIS1, MLXIPL, MVD, MYH10, NSDHL, PEX5, PEX7, PPP1R12A,
PURA
, PYGL, RXRB, SREBF1, TCF8, TM7SF2, TXNIP, ZBTB16
H Cell morphology AIP
, ANXA6, ARHGAP1, ARHGEF9, C13ORF24, CBLB, CD40, CDC42, COPA, COPB2, COPE, COPG,
COPZ1
, CUL5, DOCK9, DPP4, FYN, IQGAP1, JAK2, PDE4A, PIK3R1, PLCG1, PRMT5, PTPRA, SLIT2,
SND1
, SORBS1, STAT6, TCEB2, TIMP1, USP33
I Cell environment A2M, APOH, C5, C6, EGR1, ENPEP, F5, F10, FN1, IGFBP2, IL1R1, MAOB, MGP, MMP3, MTCP1, NAB2,
NUP88
, NUP214, NXF3, ORM1, SAPS2, SERPINA5, SERPINF2, SLC25A4, SOD2, SPARC, SPOCK3,
ST6GAL1, TAOK2, TFPI, TFPI2
, VPS45A, VTN
Down-regulated
J Cell movement ACACA, BMP2, CCL2, CSF1, DDX21, FHL2, HGF, HNRPL
, IL8, IRAK1, ITGA6, ITGAM, LIF, NCF2,
PDGFB, POSTN, SERPINE1, SLC12A6
, SYK, TGFB2, THBS1, TLR3, TNC, TNFAIP3, TRAF1, VEGF
*Members indicative of translational regulation are underlined. Members indicative of transcriptional regulation are not underlined. Members sharing
the greatest number of connections within the network are in bold.
Genome Biology 2008, 9:R19
Genome Biology 2008, Volume 9, Issue 1, Article R19 Parent and Beretta R19.6
totic activity [27]. Therefore, the concomitant upregulation of
BCL2 and BCL2L11, together with the pro-apoptotic genes
described above, suggest that upon their differentiation, liver
progenitor cells become highly susceptible to apoptosis. It has
been reported that normal hepatocytes are highly sensitive to
cell death upon, for example, drug-induced liver toxicity and
that three-dimensional polarization, as occurs in this system
(Figure 1), sensitizes hepatocytes to Fas apoptotic signaling
[28]. Noteworthy, both up-regulated caspases identified (cas-
pases 8 and 9) belong to the initiator caspase family, while
none of the members of the effector caspase family (caspases
3, 6 and 7) [29] was affected, supporting the observation that
the cells did not undergo apoptosis in culture.
Innate immunity
Another function associated with network C (Additional data
file 1, C) was innate immunity and responses to viral infec-
tions, with the presence of two members of the interferon-
regulatory factors, IRF3 and IRF7. IRF3 is a key component
of innate immunity in the hepatocyte and has been shown to
mediate interferon (IFN)β induction upon hepatitis C virus
infection [30]. IRF7 is also mandatory for a proper IFNα-
dependent antiviral response against hepatitis C virus [31].
Their up-regulation upon differentiation suggests an associa-
tion between hepatocytic differentiation and innate immu-
nity maturation. Maturation of the innate immunity upon
differentiation was also suggested in network D (Additional
data file 1, D) with the up-regulation of STAT1, one of the
major components of the type I IFN transduction pathway,
playing a key role in antiviral defense, inflammation and
injury [32] and the up-regulation of complement C3 with a
role in innate immunity as well as in acute phase response
[33]. This network also included the EGFR-like receptor
ERRB3 associated with cell survival and CDK5 reported to
inhibit FAS/STAT3-dependent apoptosis in hepatoma cell
lines in vitro and in vivo [34].
Lipid metabolism and drug metabolism
Network E (Additional data file 1, E) included the peroxisome
proliferative activated receptor alpha (PPARA), regulating
the expression of several hepatic genes and lipid homeostasis
in the liver [35], as well as CEBPD and STAT3, key players in
the control of the acute-phase response as well as in the pro-
tection of the hepatocyte upon acute phase-related injury
[32,33,36]. As expected, apolipoproteins A1 and C3 as well as
fibrinogens A, B, and G, markers of functional differentiation
of the hepatocyte in relation to lipid metabolism and acute
phase response, were strongly upregulated, downstream of
PPARA, CEBPD and STAT3. Network F (Additional data file
1, F) included the liver-enriched transcription factors CAAT/
enhancer-binding protein alpha (CEPBA), retinoid X recep-
tor alpha (RXRA), and the peroxisome proliferative activated
receptor delta (PPARD). CEBPA regulates two aspects of
hepatic terminal differentiation: induction of differentiation-
specific genes and repression of mitogenesis [37-39]. RXRA
regulates cholesterol, fatty acid, bile acid, steroid, and xeno-
biotic metabolism and homeostasis in the liver. PPARD also
plays a role in lipid metabolism, including cholesterol efflux
and fatty acid oxidation [40,41], activates fat metabolism to
prevent obesity [42], and regulates fatty acid synthesis, glu-
cose metabolism and insulin sensitivity [43]. Network G
(Additional data file 1, G) included the sterol regulatory ele-
ment-binding transcription factor-1 (SREBF1), a major regu-
lator of sterol biosynthesis, hepatic gluconeogenesis and
lipogenesis in the liver [44], the liver-enriched transcription
factor retinoid X receptor beta (RXRB) [45], MLXIPL, a glu-
cose-responsive transcription factor that regulates carbohy-
drate metabolism in the liver [46], and angiotensinogen, an
endocrine product of the hepatocyte regulating blood pres-
sure [47]. ADH1A, ADH1B and ADH1C, mature hepatocyte-
specific inducible genes involved in ethanol metabolism [48],
were also included in this network.
Cell morphology
Network H (Additional data file 1, H) contained CDC42, a
small GTPase involved in cell polarity. STAT6, also included
in this network, is involved in the induction of a TH1 immune
response to the hepatocyte and protects the normal paren-
chyma against liver injury [32]. Jak2 participates in transduc-
tion of interleukin (IL)6 signaling in case of acute phase
reaction, as well as in the signal transduction of IFNγ [32].
The COP proteins (COPE, COPG, COPZ1, COPA, COPB2)
mediate transport between the Golgi and the endoplasmic
reticulum [49]. Their up-regulation may be associated with
the increased flux of secreted proteins en route to the extra-
cellular compartment through the Golgi complex after syn-
thesis in the mature hepatocyte.
Cell environment and movement
Network I (Additional data file 1, I) included fibronectin
(FN1), a co-factor of endogenous anti-angiogenic molecules
and enhancer of cell attachment [50], and EGR1. EGR1 con-
trols FIN1 and TGFβ1 gene expression and acts as a cell cycle
blocker in vitro and in vivo through p53 [51]. This network
also included MMP3, a secreted metalloprotease implicated
in metastasis [52,53], IGFBP2, an insulin growth factor-bind-
ing protein associated with hepatocytic proliferation inhibi-
tion in vivo and in vitro [23] and two members of the serine
protease inhibitors, SERPINF2 and SERPINA5. Network J
(Additional data file 1, J), the only network associated with
down-regulated polysome-bound probe sets, was also
associated with cellular movement. Notably, the components
of this network included several growth factors and secreted
proteins implicated in angiogenesis and metastasis, such as
hepatocyte growth factor (HGF), VEGF, platelet-derived
growth factor (PDGF)-B, CCL2 and IL8. VEGF and PDGF-B
are potent mitogenic and angiogenic factors [54]. HGF is the
primary agent promoting the proliferation and apoptosis
resistance of mature hepatocytes [55]. CCL2 is a monocyte
chemoattractant [56]. IL8 is a proinflammatory cytokine and
chemoattractant for neutrophils [57]. Therefore, differentia-
tion of hepatocytic progenitors seems to be associated with a
Genome Biology 2008, Volume 9, Issue 1, Article R19 Parent and Beretta R19.7
Genome Biology 2008, 9:R19
progressive disappearance of an inflammation-like state, as
shown by the down-regulation of several chemoattractants
and proinflammatory messengers.
Taken together, this analysis identified the regulation of func-
tions specific to a differentiated hepatocytic phenotype. Up-
regulation of transcripts belonging to the well known liver-
enriched transcription factors, such as CEBPA, RXRA, RXRB,
and PPARD, as well as down-regulation of NF-KB expression,
are correlated with the differentiation of liver progenitor cells
into morphologically and functionally mature hepatocyte-like
cells. This study also revealed the involvement of lesser
known nuclear proteins in the hepatocytic biology, such as
SMARC, MEF and EGR1 proteins, and novel associations,
such as the role of several IFN-associated or induced proteins
in the acquisition of the hepatocytic phenotype. STAT1 is one
of the key elements for the induction of the type I IFN
response. Its up-regulation, as well as the up-regulation of
several other IFN-related transcripts (OAS1, IRF3, IRF7 and
IFI16), suggest that acquisition of key elements to innate
immunity is associated with hepatocytic differentiation. It
would be interesting, therefore, to investigate if the progeni-
tor cell compartment in regenerative livers of chronically hep-
atitis B or C virus-infected patients is more prone to viral
replication because of an immature innate immunity status.
Contribution from translation
Most of the genes identified in this study and contributing to
the differentiation phenotype were modulated by transla-
tional control. Translationally regulated transcripts are
underlined in Table 1 and indicated in blue in Additional data
file 1. To investigate whether translational control specifically
affects transcripts involved in defined cellular functions, we
calculated the percentage of translationally controlled probe
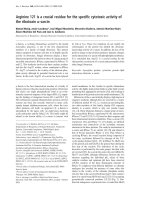
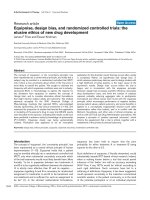
sets in each of the ten networks A-J described above. Paired t-
tests were performed between groups of networks sharing the
same cellular functions (Figure 4). A significantly greater
involvement of translational control was observed in net-
works related to cell cycle and cell death functions than in net-
works related to lipid metabolism and drug metabolism (p =
0.005). Likewise, a significantly stronger involvement of
translational control was found in innate immunity-related
networks compared to cell environment and cell movement-
related networks (p = 0.027). The high percentage of transla-
tionally controlled probe sets in cell cycle and cell death-
related networks is in agreement with the ability of the hepa-
tocyte to massively and rapidly proliferate under acute liver
injury, as well as with the hypersensitivity of the hepatocyte to
cell death in response, for example, to drug-associated toxic-
ity. Translationally regulated transcripts associated with cell
cycle included the nuclear proteins SMARCA2 and
SMARCB1, the transcription factors MEF2C, MEF2D and
EGR1 and the NF-KB inhibitor NFKBIA. Translationally reg-
ulated transcripts associated with cell death included oncos-
tatin M receptor/IL6ST and the initiator caspases 8 and 9.
Translationally regulated transcripts associated with innate
immunity included several interferon-associated genes, such
as those encoding OAS1, IRF3 and IFI16. Finally, numerous
transcription factors associated with inflammation were
translationally upregulated and included the three liver-
enriched transcription factors RARA, RXRA and RXRB and
STAT6 (Table 2).
Numerous transcription factors were translationally upregu-
lated while left unchanged or even decreased at the total RNA
level. Translational control of these transcription factors pro-
vides the cell with a means to modify its phenotype in a timely
manner, rapidly expressing genes downstream of these tran-
scription factors. The hepatocyte has to be a highly versatile
cell because of at least two of its functions: the ability to gen-
erate the acute phase reaction and to maintain blood homeos-
tasy after meals as the first line organ downstream of the
portal vein that carries nutrients from the digestive tract.
The importance of translational control during liver progeni-
tor cell differentiation raises the question of the identity of the
actors involved. We recently reported a functional down-reg-
ulation of the mTOR/4E-BP1/p70S6 kinase pathway during
differentiation of HepaRG cells [58]. Moreover, forced
expression of an activated mutant of mTOR impairs hepato-
cytic differentiation in this model [58]. This pathway may
therefore contribute at least partially to some of the transla-
tional events described here.
Contribution from transcription
Some genes were similarly modified upon differentiation of
HepaRG cells, in both the total and the polysome-bound RNA
populations, indicative of a transcriptional regulation. These
include 435 up-regulated and 142 down-regulated probe sets
(Figure 2b), indicated in yellow in Additional data file 1 and
not underlined in Table 1. These genes corresponded in the
majority to liver-enriched transcripts and to genes involved in
lipid and drug metabolism. They included those encoding
PPARA, PPARD, CEBPA, the hepatic leukemia factor (HLF)
and the alcohol dehydrogenases 1B, 1C and 6. Other tran-
scriptionally regulated genes included those encoding plasma
proteins synthesized in the liver: the SERPINs A1, A4, F2,
several complement system subunits (C1S, C3, C4A, C5 and
C6) and three forms of fibrinogen (A, B and G). Finally,
several cytokines, chemokines or hormones and their recep-
tors were transcriptionally regulated as well: TNFSF10/
TRAIL, IL6R, BMP2 and PDGFB (Table 2).
As the contribution of transcription appeared restricted to
selective genes during HepaRG cell differentiation, we sought
to investigate the expression levels and phosphorylation sta-
tus of the canonic hepatocytic transcription factors HNF1α
and HNF4α throughout differentiation. HNF1α is a major
player in the acquisition of central hepatocytic functions,
including gluconeogenesis, carbohydrate synthesis and stor-
age, lipid metabolism (synthesis of cholesterol and apolipo-
proteins), detoxification (synthesis of cytochrome P450
Genome Biology 2008, 9:R19
Genome Biology 2008, Volume 9, Issue 1, Article R19 Parent and Beretta R19.8
monooxygenases), and synthesis of serum proteins (albumin,
complements, and coagulation factors) [59]. Interestingly,
neither total nor polysome-bound RNA levels of HNF1α were
modulated (-1.38 and +1.48-fold, respectively). This observa-
tion was confirmed by real time PCR (+1.38 ± 0.08 fold
(mean ± standard error of the mean (SEM)) in total RNA and
+1.02 ± 0.19 fold (mean ± SEM) in polysome-bound RNA;
Figure 5a). In addition, no changes were observed at the pro-
tein expression level nor in phosphorylation status for HNF1α
(55% of HNF1α is phosphorylated at the proliferative stage
versus 38% at the differentiated stage; Figure 5b). HNF4α
was slightly increased in both total and polysome-bound RNA
(+1.89-fold and +1.35-fold, respectively). These slight
increases were confirmed by real time PCR (+2.71 ± 0.13 fold
(mean ± SEM) in total RNA and +1.74 ± 0.06 fold (mean ±
SEM) in polysome-bound RNA; Figure 5c). However, HNF4α
phosphorylation was strongly induced upon differentiation
(Figure 5d), suggesting that, in contrast to HNF1α, HNF4α
may contribute to HepaRG cell differentiation. Mutations of
HNF1α associated with metabolic diseases have been
described [60,61] and, therefore, we cannot exclude that the
lack of regulation of HNF1α found in this study results from
mutation(s) disrupting its biochemical characteristics. How-
ever, the patient that gave rise to HepaRG cells was not
known to be affected by any of these diseases.
In conclusion, transcriptional control appears to play a highly
selective role in the phenotype of liver progenitor cell matura-
tion and specifically targets liver-enriched transcripts charac-
teristic of the mature hepatocytic phenotype. Novel findings
Translational control associated with hepatocytic differentiation targets specific cellular functionsFigure 4
Translational control associated with hepatocytic differentiation targets specific cellular functions. Percentages of translationally regulated probe sets in a
given network were calculated for all networks generated from the regulated probe sets identified in the polysome-bound RNA population (networks A
to J depicted in Additional data file 1 and listed in Table 1). Paired t-tests were performed between groups of networks associated with distinct biological
functions and significant p-values (p < 0.05) are indicated. The dashed line indicates 50% of translationally regulated probe sets.
Cell death
Innate immunity
Lipid metabolism
Drug metabolism
Cell environment
Cell movement
Translationally
controlled probe sets (%)
p = 0.005
p = 0.027
Network: A B C D E F G
Cell morphology
HIJ
100
90
80
70
60
50
40
30
20
10
0
Cell cycle
Genome Biology 2008, Volume 9, Issue 1, Article R19 Parent and Beretta R19.9
Genome Biology 2008, 9:R19
Table 2
Selected transcripts
Total (fold change) p-value Polysome (fold change) p-value
Contribution from translation
SMARCA2 + 1.46 NS + 4.26 0.009
SMARCB1 - 4.00 NS + 4.36 0.024
MEF2C + 1.31 NS + 3.98 0.004
MEF2D - 1.29 NS + 2.35 0.018
NF-KBIA + 1.24 NS + 2.81 0.027
Oncostatin M receptor/IL6ST + 1.24 NS + 80.12 0.010
Caspase 8 - 1.92 NS + 4.17 0.010
Caspase 9 + 1.26 NS + 3.50 0.025
OAS1 - 1.69 NS + 4.82 0.016
IRF3 + 1.00 NS + 5.65 0.034
IFI16 + 1.90 NS + 54.11 0.009
RARA - 1.19 NS + 2.69 0.050
RXRA + 1.45 NS + 2.17 0.004
RXRB - 1.23 NS + 4.45 0.013
STAT6 + 1.29 NS + 2.99 0.011
EGR1 + 1.52 NS + 12.34 0.050
IGFBP1 + 1.87 NS + 7.38 0.010
MMP3 - 1.10 0.044 + 6.87 0.047
SLC27A3 + 2.03 0.043 + 22.77 0.031
Contribution from transcription
PPARA + 2.25 0.002 + 2.49 0.026
PPARD + 2.00 0.001 + 3.80 0.005
CEBPA + 3.91 0.050 + 3.86 0.004
HLF + 14.11 0.001 + 17.09 0.015
ADH1B + 354.89 0.021 + 335.41 0.050
ADH1C + 38.86 0.050 + 27.37 0.003
ADH6 + 18.22 0.029 + 46.55 0.050
ApoH + 6.49 0.050 + 7.59 0.008
SERPINA1 + 2.70 0.007 + 10.69 0.015
SERPINA4 + 4.86 0.050 + 18.58 0.037
SERPINF2 + 9.82 0.050 + 2.30 0.000
Complement component 1, s + 2.30 0.008 + 3.40 0.041
Complement component 3 + 2.28 0.050 + 2.98 0.042
Complement component 4A + 6.65 0.006 + 7.86 0.025
Complement component 5 + 3.42 0.039 + 2.33 0.014
Complement component 6 + 36.20 0.000 + 48.42 0.043
Fibrinogen A + 15.35 0.017 + 9.84 0.022
Fibrinogen B + 17.13 0.033 + 15.02 0.033
Fibrinogen G + 14.79 0.015 + 11.55 0.016
TNFSF10/TRAIL + 7.08 0.002 + 5.15 0.007
IL6R + 9.30 0.000 + 15.95 0.012
BMP2 - 2.08 0.000 - 2.00 0.014
PDGFB - 2.53 0.013 - 2.62 0.003
Translational repression
MME + 18.16 0.025 + 1.48 NS
Genome Biology 2008, 9:R19
Genome Biology 2008, Volume 9, Issue 1, Article R19 Parent and Beretta R19.10
suggest that the complement system is induced during matu-
ration following transcriptional regulation.
Translational repression
Several transcripts were strongly transcriptionally induced
upon HepaRG cell differentiation while unchanged or
induced to a much weaker level in the polysome-bound RNA
population, suggesting a translational repression control.
Examples include E-cadherin, involved in hepatocytic polari-
zation, cytochrome P450 3A4, a steroid-inducible cyto-
chrome P450 isoform, cytochrome P450 7B1, a cytochrome
P450 isoform involved in cholesterol metabolism, cyto-
chrome P450 2A6 and 2C19, cytochrome P450 isoforms
involved in drug metabolism, TGF-β receptor 2 and VEGF, an
important regulator of angiogenesis and metastasis (Table 2).
Interestingly, four isoforms of cytochrome P450 were
strongly up-regulated at the total RNA level but not at the
polysome-bound RNA level. Given that cytochromes are
inducible proteins involved in drug and lipid metabolism,
high levels of untranslated RNA could serve as a stock that
may be rapidly translated and used for the detoxification and
acute phase-associated functions of the hepatocyte.
Conclusion
The most prominent result of this study is a strong associa-
tion between translational control and hepatocytic differenti-
ation of liver progenitor cells, as demonstrated by the fact that
the great majority of the regulated genes have been identified
in the polysome-bound RNA population and not in the total
RNA population. Another interesting feature supporting the
involvement of translational control in hepatocytic differenti-
ation of liver progenitor cells is that the large majority of poly-
some-bound transcripts modified upon differentiation were
up-regulated whereas the majority of genes modified in the
total RNA population were down-regulated. Altogether, these
data suggest that the mature hepatocyte phenotype is
acquired by increased translation of pre-existing transcripts
and is associated with a reduction in the diversity of tran-
scripts that the differentiated cell can utilize, consistent with
the commitment of a dedifferentiated epithelial progenitor
into a defined hepatocytic lineage. This study increases our
knowledge on gene expression regulation of liver progenitor
cells upon differentiation, providing novel paths to success-
fully use liver progenitor cells to repopulate diseased livers.
Materials and methods
Cell culture
The HepaRG cell line was cultured in William's E medium
(Invitrogen, Carlsbad, CA, USA) supplemented with 10% fetal
calf serum (Mediatech, Manassas, VA, USA), 100 units/ml
penicillin, 100 μg/ml streptomycin (Invitrogen), 5 μg/ml
insulin (Sigma-Aldrich, St. Louis, MO, USA), and 5 × 10
-5
M
hydrocortisone hemisuccinate (Sigma-Aldrich). To induce
differentiation, a two-step procedure was used as previously
described [14,15]. Cells were seeded at a density of 4 × 10
4
cells/cm
2
and maintained for 2 weeks in the growth medium.
Then, the culture medium was supplemented with 1% DMSO
(Sigma-Aldrich) and 20 ng/ml EGF (PeproTech, Rocky Hill,
NJ, USA) for 2 additional weeks. Cells were harvested either
at 2 days (proliferative stage) or at 28 days (differentiation
stage) after seeding. Cell culture pictures were taken using a
phase contrast microscope (Nikon). Differentiation was eval-
uated morphologically by counting bile canaliculi (refringent
area) at the intersection of two or three hepatocyte-like cells.
Total RNA extraction and polysome fractionation
Total RNA was extracted, precipitated and resuspended in
RNAse-free water using Trizol reagent (Invitrogen) according
to the manufacturer's instructions. For polysome fractiona-
tion, cycloheximide (100 μg/ml) was added to the medium for
3 minutes prior to harvest. The medium was then removed
and the cells were washed with ice-cold phosphate-buffered
saline containing 100 μg/ml cycloheximide. The cells were
E-cadherin + 8.64 0.043 - 1.35 NS
CYP3A4 + 357.26 NS + 11.29 0.015
CYP3A5 + 20.14 0.012 + 4.66 NS
CYP2B6 + 22.78 0.021 + 2.55 0.016
CYP7B1 + 2.85 0.048 - 1.49 NS
CYP2A6 + 2.85 0.002 - 1.51 NS
CYP2C19 + 17.70 NS + 1.35 0.032
CYP4F3 + 19.58 0.038 + 5.14 NS
TGFBR2 + 6.78 0.001 + 1.15 NS
VEGF + 4.67 0.034 - 2.70 NS
Insulin receptor + 3.83 <0.001 + 1.20 NS
Leptin receptor + 3.07 0.007 + 1.34 NS
NS, not significant.
Table 2 (Continued)
Selected transcripts
Genome Biology 2008, Volume 9, Issue 1, Article R19 Parent and Beretta R19.11
Genome Biology 2008, 9:R19
then scraped, centrifuged at 800g for 5 minutes at 4°C and
cytoplasmic RNA was obtained by lysis of the cell pellet in 1
ml of polysome buffer containing 10 mM Tris-HCl (pH 8.0),
140 mM NaCl, 1.5 mM MgCl2, 0.5% Nonidet P-40, and a ribo-
nuclease inhibitor, RNasin (500 units/ml; Promega, Madi-
son, WI, USA). After the removal of nuclei, the cytosolic
supernatant was supplemented with 100 μg/ml cyclohex-
imide, 665 μg/ml heparin, 20 mM dithiothreitol, and 1 mM
phenylmethanesulfonyl fluoride. Mitochondria and mem-
brane debris were removed by centrifugation, and the post-
mitochondrial supernatant was overlaid onto a 15-40%
sucrose gradient and spun at 38,000 rpm for 2 h at 4°C in a
SW41Ti rotor (Beckman Coulter, Fullerton, CA, USA). Frac-
tions (750 μl) were collected from the top of each gradient and
deproteinated with 100 μg of proteinase K in the presence of
1% SDS and 10 mM EDTA. After acid phenol extraction, RNA
integrity was controlled by electrophoresis analysis on 1.2%
agarose gel. Densitometry (GelDoc, Bio-Rad Laboratories,
Hercules, CA, USA) was used to identify the fractions in
which the 28S/18S ratio equals 2 (that is, fractions corre-
Transcriptional, translational, and post-translational regulation of HNF1α and HNF4α during HepaRG cell differentiationFigure 5
Transcriptional, translational, and post-translational regulation of HNF1α and HNF4α during HepaRG cell differentiation. (a,c) Modulation of HNF1α (a)
and HNF4α (c) in total and polysome-bound RNA populations throughout differentiation, assessed by microarray and by quantitative PCR. For microarray
data, values and error bars correspond to the mean ± SEM of three independent differentiation experiments. For real-time PCR data, values and error
bars correspond to the mean ± SEM of three independent measures. (b,d) Protein expression levels and phosphorylation status of HNF1α (b) and
HNF4α (d) in proliferative (P) and differentiated (D) cells. The percentage of the phosphorylated forms is indicated. Results are representative of three
independent differentiation processes.
3.5
3.0
2.5
2.0
1.5
NC
1.5
Microarray
Real-time PCR
3.5
3.0
2.5
2.0
1.5
NC
1.5
Microarray
Real-time PCR
Microarray
Real-time PCR
HNF1α
P
55
D
38
: % p-HNF1α
(a)
Fold-changes HNF1α
(differentiated / proliferative)
Polysome-bound
RNA
Total RNA
(b)
Microarray
Real-time PCR
3.5
3.0
2.5
2.0
1.5
NC
1.5
Microarray
Real-time PCR
3.5
3.0
2.5
2.0
1.5
NC
1.5
HNF4α
(c)
082
: % p-HNF4α
Polysome-bound
RNA
Total RNA
PD
Fold-changes HNF4 α
(differentiated / proliferative)
(d)
Genome Biology 2008, 9:R19
Genome Biology 2008, Volume 9, Issue 1, Article R19 Parent and Beretta R19.12
sponding to polysome-bound RNA). These fractions were
pooled from each sucrose gradient.
Microarray hybridization and data mining
Total and polysome-bound RNAs were purified using the
RNeasy mini-kit clean-up protocol (Qiagen, Valencia, CA,
USA), RW1 buffer being used to efficiently remove heparin
from the samples. The first-strand cDNA, the double-strand
cDNA, and cRNA were synthesized, and cRNA was frag-
mented using Affymetrix kits and guidelines [62]. All cRNA
final products were tested in terms of amount and integrity by
Bioanalyzer (Agilent Technologies, Santa Clara, CA, USA)
prior to microarray hybridization. cRNA samples were proc-
essed on Affymetrix HGU133A arrays with strict adherence to
the labeling, hybridization and staining protocols provided by
Affymetrix. A 'present' (P), 'marginal' (M) or 'absent' (A) call
was assigned to each probe set using Affymetrix GeneChip
Operation Software (GCOS v1.4). Probe sets with an 'absent'
(A) call on all arrays were filtered out. Background correction
and normalization steps were carried out using the GC-RMA
method and the R Bioconductor software [63]. Microarray
data have been deposited in the ArrayExpress repository [64]
under the accession number E-MEXP-1082. Three independ-
ent differentiation processes were performed and the
correlation coefficients between each duplicate at the prolif-
erative and the differentiated level were calculated using scat-
ter plots. For total RNA, the correlation coefficients were 0.98
and 0.95 for proliferative and differentiated cells, respec-
tively. For polysome-bound RNA, the values were 0.98 and
0.97 for proliferative and differentiated cells, respectively.
The Ingenuity pathway analysis [22] was used to analyze
selected probe sets. Each gene identifier was mapped to its
corresponding gene object in the Ingenuity Pathways Knowl-
edge Base. The application utilizes a right-sided Fisher's exact
test to identify networks that had higher odds ratio of con-
taining significant genes. These genes, called Focus Genes,
were then overlaid onto a global molecular network. Net-
works of these Focus Genes were then algorithmically
generated.
Western-blotting
Cells were lysed in 50 mM Tris-HCl (pH 8), 150 mM NaCl,
0.1% SDS, 1% NP-40 supplemented with protease inhibitors
(Complete, Roche Diagnostics, Indianapolis, IN, USA). Thirty
micrograms of proteins were resolved on 10% SDS-polyacry-
lamide gels and electrotransferred onto nitrocellulose mem-
brane (Amersham Biosciences, Piscataway, NJ, USA). Equal
loadings and homogeneous blotting were confirmed using
Ponceau red staining. Membranes were blocked with 5% non-
fat milk in Tris-buffered saline and incubated with primary
antibodies (anti-HNF1α and anti-HNF4α, Santa Cruz Bio-
technology, dilution 1/500, Santa Cruz, CA, USA) overnight.
Horseradish peroxidase-conjugated immunoglobulins
(Dako, dilution 1/1,000, Carpinteria, CA, USA) were used as
secondary antibodies and proteins were visualized with
enhanced ECL chemiluminescent reagent (Amersham Bio-
sciences). Densitometry was performed using the Total Lab
TL100 software.
Real-time PCR
One microgram of DNAse I-treated (Promega) total RNA or
polysome-bound RNA was reverse transcribed using Molo-
ney murine leukemia virus reverse transcriptase and random
hexamers (Invitrogen) for 50 minutes at 42°C. cDNA mix-
tures (1/10) were mixed with an equal volume of 2 × iQ SYBR
green supermix (Bio-Rad Laboratories). Amplification was
then performed at an annealing temperature of 55°C or 60°C
and an elongation time of 30 s or 1 minute on a MyIQ real-
time PCR apparatus (Bio-Rad Laboratories). Primer
sequences were obtained through the Primer Bank website
[65,66] and are described in Additional data file 2. Differen-
tial expression ratios between proliferative and differentiated
stages were calculated using the Δ(ΔCt) formula. Specificity of
all amplicons was assessed by post-run melting curve analysis
and agarose gel electrophoresis. For the analysis on sucrose
gradient fraction distribution, 100 μl of each fraction har-
vested from the sucrose gradients were purified using the
RNAeasy kit (Qiagen). Ten microliters of collected RNA were
DNAse-digested and reverse transcribed as described above.
Since the RNA amount in each fraction was different, in order
to avoid efficiency differences of the reverse transcriptase,
RNA amounts were equalized by adding an appropriate
amount of in vitro transcribed irrelevant RNA to each frac-
tion, giving a final amount of 1 μg of RNA on each sample. One
tenth of each cDNA reaction was processed by real-time PCR
as described above.
Abbreviations
CEPBA, CAAT/enhancer-binding protein alpha; FN1,
fibronectin; HGF, hepatocyte growth factor; HLF, hepatic
leukemia factor; IFN, interferon; IGFBP, insulin growth
factor-binding protein; IL, interleukin; LTBP1, latent trans-
forming growth factor beta binding protein 1; MME, mem-
brane metallo-endopeptidase; MMP3, matrix
metalloproteinase 3; mRNP, messenger ribonucleoprotein;
PDGF, platelet-derived growth factor; PPARA, peroxisome
proliferative activated receptor alpha; PPARD, peroxisome
proliferative activated receptor delta; RXRA, retinoid X
receptor alpha; RXRB, retinoid X receptor beta; SEM, stand-
ard error of the mean; SERPIN, serine protease inhibitor;
SLC, solute carrier; SREBF1, sterol regulatory element-bind-
ing transcription factor-1; SYNE-1, spectrin repeat-contain-
ing nuclear envelope 1; TGF, transforming growth factor;
TSC2, tuberous sclerosis complex protein 2; VEGF, vascular
endothelial growth factor.
Authors' contributions
RP carried out the study, participated in its design and
drafted the manuscript. LB conceived the study and finalized
Genome Biology 2008, Volume 9, Issue 1, Article R19 Parent and Beretta R19.13
Genome Biology 2008, 9:R19
the manuscript. Both authors read and approved the final
manuscript.
Additional data files
The following additional data are available. Additional data
file 1 is a figure showing the polysome-bound generated net-
works associated with differentiation of HepaRG cells. Addi-
tional data file 2 is a table listing the primer sequences and the
lengths of the associated amplicons.
Additional data file 1Polysome-bound generated networks associated with differentia-tion of HepaRG cellsTen networks were identified by the Ingenuity pathway analysis: nine networks (networks A-I) generated from the up-regulated transcripts and one network (network J) generated from the down-regulated transcripts (see also Table 1). Networks were generated from all polysome-bound regulated probe sets upon differentiation of HepaRG cells and classified according to their respective biolog-ical top functions. Networks are represented as nodes displayed using various shapes that represent the functional class of the gene product and lines/arrows displayed with various labels that describe the specific relationship between the nodes. Translation-ally and transcriptionally controlled transcripts are shown in blue and in yellow, respectively. Gene abbreviations are located within the symbol. Solid and dotted lines depict direct and indirect inter-actions, respectively. An asterisk appears next to any gene for which the input file contained more than one identifier; in that case, the maximum value is displayed. A, activation/deactivation; RB, regulation of binding; PR, protein-mRNA binding; PP, protein-protein binding; E, expression; I, inhibition; L, proteolysis M, bio-chemical modification; P, phosphorylation/dephosphorylation; T, transcription; LO, localization.Click here for fileAdditional data file 2Primer sequences and the lengths of the associated ampliconsPrimer sequences and the lengths of the associated amplicons.Click here for file
Acknowledgements
We thank Drs C Trépo and M-A Petit (INSERM Unit 871, Lyon, France) for
the gift of the HepaRG cells. We also thank Deepak Kolippakkam and Neha
Lohia for assistance in data analysis and Paul Farley for assistance in the
preparation of the manuscript.
References
1. Williams R: Global challenges in liver disease. Hepatology 2006,
44:521-526.
2. Overturf K, al-Dhalimy M, Ou CN, Finegold M, Grompe M: Serial
transplantation reveals the stem-cell-like regenerative
potential of adult mouse hepatocytes. Am J Pathol 1997,
151:1273-1280.
3. Sell S, Ilic Z: Liver stem cells. In Stem cells Edited by: Potten CS. San
Diego, CA: Academic Press; 1997:233-282.
4. Matthews VB, Yeoh GC: Liver stem cells. IUBMB Life 2005,
57:549-553.
5. Roskams TA, Libbrecht L, Desmet VJ: Progenitor cells in diseased
human liver. Semin Liver Dis 2003, 23:385-396.
6. Lee JS, Heo J, Libbrecht L, Chu IS, Kaposi-Novak P, Calvisi DF,
Mikaelyan A, Roberts LR, Demetris AJ, Sun Z, Nevens F, Roskams T,
Thorgeirsson SS: A novel prognostic subtype of human hepato-
cellular carcinoma derived from hepatic progenitor cells.
Nat Med 2006, 12:410-416.
7. Yin L, Sun M, Ilic Z, Leffert HL, Sell S: Derivation, characteriza-
tion, and phenotypic variation of hepatic progenitor cell lines
isolated from adult rats. Hepatology 2002, 35:315-324.
8. Strick-Marchand H, Weiss MC: Inducible differentiation and
morphogenesis of bipotential liver cell lines from wild-type
mouse embryos. Hepatology 2002, 36:794-804.
9. Schwartz RE, Reyes M, Koodie L, Jiang Y, Blackstad M, Lund T, Lenvik
T, Johnson S, Hu WS, Verfaillie CM: Multipotent adult progenitor
cells from bone marrow differentiate into functional hepato-
cyte-like cells. J Clin Invest 2002, 109:1291-1302.
10. Allain JE, Dagher I, Mahieu-Caputo D, Loux N, Andreoletti M, West-
erman K, Briand P, Franco D, Leboulch P, Weber A: Immortaliza-
tion of a primate bipotent epithelial liver stem cell. Proc Natl
Acad Sci USA 2002, 99:3639-3644.
11. Strick-Marchand H, Morosan S, Charneau P, Kremsdorf D, Weiss
MC: Bipotential mouse embryonic liver stem cell lines con-
tribute to liver regeneration and differentiate as bile ducts
and hepatocytes.
Proc Natl Acad Sci USA 2004, 101:8360-8365.
12. Fougere-Deschatrette C, Imaizumi-Scherrer T, Strick-Marchand H,
Morosan S, Charneau P, Kremsdorf D, Faust DM, Weiss MC: Plas-
ticity of hepatic cell differentiation: bipotential adult mouse
liver clonal cell lines competent to differentiate in vitro and
in vivo. Stem Cells 2006, 24:2098-2109.
13. Zender L, Spector MS, Xue W, Flemming P, Cordon-Cardo C, Silke
J, Fan ST, Luk JM, Wigler M, Hannon GJ, Mu D, Lucito R, Powers S,
Lowe SW: Identification and validation of oncogenes in liver
cancer using an integrative oncogenomic approach. Cell 2006,
125:1253-1267.
14. Gripon P, Rumin S, Urban S, Le Seyec J, Glaise D, Cannie I, Guyomard
C, Lucas J, Trepo C, Guguen-Guillouzo C: Infection of a human
hepatoma cell line by hepatitis B virus. Proc Natl Acad Sci USA
2002, 99:15655-15660.
15. Parent R, Marion MJ, Furio L, Trépo C, Petit MA: Origin and char-
acterization of a human bipotent liver progenitor cell line.
Gastroenterology 2004, 126:1147-1156.
16. Cerec V, Glaise D, Garnier D, Morosan S, Turlin B, Drenou B, Gripon
P, Kremsdorf D, Guguen-Guillouzo C, Corlu A: Transdifferentia-
tion of hepatocyte-like cells from the human hepatoma
HepaRG cell line through bipotent progenitor. Hepatology
2007, 45:957-967.
17. Troadec MB, Glaise D, Lamirault G, Le Cunff M, Guérin E, Le Meur
N, Détivaud L, Zindy P, Leroyer P, Guisle I, Duval H, Gripon P, Théret
N, Boudjema K, Guguen-Guillouzo C, Brissot P, Léger JJ, Loréal O:
Hepatocyte iron loading capacity is associated with differen-
tiation and repression of motility in the HepaRG cell line.
Genomics 2006, 87:93-103.
18. Haga S, Ogawa W, Inoue H, Terui K, Ogino T, Igarashi R, Takeda K,
Akira S, Enosawa S, Furukawa H, Todo S, Ozaki M: Compensatory
recovery of liver mass by Akt-mediated hepatocellular
hypertrophy in liver-specific STAT3-deficient mice. J Hepatol
2005, 43:799-807.
19. Svegliati-Baroni G, Ridolfi F, Caradonna Z, Alvaro D, Marzioni M, Sac-
comanno S, Candelaresi C, Trozzi L, Macarri G, Benedetti A, Folli F:
Regulation of ERK/JNK/p70S6K in two rat models of liver
injury and fibrosis. J Hepatol 2003, 39:528-537.
20. Goggin MM, Nelsen CJ, Kimball SR, Jefferson LS, Morley SJ, Albrecht
JH: Rapamycin-sensitive induction of eukaryotic initiation
factor 4F in regenerating mouse liver. Hepatology 2004,
40:537-544.
21. Das AT, Salvado J, Boon L, Biharie G, Moorman AF, Lamers WH:
Regulation of glutamate dehydrogenase expression in the
developing rat liver: control at different levels in the prenatal
period. Eur J Biochem 1996, 235:677-682.
22. Ingenuity Pathways Analysis (Ingenuity
®
Systems) [http://
www.ingenuity.com]
23. Scharf JG, Dombrowski F, Ramadori G: The IGF axis and
hepatocarcinogenesis. Mol Pathol 2001, 54:138-144.
24. Fujiuchi N, Aglipay JA, Ohtsuka T, Maehara N, Sahin F, Su GH, Lee
SW, Ouchi T: Requirement of IFI16 for the maximal activa-
tion of p53 induced by ionizing radiation. J Biol Chem 2004,
279:20339-20344.
25. Rodrigues CM, Steer CJ: Fooling the Fas ligand in death. Hepa-
tology 2006, 44:314-317.
26. Kim TY, Lee KH, Chang S, Chung C, Lee HW, Yim J, Kim TK: Onco-
genic potential of a dominant negative mutant of interferon
regulatory factor 3. J Biol Chem 2003, 278:15272-15278.
27. O'Connor L, Strasser A, O'Reilly LA, Hausmann G, Adams JM, Cory
S, Huang DC: Bim: a novel member of the Bcl-2 family that
promotes apoptosis. EMBO J 1998, 17:384-395.
28. Haouzi D, Baghdiguian S, Granier G, Travo P, Mangeat P, Hibner U:
Three-dimensional polarization sensitizes hepatocytes to
Fas/CD95 apoptotic signalling. J Cell Sci 2005, 118:2763-2773.
29. Danial NN, Korsmeyer SJ: Cell death: critical control points. Cell
2004, 116:205-219.
30. Foy E, Li K, Wang C, Sumpter R Jr, Ikeda M, Lemon SM, Gale M Jr:
Regulation of interferon regulatory factor-3 by the hepatitis
C virus serine protease. Science 2003, 300:1145-1148.
31. Zhang T, Lin RT, Li Y, Douglas SD, Maxcey C, Ho C, Lai JP, Wang YJ,
Wan Q, Ho WZ: Hepatitis C virus inhibits intracellular inter-
feron alpha expression in human hepatic cell lines. Hepatology
2005, 42:819-827.
32. Gao B: Cytokines, STATs and liver disease. Cell Mol Immunol
2005, 2:92-100.
33. Juan TS, Wilson DR, Wilde MD, Darlington GJ: Participation of the
transcription factor C/EBP delta in the acute-phase regula-
tion of the human gene for complement component C3. Proc
Natl Acad Sci USA 1993, 90:2584-2588.
34. Selvendiran K, Koga H, Ueno T, Yoshida T, Maeyama M, Torimura T,
Yano H, Kojiro M, Sata M: Luteolin promotes degradation in sig-
nal transducer and activator of transcription 3 in human
hepatoma cells: an implication for the antitumor potential of
flavonoids. Cancer Res 2006, 66:4826-4834.
35. Wan YJ, An D, Cai Y, Repa JJ, Hung-Po Chen T, Flores M, Postic C,
Magnuson MA, Chen J, Chien KR, French S, Mangelsdorf DJ, Sucov
HM: Hepatocyte-specific mutation establishes retinoid X
receptor alpha as a heterodimeric integrator of multiple
physiological processes in the liver. Mol Cell Biol 2000,
20:4436-4444.
36. Cantwell CA, Sterneck E, Johnson PF: Interleukin-6-specific acti-
vation of the C/EBPdelta gene in hepatocytes is mediated by
Stat3 and Sp1. Mol Cell Biol 1998, 18:2108-2117.
37. Hayashi Y, Wang W, Ninomiya T, Nagano H, Ohta K, Itoh H: Liver
Genome Biology 2008, 9:R19
Genome Biology 2008, Volume 9, Issue 1, Article R19 Parent and Beretta R19.14
enriched transcription factors and differentiation of hepato-
cellular carcinoma. Mol Pathol 1999, 52:19-24.
38. Birkenmeier EH, Gwynn B, Howard S, Jerry J, Gordon JI, Landschulz
WH, McKnight SL: Tissue-specific expression, developmental
regulation, and genetic mapping of the gene encoding
CCAAT/enhancer binding protein. Genes Dev 1989,
3:1146-1156.
39. Watkins PJ, Condreay JP, Huber BE, Jacobs SJ, Adams DJ: Impaired
proliferation and tumorigenicity induced by CCAAT/
enhancer-binding protein. Cancer Res 1996, 56:1063-1067.
40. Oliver WR Jr, Shenk JL, Snaith MR, Russell CS, Plunket KD, Bodkin
NL, Lewis MC, Winegar DA, Sznaidman ML, Lambert MH, Xu HE,
Sternbach DD, Kliewer SA, Hansen BC, Willson TM: A selective
peroxisome proliferator-activated receptor delta agonist
promotes reverse cholesterol transport. Proc Natl Acad Sci USA
2001, 98:5306-5311.
41. Tanaka T, Yamamoto J, Iwasaki S, Asaba H, Hamura H, Ikeda Y,
Watanabe M, Magoori K, Ioka RX, Tachibana K, Watanabe Y, Uchi-
yama Y, Sumi K, Iguchi H, Ito S, Doi T, Hamakubo T, Naito M, Auwerx
J, Yanagisawa M, Kodama T, Sakai J: Activation of peroxisome
proliferator-activated receptor delta induces fatty acid beta-
oxidation in skeletal muscle and attenuates metabolic
syndrome. Proc Natl Acad Sci USA 2003, 100:15924-15929.
42. Wang YX, Lee CH, Tiep S, Yu RT, Ham J, Kang H, Evans RM: Perox-
isome-proliferator-activated receptor delta activates fat
metabolism to prevent obesity. Cell 2003, 113:159-170.
43. Lee CH, Olson P, Hevener A, Mehl I, Chong LW, Olefsky JM,
Gonzalez FJ, Ham J, Kang H, Peters JM, Evans RM: PPARdelta reg-
ulates glucose metabolism and insulin sensitivity. Proc Natl
Acad Sci USA 2006, 103:3444-3449.
44. Pedersen TA, Bereshchenko O, Garcia-Silva S, Ermakova O, Kurz E,
Mandrup S, Porse BT, Nerlov C: Distinct C/EBPalpha motifs reg-
ulate lipogenic and gluconeogenic gene expression in vivo.
EMBO J 2007, 26:1081-1093.
45. Yu VC, Delsert C, Andersen B, Holloway JM, Devary OV, Naar AM,
Kim SY, Boutin JM, Glass CK, Rosenfeld MG: RXR beta: a coregu-
lator that enhances binding of retinoic acid, thyroid hor-
mone, and vitamin D receptors to their cognate response
elements. Cell 1991, 67:1251-1266.
46. Kawaguchi T, Takenoshita M, Kabashima T, Uyeda K: Glucose and
cAMP regulate the L-type pyruvate kinase gene by phospho-
rylation/dephosphorylation of the carbohydrate response
element binding protein. Proc Natl Acad Sci USA 2001,
98:13710-13715.
47. Fukamizu A, Takahashi S, Seo MS, Tada M, Tanimoto K, Uehara S,
Murakami K: Structure and expression of the human angi-
otensinogen gene. Identification of a unique and highly active
promoter. J Biol Chem 1990, 265:7576-7582.
48. Wilfred de Alwis NM, Day CP: Genetics of alcoholic liver disease
and nonalcoholic fatty liver disease. Semin Liver Dis 2007,
27:44-54.
49. Gurkan C, Stagg SM, Lapointe P, Balch WE: The COPII cage: uni-
fying principles of vesicle coat assembly. Nat Rev Mol Cell Biol
2006, 7:727-738.
50. Yi M, Sakai T, Fassler R, Ruoslahti E: Antiangiogenic proteins
require plasma fibronectin or vitronectin for in vivo activity.
Proc Natl Acad Sci USA 2003, 100:11435-11438.
51. Krones-Herzig A, Mittal S, Yule K, Liang H, English C, Urcis R, Soni T,
Adamson ED, Mercola D: Early growth response 1 acts as a
tumor suppressor in vivo and in vitro via regulation of p53.
Cancer Res 2005, 65:5133-5143.
52. Monvoisin A, Bisson C, Si-Tayeb K, Balabaud C, Desmouliere A,
Rosenbaum J: Involvement of matrix metalloproteinase type-
3 in hepatocyte growth factor-induced invasion of human
hepatocellular carcinoma cells. Int J Cancer 2002, 97:157-162.
53. Yu FL, Liao MH, Lee JW, Shih WL: Induction of hepatoma cells
migration by phosphoglucose isomerase/autocrine motility
factor through the upregulation of matrix
metalloproteinase-3. Biochem Biophys Res Commun 2004,
314:76-82.
54. Cao R, Bråkenhielm E, Pawliuk R, Wariaro D, Post MJ, Wahlberg E,
Leboulch P, Cao Y: Angiogenic synergism, vascular stability
and improvement of hind-limb ischemia by a combination of
PDGF-BB and FGF-2. Nat Med
2003, 9:604-613.
55. Son G, Hirano T, Seki E, Iimuro Y, Nukiwa T, Matsumoto K, Naka-
mura T, Fujimoto J: Blockage of HGF/c-Met system by gene
therapy (adenovirus-mediated NK4 gene) suppresses hepa-
tocellular carcinoma in mice. J Hepatol 2006, 45:688-695.
56. Salazar-Mather TP, Hokeness KL: Cytokine and chemokine net-
works: pathways to antiviral defense. Curr Top Microbiol Immunol
2006, 303:29-46.
57. Baggiolini M, Walz A, Kunkel SL: Neutrophil-activating peptide-
1/interleukin 8, a novel cytokine that activates neutrophils. J
Clin Invest 1989, 84:1045-1049.
58. Parent R, Kolippakkam D, Booth GC, Beretta L: Mammalian target
of rapamycin activation impairs hepatocytic differentiation
and targets genes moderating lipid homeostasis and hepato-
cellular growth. Cancer Res 2007, 67:4337-4345.
59. Odom DT, Zizlsperger N, Gordon DB, Bell GW, Rinaldi NJ, Murray
HL, Volkert TL, Schreiber J, Rolfe PA, Gifford DK, Fraenkel E, Bell GI,
Young RA: Control of pancreas and liver gene expression by
HNF transcription factors. Science 2004, 303:1378-1381.
60. Vaxillaire M, Rouard M, Yamagata K, Oda N, Kaisaki PJ, Boriraj VV,
Chevre JC, Boccio V, Cox RD, Lathrop GM, Dussoix P, Philippe J,
Timsit J, Charpentier G, Velho G, Bell GI, Froguel P: Identification
of nine novel mutations in the hepatocyte nuclear factor 1
alpha gene associated with maturity-onset diabetes of the
young (MODY3). Hum Mol Genet 1997, 6:583-586.
61. Yamagata K, Oda N, Kaisaki PJ, Menzel S, Furuta H, Vaxillaire M,
Southam L, Cox RD, Lathrop GM, Boriraj VV, Chen X, Cox NJ, Oda
Y, Yano H, Le Beau MM, Yamada S, Nishigori H, Takeda J, Fajans SS,
Hattersley AT, Iwasaki N, Hansen T, Pedersen O, Polonsky KS,
Turner RC, Velho G, Chèvre J-C, Froguel P, Bell GI: Mutations in
the hepatocyte nuclear factor-1alpha gene in maturity-onset
diabetes of the young (MODY3). Nature 1996, 384:455-458.
62. Affymetrix: Technical Notes [ />port/technical/technotesmain.affx]
63. Bioconductor: Open Source Software for Bioinformatics
[]
64. ArrayExpress: European Bioinformatics Institute [http://
www.ebi.ac.uk/arrayexpress]
65. Primer Bank [ />66. Wang X, Seed B: A PCR primer bank for quantitative gene
expression analysis. Nucleic Acids Res 2003, 31:e154.