Báo cáo y học: " Correction of technical bias in clinical microarray data improves concordance with known biological information" pptx
Bạn đang xem bản rút gọn của tài liệu. Xem và tải ngay bản đầy đủ của tài liệu tại đây (943.42 KB, 8 trang )
Genome Biology 2008, 9:R26
Open Access
2008Eklund and SzallasiVolume 9, Issue 2, Article R26
Method
Correction of technical bias in clinical microarray data improves
concordance with known biological information
Aron C Eklund
*†
and Zoltan Szallasi
*†
Addresses:
*
Children's Hospital Informatics Program at the Harvard-MIT Division of Health Sciences and Technology (CHIP@HST), Harvard
Medical School, Boston, MA 02115, USA.
†
Center for Biological Sequence Analysis, Department of Systems Biology, Technical University of
Denmark, DK-2800 Lyngby, Denmark.
Correspondence: Zoltan Szallasi. Email:
© 2008 Eklund and Szallasi; licensee BioMed Central Ltd.
This is an open access article distributed under the terms of the Creative Commons Attribution License ( which
permits unrestricted use, distribution, and reproduction in any medium, provided the original work is properly cited.
Technical bias in clinical microarray data<p>A method is presented to correct for technical bias in clinical microarray data, which increases concordance with known biological rela-tionships.</p>
Abstract
The performance of gene expression microarrays has been well characterized using controlled
reference samples, but the performance on clinical samples remains less clear. We identified
sources of technical bias affecting many genes in concert, thus causing spurious correlations in
clinical data sets and false associations between genes and clinical variables. We developed a
method to correct for technical bias in clinical microarray data, which increased concordance with
known biological relationships in multiple data sets.
Background
The introduction of massively parallel measurement tech-
niques such as gene expression microarrays has led to a much
disputed paradigm shift in experimental design [1]. When a
single biochemical entity is quantified it is customary and
expected to include replicates and carefully selected controls
such as calibration curves, which increase the confidence in
the validity of the measurements. However, due to the rela-
tively high expense of microarrays and the scarcity of starting
material, many microarray data sets feature only a single
measurement per sample. Beyond financial pressure the
main justification for this approach has been the notion that
the overall behavior of a large number or all probes on a given
gene chip provides a reliable estimate of the systematic meas-
urement bias associated with any given probe on the micro-
array. For example, the widely used microarray
normalization methods are based on the assumption that if
the average probe intensity tends to be brighter on a given
chip than on others, then the estimated expression value of
any given probe will be overestimated; therefore, individual
probe intensities on the brighter chip have to be adjusted
accordingly, bringing the average intensity in line with other
chips.
Controlled reference data sets featuring spike-ins or mixtures
have demonstrated the possibility of high accuracy in meas-
urements and have been valuable for comparison of normali-
zation algorithms and analytical techniques [2-4]. However,
it is unclear whether these data sets are representative of real-
world clinical data, or whether an algorithm that performs
well on these data sets also performs well on clinical data.
Results and discussion
In most clinical microarray data sets, very little is known
about the true expression levels, and without such reference
points it is difficult to evaluate the effectiveness of data trans-
formations or statistical methods. However, one possible cri-
terion is that multiple samples taken from the same tumor
should be more similar to each other than they are to samples
taken from other tumors. In a breast cancer data set previ-
ously published by Signoretti et al. [5], 98 surgical specimens
Published: 4 February 2008
Genome Biology 2008, 9:R26 (doi:10.1186/gb-2008-9-2-r26)
Received: 1 October 2007
Revised: 7 December 2007
Accepted: 4 February 2008
The electronic version of this article is the complete one and can be
found online at />Genome Biology 2008, 9:R26
Genome Biology 2008, Volume 9, Issue 2, Article R26 Eklund and Szallasi R26.2
were profiled on Affymetrix HG-U95Av2 arrays. Of these,
eighteen samples form nine replicate pairs, in which two sam-
ples were taken from adjacent sections of the same frozen
block [5]. After normalizing these data with the robust multi-
array average (RMA) algorithm [6], we performed hierarchi-
cal clustering and found that only four of the nine replicate
pairs clustered together (Figure 1a).
In an effort to increase the number of replicate pairs cluster-
ing together, we tried various thresholds for filtering out low-
variance genes. This common practice is intended to reduce
noise by removing genes that are essentially unchanged
between samples [7]. As expected, we found that using
increasingly stringent thresholds yielded more replicate pairs
clustered together (Figure 1d). When we removed all but the
most variable 100 genes, each of the 9 replicate pairs clus-
tered together (Figure 1b). Satisfyingly, seven normal (non-
tumor) samples also clustered together, which had not
occurred with the unfiltered data. Thus, at least in this data
set, strong filtering of expression data results in dendrograms
that more accurately reflect known relationships between
samples. Such filtering might be appropriate if the goal is to
Bias correction improves concordance of replicates in a large breast cancer microarray studyFigure 1
Bias correction improves concordance of replicates in a large breast cancer microarray study. Hierarchical clustering was performed, and the number of
replicate samples correctly paired (joined at the lowest node) was used as a measure of concordance. Colors underneath the dendrograms indicate
replicate samples in which each pair was taken from a single tumor specimen, and black squares indicate samples taken from normal breast. (a) The
unfiltered, uncorrected data results in only four of nine replicate pairs together. (b) Filtering out all but the top 100 genes with highest variance results in
all 9 pairs clustered together. (c) Bias correction as described in this paper also results in all nine replicate pairs clustered together, but in this case all
genes are retained. (d) The concordance achieved by variance filtering is sensitive to the number of genes retained. Generally, filtering out low-variance
probe sets with increasing stringency leads to increased concordance between replicate sample pairs.
0.00
0.05
0.10
0.15
replicate
normal
(a)
0.0
0.2
0.4
0.6
0.8
replicate
normal
(b)
0.00
0.02
0.04
0.06
0.08
0.10
replicate
normal
(c)
?
●●●
●●
●●
●
●
●
10 50 500 5000
4
5
6
7
8
9
number of genes retained
correctly paired replicates
(d)
Genome Biology 2008, Volume 9, Issue 2, Article R26 Eklund and Szallasi R26.3
Genome Biology 2008, 9:R26
extract robust clinical markers. However, for other types of
analysis (for example, when seeking information about a
predetermined set of genes with known biological function)
such extreme filtering may eliminate valuable information, in
which case correction of noisy data would be preferable to its
removal.
Although it is remotely possible that the dendrogram result-
ing from the original, unfiltered data (Figure 1a) indicates
biologically relevant relationships, we assumed that the dis-
ruption of replicate pairs is an artifact caused by noise in the
filtered-out genes. If this noise were entirely random, filtering
out genes would be the only way to reduce noise. However, if
the noise were systematically biased, it might be possible to
characterize the bias and correct the measured expression
values. Notably, even a small amount of systematic bias could
have substantial influence on clustering, if the bias affects a
large enough subset of genes in a coordinated fashion.
Therefore, we searched for evidence of systematic bias in the
Signoretti data set. We anticipated that any systematic bias
would affect a subset of genes having some common charac-
teristic, rather than a random subset of genes. Such bias
would then tend to increase the apparent correlation between
pairs of genes within this subset. By visualizing the correla-
tion between pairs of probe sets, as a function of intensity, we
observed intensity-dependent correlation bias (Figure 2a).
Remarkably, this intensity-dependent correlation bias was
present in all data sets we checked [8-12] and was not
improved by replacing RMA normalization with Microarray
Suite 5 (MAS5), model-based expression index (MBEI) [13],
or GeneChip robust multi-array average (GCRMA) normali-
zation [14] (Additional data file 1). Importantly, the bias was
essentially undetectable after post-summary quantile nor-
malization (PSQN), a secondary normalization step that gives
each sample the same distribution of expression values, dem-
onstrating that the bias is related to the distribution of inten-
sities and does not reflect biologically relevant gene
relationships (Additional data file 1). Also, PSQN applied to
the unfiltered Signoretti data set increased the number of
paired replicates from four (out of nine) to five (data not
shown).
Because PSQN only partially resolved the misclustering of
replicates in the Signoretti data, we sought to understand the
underlying causes of the bias. Two sources of variation, those
arising during hybridization and those intrinsic to the start-
ing RNA, seem especially likely to influence many probe sets
in a coordinated manner. During hybridization, a subset of
probes is susceptible to nonlinear effects caused by saturation
at high intensities or by the noise floor at low intensities [15].
For these probes, changes in target concentration have a
diminished effect on probe intensity compared to probes in
the linear regime. Thus, if samples are loaded onto arrays at
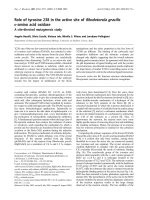
Spurious intensity-dependent correlations between pairs of genes and between genes and bias metricsFigure 2
Spurious intensity-dependent correlations between pairs of genes and between genes and bias metrics. Probe sets were sorted by mean expression and
divided into 50 bins of approximately 250 probe sets each. For each possible pair of bins, the median correlation coefficient between probe sets is
indicated by color. Thus, the presence of colored regions indicates intensity-dependent correlation bias between pairs of probe sets. (a) In the
uncorrected data, the correlation between a given pair of probe sets is biased by the mean expression value of each probe set. For example, two probe
sets that are both highly expressed on average are more likely to be positively correlated than expected by chance. (b) In the bias-corrected data, the
correlation bias is reduced.
0 2000 6000 10000
0 2000 6000 10000
expression rank
expression rank
(a)
0 2000 6000 10000
0
2000 6000 10000
expression rank
expression rank
(b)
−0.2
−0.1
0
0.1
0.2
median correlation
Genome Biology 2008, 9:R26
Genome Biology 2008, Volume 9, Issue 2, Article R26 Eklund and Szallasi R26.4
slightly different concentrations, or are hybridized or washed
under slightly different conditions, any subsequent normali-
zation is likely to overcorrect probes in the nonlinear range
and undercorrect those in the linear range. The use of multi-
ple probes and robust normalization schemes may reduce the
effect of these nonlinear probes, but our observation of inten-
sity-dependent bias (Figure 2a) indicates that many normali-
zation schemes that do not account for systematic bias may be
inadequate in some cases.
A second potential source of bias is the variable quality and
quantity of starting RNA, which may be especially problem-
atic in data sets featuring samples from surgical specimens
[16]. For an individual transcript to contribute to the meas-
ured signal, it must be intact between the region targeted by
microarray probes and the poly-A tail, and the polymerases
involved in Eberwine-type amplification/labeling steps must
complete their processes over this entire distance. Therefore,
any variation in mRNA integrity or in polymerase processiv-
ity should affect the measured intensity by a factor propor-
tional to the number of bases between the probe target and
the 3' poly-A tail. Also, variable amounts of starting mRNA
could affect the final diversity of the amplified cRNA, such
that a sample with less starting mRNA would tend to have
fewer reliably measured genes and, therefore, a higher signal-
to-noise ratio.
In our current analysis we hypothesized that a set of four met-
rics could characterize the relative amount of bias affecting
each sample in a data set. To capture the saturation and noise
floor of the raw probe intensities, we used the median and
interquartile range (IQR) of the perfect-match probes on the
array ('PM median' and 'PM IQR'). The effect of RNA degra-
dation was estimated by the average decrease in expression
between 5' probes and 3' probes ('degradation'). Finally, the
diversity of starting mRNA was characterized by the IQR of
the RMA-summarized expression values ('RMA IQR').
In the Signoretti data set, each of the four bias metrics is cor-
related with the expression values of more probe sets than
expected by chance (Figure 3). When applied to the gene
expression vectors in multivariate linear regression, the four
bias metrics explained 33% of the variance, whereas a set of
random vectors would be expected to explain 4%. The corre-
lation between probe sets and the bias metrics was strongly
intensity-dependent and, thus, may be the source of the
intensity-dependent correlation bias (Figure 4). The RMA
IQR and degradation bias metrics together explain 44% of the
variance in the sample distance matrix, indicating that the
dendrogram derived from all genes in Figure 1a was largely
driven by technical bias.
Since the bias metrics did not correspond to any available
clinical covariates (hormone receptor status, HER-2 amplifi-
cation, tumor grade), we removed the component of the
expression matrix explained by the bias vectors (see Materials
and methods). The resulting bias-corrected data had substan-
tially less intensity-dependent correlation bias (Figure 2b),
and when we subjected it to hierarchical clustering we found
that all nine replicates clustered together (Figure 1c). In a sep-
arate glioma data set with two pairs of replicates [17], an iden-
tical procedure also increased the number of pairs clustering
together (Figure 5). Thus, this bias correction method seems
to improve the correspondence between hierarchical clusters
and known relationships between samples without filtering
out the majority of the genes.
To investigate the effects of bias correction on single-gene
analysis, we used the estrogen receptor (ER) status of breast
tumors as a reference point [7]. Since the ER-positive and ER-
negative subtypes are observed in many data sets and on sev-
eral microarray platforms, the correlation between ER status
and the expression level of any given gene should be relatively
well conserved between data sets of sufficient size. The corre-
lation of correlations (CC) is a measure of consistency in
gene-phenotype association between one data set and
another [18]. We calculated the pairwise CCs between five
breast cancer data sets with a large number of patients (n
range 99-289), a common platform (Affymetrix HG-U133A),
and ER status annotation [8-10,12,19]. Bias removal
increased the average CC from 0.70 to 0.76, although not all
pairs of data sets were improved (Figure 6a). Notably, it was
the data set pairs with an initially low CC that benefited most
from bias correction. In the most extreme case the CC
The expression values of many probe sets are correlated with each of four bias metricsFigure 3
The expression values of many probe sets are correlated with each of four
bias metrics. For each bias metric, a density curve indicates the
distribution of Pearson correlation coefficients between the bias metric
and the expression values of each probe set. The four black curves (which
appear as one) indicate the distribution of correlation coefficients between
the expression values of each probe set and 100 random permutations of
each bias metric.
Pearson correlation
density
−1.0 −0.5 0.0 0.5 1.0
0123
PM median
PM IQR
RMA IQR
degradation
random
Genome Biology 2008, Volume 9, Issue 2, Article R26 Eklund and Szallasi R26.5
Genome Biology 2008, 9:R26
between two data sets increased from 0.55 to 0.76 after bias
correction (Figure 6b, c).
As an alternative to our bias correction method, we consid-
ered batch adjustment, in which the expression matrix is
adjusted, one probe set at a time, to remove any difference in
means between the batches. From the scan dates embedded
in the CEL files, we inferred that the Signoretti breast cancer
data were scanned in three batches. We applied batch adjust-
ment to this data set and found that the number of correctly
paired replicates increased from four to five (data not shown).
Thus, on this data set, batch adjustment is less effective than
our bias correction method. The other data sets used in this
study were each scanned in a relatively large number of
batches (median, 14; range, 8-31), so batch adjustment was
not attempted.
Conclusion
Various analytical approaches are susceptible to errors
caused by technical bias. For simpler analyses of individual
genes (for example, detection of differentially expressed
genes between previously defined groups), technical bias may
manifest as an unmodeled factor that complicates signifi-
cance testing [20]. However, if a bias metric is correlated with
a biological or clinical variable of interest, separating bias
The correlation between genes and bias metrics is non-randomly distributed according to mean gene intensityFigure 4
The correlation between genes and bias metrics is non-randomly distributed according to mean gene intensity. For each probe set in the breast cancer
data set, we calculated the mean intensity (across all 98 samples) and the correlation with a bias metric (also across all 98 samples). The values for all
12,625 probe sets were summarized as two-dimensional histograms for each of the four bias metrics: (a) PM IQR; (b) RMA IQR; (c) PM median; and (d)
degradation.
4681012
−1.0 −0.5 0.0 0.5 1.0
mean log2 expression value
correlation with PM IQR
(a)
4681012
−1.0 −0.5 0.0 0.5 1.0
mean log2 expression value
correlation with RMA IQR
(b)
4 6 8 10 12
−1.0 −0.5 0.0 0.5 1.0
mean log2 expression value
correlation with PM median
(c)
4681012
−1.0 −0.5 0.0 0.5 1.0
mean log2 expression value
correlation with degradation
(d)
0
10
20
30
40
50
60
70
80
count
Bias correction improves concordance of replicates in a glioma gene expression studyFigure 5
Bias correction improves concordance of replicates in a glioma gene expression study. Hierarchical clustering was performed as in Figure 1. (a) The
unfiltered, uncorrected data results in neither of the two replicate pairs together. (b) Bias correction as described in this paper results in one of two
replicate pairs clustered together.
0.00
0.05
0.10
0.15
0.20
replicate
(a)
0.00
0.05
0.10
0.15
replicate
(b)
Genome Biology 2008, 9:R26
Genome Biology 2008, Volume 9, Issue 2, Article R26 Eklund and Szallasi R26.6
effects from biologically relevant effects may be difficult. A
strong correlation may indicate that the groups of samples
were collected or processed under inconsistent conditions, a
situation that should be avoided [21].
More complex analyses have inferred functional relationships
between genes based on their coordinated expression [22].
Such approaches may be especially sensitive to technical bias,
because the coordinated effect of technical bias on multiple
probe sets causes spurious correlations between these probe
sets. On the other hand, coordinated bias on multiple genes
also affects correlation between samples, such that two sam-
ples with dissimilar levels of bias may appear to have very dif-
ferent expression profiles. We have demonstrated that this
bias affects sample clustering, but other visualization meth-
ods, such as principal components analysis, can be similarly
distorted (data not shown). Similarly, recent work has shown
that cellular network reconstruction from gene expression
data can be strongly influenced by artifacts introduced during
normalization [23].
We have found that technical bias can substantially affect
clinical microarray data, and our results indicate that it
should be corrected, or at least considered as a potential con-
founding effect, in any analysis. We have presented a simple
approach for correction of biased data, but it may not be opti-
mal for all data sets. Our choice of bias metrics was based on
consideration of the processes involved in the generation of
microarray data, but other variables, such as those used to
justify the exclusion of outlying arrays, may also quantify
technical bias [24]. As more clinical data sets with known bio-
logical relationships (for example, replicates) become availa-
ble, it will be possible to explore more sophisticated models
for bias correction.
Materials and methods
All analysis was performed using the R statistical environ-
ment [25], with use of the 'affy' package from Bioconductor
[26]. Each data set was normalized/summarized individually
using RMA [6], unless otherwise noted. All correlations are
Pearson product-moment correlations. Hierarchical cluster-
ing was performed using complete linkage and Pearson corre-
lation distance. An R package implementing our method, as
well as raw data and scripts to reproduce our results, are
available on our website [27].
Post-summary quantile normalization
A reference distribution was calculated by averaging the
sorted expression values across all samples. Then, for each
sample, the original expression values were replaced by those
of the reference distribution in the same order, with ties bro-
ken at random. This results in all samples in a data set having
exactly the same distribution of expression values.
Intensity-dependent correlation bias
First, the n rows (probe sets) of the expression matrix were
sorted according to mean expression value. The rows were
then split into 50 bins of approximately equal size. Thus, the
first bin contains the n/50 probe sets having the lowest mean
signal, and the last bin contains the n/50 probe sets having
the highest mean signal. For each possible pair of bins, all (n/
50) × (n/50) pairwise Pearson correlation coefficients
(between rows) were calculated, and the median correlation
coefficient was recorded. These median correlation coeffi-
cients for each pair of bins were plotted as a color-coded 50 ×
50 matrix. Note that for the diagonals of the color-coded
matrix, which corresponds to the correlation between a bin
and itself, only correlations between non-identical probe sets
were counted.
Bias correction increases consistency of correlation with ER status within five clinical breast cancer studiesFigure 6
Bias correction increases consistency of correlation with ER status within five clinical breast cancer studies. (a) CC coefficients are plotted for each
possible pair of data sets, before and after bias correction. The largest improvement, indicated by a red circle, is between data sets from Sotiriou et al. [19]
and Miller et al. [9]. For these two data sets, two-dimensional histograms indicate the distribution of correlation coefficients between expression values
and ER status for all probe sets (b) using uncorrected data and (c) after bias correction.
0.55 0.60 0.65 0.70 0.75 0.80
0.55 0.60 0.65 0.70 0.75 0.80
CC before bias correction
CC after bias correction
●
●
●
●
●
●
●
●
●
●
(a)
−0.4 −0.2 0.0 0.2 0.4 0.6
−0.4
−0.2
0.0 0.2 0.4
0.6
correlation w/ ER (Miller data)
correlation w/ ER (Sotiriou data)
(b)
−0.4 −0.2 0.0 0.2 0.4 0.6
−0.4 −0.2 0.0 0.2 0.4 0.6
correlation w/ ER (Miller data)
correlation w/ ER (Sotiriou data)
(c)
10
30
50
70
90
110
130
counts
Genome Biology 2008, Volume 9, Issue 2, Article R26 Eklund and Szallasi R26.7
Genome Biology 2008, 9:R26
Bias metrics
The four bias metrics defined here were calculated for each
microarray sample: PM Median isthe median of the log
2
-
transformed perfect-match probe intensities; PM IQR is the
interquartile range of the log
2
-transformed perfect-match
probe intensities; RMA IQR is the interquartile range of all
summarized RMA values (which are already log
2
-trans-
formed); and 'degradation' is the slope of the least-squares
regression of the log
2
-transformed perfect-match probe
intensities versus their relative position (within the probe set)
along the targeted transcript - this was calculated with the
AffyRNAdeg function in the Bioconductor package affy [26].
Correlation between bias metrics and expression
values
To calculate the random distributions in Figure 3, each bias
metric was randomly permuted 100 times. We computed
Pearson correlation coefficients between each permutation
and expression values of each of the 12,625 probe sets; thus,
each density curve represents 100 × 12,625 correlation coeffi-
cients. This procedure was repeated for each of the four bias
metrics.
Bias correction
Let E
ij
be the RMA-normalized expression value of probe set i
in sample j. The four bias metrics B
mj
(m ∈ 1 4) were calcu-
lated for each sample j independently. The effect of technical
bias on the expression levels was estimated by least-squares
regression with the bias metrics as independent variables.
Specifically, for each probe set i independently, the parame-
ters
α
i
and
β
im
were chosen to minimize the sum square of the
residuals
ε
ij
.
The bias-corrected expression values are equal to the
residuals plus an offset (to preserve the mean expression for
each probe set):
Correlation-of-correlations
For each data set, we calculated the Pearson correlation coef-
ficient of each probe set with the binary ER status. The CC is
the Pearson correlation coefficient of the resulting vector with
the corresponding vector from a different data set. Thus, the
CC indicates how well two data sets agree on the extent to
which each probe set is correlated with the ER status.
Abbreviations
CC, correlation of correlations; ER, estrogen receptor;
GCRMA, GeneChip robust multi-array average; IQR, inter-
quartile range; MAS5, Microarray Suite 5; MBEI, model-
based expression index; PSQN, post-summary quantile nor-
malization; RMA, robust multi-array average.
Authors' contributions
ACE and ZS conceived and designed the study. ACE per-
formed all analysis. ZS provided guidance. Both authors
wrote, read, and approved the final manuscript.
Additional data files
The following additional data are available with the online
version of this paper. Additional data file 1 is a figure showing
that intensity-dependent correlation bias is present in all data
sets tested.
Additional data file 1Intensity-dependent correlation bias is present in all data sets testedEight arbitrarily chosen cancer data sets [8-12] were tested for intensity-dependent correlation bias. For each data set, the expres-sion values were calculated from the raw data using the RMA, MAS5, MBEI, and GCRMA normalization algorithms. Regardless of the normalization algorithm, intensity-dependent correlation bias was present, and PSQN reduced this bias.Click here for file
Acknowledgements
We thank Andrea Richardson, Hanni Willenbrock, Simon Kasif, Chris
Workman, and Andrea Vala for helpful suggestions and reading of the man-
uscript. This work was supported in part by the National Institutes of
Health through grants P50 CA089393, and R21LM008823-01A1, the
Department of Defense through grant W81XWH-04-1-0549, and by the
Charlotte Geyer Foundation.
References
1. Lee ML, Kuo FC, Whitmore GA, Sklar J: Importance of replica-
tion in microarray gene expression studies: statistical meth-
ods and evidence from repetitive cDNA hybridizations. Proc
Natl Acad Sci USA 2000, 97:9834-9839.
2. Choe SE, Boutros M, Michelson AM, Church GM, Halfon MS: Pre-
ferred analysis methods for Affymetrix GeneChips revealed
by a wholly defined control dataset. Genome Biol 2005, 6:R16.
3. Cope LM, Irizarry RA, Jaffee HA, Wu Z, Speed TP: A benchmark
for Affymetrix GeneChip expression measures. Bioinformatics
2004, 20:323-331.
4. MAQC Consortium, Shi L, Reid LH, Jones WD, Shippy R, Warrington
JA, Baker SC, Collins PJ, de Longueville F, Kawasaki ES, Lee KY, Luo
Y, Sun YA, Willey JC, Setterquist RA, Fischer GM, Tong W, Dragan
YP, Dix DJ, Frueh FW, Goodsaid FM, Herman D, Jensen RV, Johnson
CD, Lobenhofer EK, Puri RK, Schrf U, Thierry-Mieg J, Wang C, Wil-
son M, et al.: The MicroArray Quality Control (MAQC)
project shows inter- and intraplatform reproducibility of
gene expression measurements. Nat Biotechnol 2006,
24:1151-1161.
5. Signoretti S, Di Marcotullio L, Richardson A, Ramaswamy S, Isaac B,
Rue M, Monti F, Loda M, Pagano M: Oncogenic role of the ubiq-
uitin ligase subunit Skp2 in human breast cancer. J Clin Invest
2002, 110:633-641.
6. Irizarry RA, Hobbs B, Collin F, Beazer-Barclay YD, Antonellis KJ,
Scherf U, Speed TP: Exploration, normalization, and summa-
ries of high density oligonucleotide array probe level data.
Biostatistics 2003, 4:249-264.
7. Sorlie T, Perou CM, Tibshirani R, Aas T, Geisler S, Johnsen H, Hastie
T, Eisen MB, van de Rijn M, Jeffrey SS, Thorsen T, Quist H, Matese JC,
Brown PO, Botstein D, Lønning PE, Børresen-Dale A-L: Gene
expression patterns of breast carcinomas distinguish tumor
subclasses with clinical implications. Proc Natl Acad Sci USA
2001, 98:10869-10874.
8. Hess KR, Anderson K, Symmans WF, Valero V, Ibrahim N, Mejia JA,
Booser D, Theriault RL, Buzdar AU, Dempsey PJ, Rouzier R, Sneige
N, Ross JS, Vidaurre T, Gómez HL, Hortobagyi GN, Pusztai L: Phar-
macogenomic predictor of sensitivity to preoperative chem-
otherapy with paclitaxel and fluorouracil, doxorubicin, and
cyclophosphamide in breast cancer. J Clin Oncol 2006,
24:4236-4244.
9. Miller LD, Smeds J, George J, Vega VB, Vergara L, Ploner A, Pawitan
EB
ij i im mj ij
m
=+ +
=
∑
αβ ε
1
4
′
E
ij
′
=+
⋅
EE
ij ij i
ε
Genome Biology 2008, 9:R26
Genome Biology 2008, Volume 9, Issue 2, Article R26 Eklund and Szallasi R26.8
Y, Hall P, Klaar S, Liu ET, Bergh J: An expression signature for p53
status in human breast cancer predicts mutation status,
transcriptional effects, and patient survival. Proc Natl Acad Sci
USA 2005, 102:13550-13555.
10. Minn AJ, Gupta GP, Siegel PM, Bos PD, Shu W, Giri DD, Viale A,
Olshen AB, Gerald WL, Massague J: Genes that mediate breast
cancer metastasis to lung. Nature 2005, 436:518-524.
11. Pawitan Y, Bjöhle J, Amler L, Borg AL, Egyhazi S, Hall P, Han X, Hol-
mberg L, Huang F, Klaar S, Liu ET, Miller L, Nordgren H, Ploner A,
Sandelin K, Shaw PM, Smeds J, Skoog L, Wedrén S, Bergh J: Gene
expression profiling spares early breast cancer patients from
adjuvant therapy: derived and validated in two population-
based cohorts. Breast Cancer Res 2005, 7:R953-964.
12. Wang Y, Klijn JG, Zhang Y, Sieuwerts AM, Look MP, Yang F, Talantov
D, Timmermans M, Meijer-van Gelder ME, Yu J, Jatkoe T, Berns EM,
Atkins D, Foekens JA: Gene-expression profiles to predict dis-
tant metastasis of lymph-node-negative primary breast
cancer. Lancet 2005, 365:671-679.
13. Li C, Wong WH: Model-based analysis of oligonucleotide
arrays: expression index computation and outlier detection.
Proc Natl Acad Sci USA 2001, 98:31-36.
14. Wu Z, Irizarry RA: Preprocessing of oligonucleotide array
data. Nat Biotechnol 2004, 22:656-658.
15. Skvortsov D, Abdueva D, Curtis C, Schaub B, Tavare S: Explaining
differences in saturation levels for Affymetrix GeneChip
arrays. Nucleic Acids Res 2007, 35:4154-4163.
16. Lin DW, Coleman IM, Hawley S, Huang CY, Dumpit R, Gifford D,
Kezele P, Hung H, Knudsen BS, Kristal AR, Nelson PS: Influence of
surgical manipulation on prostate gene expression: implica-
tions for molecular correlates of treatment effects and dis-
ease prognosis. J Clin Oncol 2006, 24:3763-3770.
17. Freije WA, Castro-Vargas FE, Fang Z, Horvath S, Cloughesy T, Liau
LM, Mischel PS, Nelson SF:
Gene expression profiling of gliomas
strongly predicts survival. Cancer Res 2004, 64:6503-6510.
18. Parmigiani G, Garrett-Mayer ES, Anbazhagan R, Gabrielson E: A
cross-study comparison of gene expression studies for the
molecular classification of lung cancer. Clin Cancer Res 2004,
10:2922-2927.
19. Sotiriou C, Wirapati P, Loi S, Harris A, Fox S, Smeds J, Nordgren H,
Farmer P, Praz V, Haibe-Kains B, Desmedt C, Larsimont D, Cardoso
F, Peterse H, Nuyten D, Buyse M, Van de Vijver MJ, Bergh J, Piccart
M, Delorenzi M: Gene expression profiling in breast cancer:
understanding the molecular basis of histologic grade to
improve prognosis. J Natl Cancer Inst 2006, 98:262-272.
20. Leek JT, Storey JD: Capturing heterogeneity in gene expres-
sion studies by surrogate variable analysis. PLoS Genet 2007,
3:1724-1735.
21. Ransohoff DF: Bias as a threat to the validity of cancer molec-
ular-marker research. Nat Rev Cancer 2005, 5:142-149.
22. Stuart JM, Segal E, Koller D, Kim SK: A gene-coexpression net-
work for global discovery of conserved genetic modules. Sci-
ence 2003, 302:249-255.
23. Lim WK, Wang K, Lefebvre C, Califano A: Comparative analysis
of microarray normalization procedures: effects on reverse
engineering gene networks. Bioinformatics 2007, 23:i282-288.
24. Jones L, Goldstein DR, Hughes G, Strand AD, Collin F, Dunnett SB,
Kooperberg C, Aragaki A, Olson JM, Augood SJ, Faull RL, Luthi-
Carter R, Moskvina V, Hodges AK: Assessment of the relation-
ship between pre-chip and post-chip quality measures for
Affymetrix GeneChip expression data. BMC Bioinformatics
2006, 7:211.
25. R Development Core Team: R: A Language and Environment for Statis-
tical Computing Vienna: R Foundation for Statistical Computing; 2007.
26. Gautier L, Cope L, Bolstad BM, Irizarry RA: affy - analysis of
Affymetrix GeneChip data at the probe level. Bioinformatics
2004, 20:307-315.
27. Supplementary Material [ />