Báo cáo y học: "Cross-kingdom patterns of alternative splicing and splice recognition" docx
Bạn đang xem bản rút gọn của tài liệu. Xem và tải ngay bản đầy đủ của tài liệu tại đây (508.29 KB, 19 trang )
Genome Biology 2008, 9:R50
Open Access
2008McGuireet al.Volume 9, Issue 3, Article R50
Research
Cross-kingdom patterns of alternative splicing and splice
recognition
Abigail M McGuire
¤
, Matthew D Pearson
¤
, Daniel E Neafsey and
James E Galagan
Address: The Broad Institute of MIT and Harvard, Cambridge Center, Cambridge, MA 02142, USA.
¤ These authors contributed equally to this work.
Correspondence: Abigail M McGuire. Email:
© 2008 Manson McGuire et al.; licensee BioMed Central Ltd.
This is an open access article distributed under the terms of the Creative Commons Attribution License ( which
permits unrestricted use, distribution, and reproduction in any medium, provided the original work is properly cited.
Cross-kingdom alternative splicing <p>A comprehensive survey of alternate splicing across 42 eukaryotes so as to gain insight into how spliceosomal introns are recognized.</p>
Abstract
Background: Variations in transcript splicing can reveal how eukaryotes recognize intronic splice
sites. Retained introns (RIs) commonly appear when the intron definition (ID) mechanism of splice
site recognition inconsistently identifies intron-exon boundaries, and cassette exons (CEs) are
often caused by variable recognition of splice junctions by the exon definition (ED) mechanism. We
have performed a comprehensive survey of alternative splicing across 42 eukaryotes to gain insight
into how spliceosomal introns are recognized.
Results: All eukaryotes we studied exhibit RIs, which appear more frequently than previously
thought. CEs are also present in all kingdoms and most of the organisms in our analysis. We
observe that the ratio of CEs to RIs varies substantially among kingdoms, while the ratio of
competing 3' acceptor and competing 5' donor sites remains nearly constant. In addition, we find
the ratio of CEs to RIs in each organism correlates with the length of its introns. In all 14 fungi we
examined, as well as in most of the 9 protists, RIs far outnumber CEs. This differs from the trend
seen in 13 multicellular animals, where CEs occur much more frequently than RIs. The six plants
we analyzed exhibit intermediate proportions of CEs and RIs.
Conclusion: Our results suggest that most extant eukaryotes are capable of recognizing splice
sites via both ID and ED, although ED is most common in multicellular animals and ID predominates
in fungi and most protists.
Background
Intron splicing occurs in all domains of life, but the splicing
methods employed and the frequencies of splicing vary
among organisms. Bacteria and archaea lack the spliceosomal
pathway and splice infrequently via self-splicing introns.
Among unicellular eukaryotes, there is substantial range in
splicing frequency [1,2]. Many early-branching eukaryotes,
including the protists Giardia, Cryptosporidia, Trypano-
soma, Entamoeba, and Trichomonas, have few or no introns.
Only 5% of genes are spliced in Saccharomyces cerevisiae
[3], a yeast, while the average number of introns per gene
among other fungi is generally low (with a few noteworthy
Published: 5 March 2008
Genome Biology 2008, 9:R50 (doi:10.1186/gb-2008-9-3-r50)
Received: 15 October 2007
Revised: 28 January 2008
Accepted: 5 March 2008
The electronic version of this article is the complete one and can be
found online at />Genome Biology 2008, 9:R50
Genome Biology 2008, Volume 9, Issue 3, Article R50 McGuire et al. R50.2
exceptions). Their average intron density ranges from just
over one in Schizosaccharomyces pombe to approximately
five in Cryptococcus neoformans [4]. Protists have similarly
low rates of splicing. In contrast, multicellular animals often
have large numbers of introns (over seven per gene in verte-
brates), while plants have intermediate numbers of introns
(approximately four per gene in Oryza sativa and Arabidop-
sis thaliana).
The number of introns and recognized splice sites may vary
between individual mRNA transcripts of a single gene, giving
rise to the phenomena of splice variation and alternative
splicing. In this paper we use 'splice variation' to describe any
difference in intron processing, reserving the term 'alterna-
tive splicing' for splice variation that is regulated and func-
tionally significant. Observed splice variation is a
combination of programmed alternative splicing events and
splicing errors. Functional alternative splicing may result
from various causes, including ontogenic changes and envi-
ronmental stimuli. As the number of genes in an organism is
not well correlated with its complexity, alternative splicing
may provide an additional layer of regulation that permits
greater complexity in higher organisms [5]. Multicellular
organisms may generate different splice forms of the same
gene in different tissues, or even within different cells in the
same tissue [5,6]. More recently, it has also been demon-
strated that alternative splicing can vary between individuals
in a heritable manner [7].
Splice variants can be divided into four broad categories:
retained introns (RIs), cassette exons (CEs), competing 5'
splice sites, and competing 3' splice sites. CEs are the pre-
dominant form of splice variation in multicellular eukaryotes
[8-10], whereas RIs are more frequent in multicellular plants
such as A. thaliana and O. sativa [11-13], as well as the fungus
Cryptococcus and in yeast [14-17].
The profile of splice variants in a given organism is likely
influenced by the mechanisms it uses to identify and process
splice sites. In eukaryotes, it has been proposed that the spli-
ceosome recognizes splice sites in pairs, either across the
intron (intron definition (ID)) or across the exon (exon defi-
nition (ED)) [9]. In ID, splice sites on either side of an intron
are recognized as a unit, while in ED, splice sites on either side
of an exon are recognized as a unit. Experiments in both yeast
and Drosophila have shown that when splice sites are pre-
sumably recognized by ID, mutating a single splice site dis-
rupts splicing of the intron adjacent to the mutation. This
leads to an RI, but has no effect on the splicing of nearby
introns [17,18] (Figure 1). In contrast, when splice sites are
presumably recognized by ED, mutating a single splice site
affects not only the splicing of the intron adjacent to the
mutation, but also the intron on the other side of the exon
adjacent to the mutation. This causes cassette exons to be
skipped [19,20]. Therefore, it is believed that with ID, splicing
errors are more likely to result in RIs, while with ED, splicing
errors are more likely to result in CEs. ID and ED are not
mutually exclusive; in Drosophila melanogaster, ID and ED
have been shown to operate within a single mRNA [21].
The method used to recognize splice sites has been associated
with restrictions on exon and intron length. Recognition of
splice sites with ED appears to constrain exon length [20,22],
while recognition with ID limits intron length [18,23]. Fox-
Walsh et al. [24] suggest that splice site recognition across the
intron in D. melanogaster ceases at lengths greater than
around 200-250 bp. A review of previous studies suggests
that phylogenetic trends in exon and intron length may be
correlated with the relative occurrence of RIs and CEs and the
use of ID or ED for splice junction recognition
[16,18,20,23,24]. However, previous results have been lim-
ited in their phylogenetic scope.
In this paper, we report a comprehensive survey of splice var-
iants in 42 eukaryotic organisms. Our survey covers a wide
phylogenetic range, including 13 multicellular animals, 6
plants, 14 fungi, and 9 protists. We observe variation across
major phylogenetic groups in the representation of RIs and
CEs among splice variants that is consistent with variation in
the mode of splice site recognition (ID or ED) used by these
groups. We infer that groups with a high ratio of RIs to CEs
(fungi and protists) operate predominantly by ID, while
groups with a low ratio of RIs to CEs (multicellular animals)
operate predominantly by ED. In organisms with evidence of
both RIs and CEs (thus, employing both ID and ED), CEs are
shorter than constitutive exons (exons that show no evidence
of splice variation), and RIs are shorter than constitutive
introns, suggesting that splice mechanisms are closely tied to
gene structure.
Results
To assess splice variation in eukaryotes, we selected 42 organ-
isms with genome assemblies and large numbers of publicly
available expressed sequence tags (ESTs; Table 1), spanning
the plants, fungi, protists and multicellular animals. We
aligned ESTs to genome assemblies and constructed tran-
script fragments, examined all loci where the EST data indi-
cated two or more overlapping non-compatible transcripts,
and labeled every instance of splice variation. Table 2 shows
the numbers of ESTs for each organism, as well as the num-
bers of transcripts and loci constructed. Table 3 lists the splice
variants we found. A complete list of the locations of pre-
dicted sites of splice variation, as well as control introns and
exons that show no splice variation despite high EST cover-
age, is available on the Broad Institute's ftp site [25].
All eukaryotes exhibit splice variation
We found that splice variation is present in all organisms we
analyzed. Every eukaryote we studied exhibited RIs, and
almost every organism exhibited competing 5' splice sites,
competing 3' splice sites, and CEs. Several organisms showed
Genome Biology 2008, Volume 9, Issue 3, Article R50 McGuire et al. R50.3
Genome Biology 2008, 9:R50
zero or very few CEs or competing splice sites due to having
only a small EST library or a small overall number of pre-
dicted splice variants (for example, Histoplasma capsula-
tum, Rhizopus oryzae, Entamoeba histolytica), or a small
number of introns (for example, S. cerevisiae). We also found
no CEs in Paramecium tetraurelia, despite a large EST
library and numerous predicted splice variants. However, P.
tetraurelia is unusual in that it has extraordinarily short
introns (25 bp on average). As CEs are usually associated with
longer introns and shorter exons, it is possible that this
organism's gene structure renders CEs impossible.
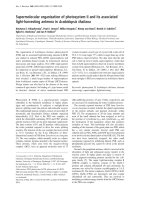
Figure 2 illustrates the relative proportions of the four differ-
ent kinds of splice variants in each organism, along with pre-
viously published data for human for comparison [8]. Our
results for Caenorhabditis elegans, D. melanogaster, A. thal-
iana, and O. sativa confirmed those of previous studies
[10,12,13].
The ratio of competing 3' splice sites to competing 5' splice
sites was fairly constant, with more competing 3' splice sites
than competing 5' splice sites in almost every case (Table 3).
This is consistent with results of previous studies of splice
variation, including the nine organisms in the Altextron data-
base [10] and several other organisms [8,9,12]. When we
combine the data from all the organisms in our analysis, there
are 1.7 times more competing 3' splice sites than competing 5'
splice sites. Interestingly, Zavolan et al. [26] found that com-
peting 3' splice sites are more likely to preserve the reading
frame than competing 5' splice sites.
In contrast to the uniform ratio of competing splice sites, the
ratio of CEs to RIs varies widely between organisms. We
found the ratio (which we will refer to as the CE frac-
tion) to be a useful metric for summarizing the pattern of
these splice variants. The CE fraction is listed in Table 3 and
illustrated in Figure 2 for each organism.
CE and RI prevalence vary by kingdom and by intron
length
Major eukaryotic groups (animals, plants, fungi, and protists)
exhibit very divergent CE fractions (Figure 2). We found that
RIs are the dominant form of splice variation in fungi and
most protists, while CEs are the dominant form in multicellu-
lar animals. Plants have intermediate proportions of CEs and
RIs. The difference in the proportions of RIs and CEs between
the group of animals and the group consisting of all fungi and
protists is highly statistically significant (p < 1e-10 by Fisher's
exact test).
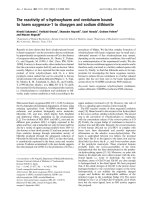
Effects of splicing errors under the intron definition (ID) and exon definition (ED) modelsFigure 1
Effects of splicing errors under the intron definition (ID) and exon definition (ED) models. Arrowheads connected by horizontal bars illustrate the paired
recognition of splice sites. (a) When splice sites are recognized in pairs across introns by ID, an error at a single splice site (marked 'x') prevents the
removal of an intron, leading to a RI. Under ID, two adjacent splice sites must be mis-spliced, and the splicing machinery must operate over a greater
distance, to generate a CE. (b) In the ED model, splice sites are recognized in pairs across exons. An error at a single splice site results in a CE. Obtaining
an RI via ED requires coordinated mis-recognition of two adjacent splice sites over a longer distance. Observed RIs can be parsimoniously explained by ID-
mediated splicing, while observed CEs likely indicate splicing via ED.
(a) Intron definition
Exon 1 Exon 2 Exon 3Intron 1 Intron 2
Exon 1 Exon 3
Cassette exon
XX
Exon 1 Exon 2 Exon 3Intron 1 Intron 2 Exon 1 Exon 2 Exon 3
Normal
splicing
Retained intron
Exon 1 Exon 2 Exon 3Intron 1 Intron 2
Exon 1 Exon 2Intron 1 Exon 3
Splicing
errors
X
(b) Exon definition
Exon 1 Exon 2 Exon 3Intron 1 Intron 2
Exon 1 Exon 2Intron 1 Exon 3
Retained intron
X
X
Exon 1 Exon 2 Exon 3Intron 1 Intron 2 Exon 1 Exon 2 Exon 3
Normal
splicing
Exon 1 Exon 2 Exon 3Intron 1 Intron 2 Exon 1 Exon 3
Cassette exon
X
Splicing
errors
X
X
CE
RI CE+
Genome Biology 2008, 9:R50
Genome Biology 2008, Volume 9, Issue 3, Article R50 McGuire et al. R50.4
The 13 multicellular animals in our analysis have 1.3 times
more CEs than RIs, which corresponds to an overall average
CE fraction of 55%. CE fractions for these organisms range
from 28% for the flatworm Schistosoma mansoni to 95% for
the chordate Branchiostoma floridae. The four insects we
studied have an average CE fraction of 44%. Moreover, varia-
tion in the CE fraction within chordates appears to be associ-
ated with genome size, serving as a partial control for
phylogenetic effects. Takifugu rubripes has a more compact
genome than the other two chordates in our analysis (Danio
Table 1
Genomes and ESTs used in the analysis
Genome name Kingdom Reference ESTs
Danio rerio Animal Assembly Zv6, Sanger Institute [66] Genbank 06/15/07
Takifugu rubripes Animal [67] Genbank 06/22/07
Branchistoma floridae Animal JGI [60] (v1.0) Genbank 06/22/07
Ciona savignyi Animal Broad Institute [58] (ci1.0) Genbank 06/15/07
Ciona intestinalis Animal [68] Genbank 06/15/07
Nematostella vectensis Animal [69] Genbank 06/22/07
Strongylocentrotus purpuratus Animal [70] Genbank 06/27/07
Drosophila melanogaster Animal [71] Genbank 06/15/07
Aedes aegypti Animal [72] Vectorbase [61,73]
Anopheles gambiae. Animal [74] Vectorbase [61,73]
Apis mellifera Animal [75] Genbank 06/18/07
Caenorhabditis elegans Animal [76] Genbank 02/1/07
Schistosoma mansoni Animal TIGR/JCVI [59] Genbank 06/22/07
Rhizopus oryzae Fungi Broad Institute [58] Genbank 06/15/07 + Broad Institute [58]
Cryptococcus neoformans JEC21 Fungi [15] Genbank 06/19/07
Ustilago maydis Fungi [77] Genbank 06/15/07
Schizosaccharomyces pombe Fungi [78] Genbank 01/14/08
Saccharomyces cerevisiae Fungi [79] Genbank 01/14/08
Neurospora crassa Fungi [80] Genbank 06/15/07
Magnaporthe grisea 70-15 Fungi [81] Genbank 06/15/07
Stagnospora nodorum Fungi Broad Institute [58] Genbank 06/15/07
Aspergillus flavus NRRL3357 Fungi TIGR/JCVI [59], GenBank AAIH00000000 Genbank 06/15/07
Aspergillus nidulans Fungi [82] Genbank 06/15/07
Histoplasma capsulatum Fungi Broad Institute [58] Genbank 06/15/07
Coccidioides posadasii Fungi TIGR/JCVI [59] Genbank 06/15/07
Coccidioides immitis RS Fungi Broad Institute [58] Genbank 06/15/07
Sclerotinia sclerotiorum 1980 Fungi Broad Institute [58] Genbank 06/15/07 + Broad Institute [58]
Dictyostelium discoideum Protist [83] Genbank 06/15/07
Populus trichocarpa Plant [84] Genbank 06/18/07
Arabidopsis thaliana Plant [85] Genbank 06/16/07
Oryza sativa Plant [86] Genbank 06/15/07
Physcomitrella patens Plant JGI [60] (v1.1) Genbank 06/28/07
Chlamydomonas reinhardtii Plant JGI [60] (v3.0) Genbank 06/18/07
Ostreococcus lucimarinus Plant [87] JGI [60]
Phytophthora infestans Protist Broad Institute [58] (C Nusbaum, personal communication) Genbank 06/15/07
Phytophthora sojae Protist [88] Genbank 06/15/07
Plasmodium yoelii Protist [89] Genbank 06/15/07
Plasmodium falciparum 3D7 Protist [90] Genbank 06/19/07
Paramecium tetraurelia Protist [91] Genbank 06/15/07
Tetrahymena thermophila Protist [92] Genbank 06/19/07
Entamoeba hystolitica Protist [4] Genbank 06/18/07
Phaeodactylum tricornutum Protist JGI [60] Genbank 06/28/07
Genome Biology 2008, Volume 9, Issue 3, Article R50 McGuire et al. R50.5
Genome Biology 2008, 9:R50
rerio and B. floridae), and has a correspondingly lower CE
fraction (53%) than they do (D. rerio has a CE fraction of
68%; B. floridae, 95%).
In contrast, among the unicellular fungi and protists, we see
very few CEs and an overwhelming preference for RIs.
Overall, fungi and protists have 37 times more RIs than CEs
(an average CE fraction of 3%). This preference for intron
Table 2
Numbers of ESTs, transcripts, and loci
Kingdom Total ESTs* Spliced. Filtered ESTs
†
Transcripts
‡
Loci
§
D. rerio Animal 1350,105 556,175 76,066 33,338
T. rubripes Animal 26,069 14,197 5,890 4,988
B. floridae Animal 277,538 57,883 15,784 12,054
C. savignyi Animal 84,302 24,196 7,027 8,382
C. intestinalis Animal 686,396 334,137 31,794 15,108
N. vectensis Animal 16,619 6,206 4,609 4,294
S. purpuratus Animal 141,833 24,770 23,256 20,773
D. melanogaster Animal 532,557 242,235 25,241 14,965
A. aegypti Animal 303,409 120,523 15,878 11,389
A. gambiae Animal 216,617 95,607 13,511 9,835
A. mellifera Animal 78085 32,860 9,581 7,800
C. elegans Animal 346,064 219,812 28,438 21,304
S. mansoni Animal 158,841 55,392 14,494 10,137
R. oryzae Fungi 25,393 12,238 3,263 3,052
C. neoformans Fungi 59,041 46,693 8,173 6,361
U. maydis Fungi 39,308 11,236 1,289 1,109
S. pombe Fungi 5,574 843 274 269
S. cerevisiae Fungi 32,653 2,251 259 245
N. crassa Fungi 28,089 7,577 1,571 1,495
M. grisea Fungi 53,102 14,563 3,229 2,795
S. nodorum Fungi 15,973 5,925 1,637 1,537
A. flavus Fungi 20,371 8,495 3,004 2,772
A. nidulans Fungi 16,848 5,499 2,240 2,090
H. capsulatum Fungi 26,389 2,334 850 950
C. posadasii Fungi 54,217 30,604 6,769 5,296
C. immitis Fungi 65,754 32,162 6,484 5,133
S. sclerotiorum Fungi 65,884 30,203 4,314 3,704
D. discoideum Protist 155,032 46,116 4,687 4,246
P. trichocarpa Plant 89,943 38,299 11,462 9,377
A. thaliana Plant 1,276,692 350,380 35,856 23,412
O. sativa Plant 977,774 374,397 43,265 25,610
P. patens Plant 194,822 106,309 21,962 15,402
C. reinhardtii Plant 167,641 72,903 11,353 8,514
O. lucimarinus Plant 19,200 1,043 328 304
P. infestans Protist 94,091 17,381 4,762 4,104
P. sojae Protist 28,357 7,418 2,125 2,012
P. yoelii Protist 13,925 2,863 1,019 931
P. falciparum Protist 21,349 3,928 1,417 1,219
P. tetraurelia Protist 86,070 44,772 11,423 10,258
T. thermophila Protist 56,543 21,073 6,035 5,540
E. histolytica Protist 20,404 599 174 166
P. tricornutum Protist 89,139 14,576 3,325 2,937
*Number of raw ESTs before filtering.
†
Number of ESTs aligned after applying our set of filters, containing at least one splice site (see Materials and
methods).
‡
Number of 'transcripts' constructed from the ESTs.
§
Number of 'loci' (overlapping clusters of transcripts) (genes with 1+ splice site).
Genome Biology 2008, 9:R50
Genome Biology 2008, Volume 9, Issue 3, Article R50 McGuire et al. R50.6
Table 3
Types of splice variants observed
Retained introns
Kingdom No. of splice
variants
Cassette
exons
Discarding
unspliced ESTs
Keeping
unspliced ESTs*
Competing
5' sites
Competing
3' sites
(CE fraction)
D. rerio Animal 6,137 2,475 1,176 2,324 931 1,555 0.68
T. rubripes Animal 201 52 47 79 50 52 0.53
B. floridae Animal 812 516 26 123 121 149 0.95
C. savignyi Animal 181 93 18 64 22 48 0.84
C. intestinalis Animal 2,779 834 907 2,084 394 644 0.48
N. vectensis Animal 108 54 8 33 21 25 0.87
S. purpuratus Animal 284 147 13 50 63 61 0.92
D. melanogaster Animal 2,163 453 712 2,343 442 556 0.39
A. aegypti Animal 983 280 284 606 186 233 0.50
A. gambiae Animal 882 207 283 635 190 202 0.42
A. mellifera Animal 561 153 124 338 135 149 0.55
C. elegans Animal 1,589 361 452 828 285 491 0.44
S. mansoni Animal 1,236 235 599 974 143 259 0.28
R. oryzae Fungi 47 0 30 55 5 12 0
C. neoformans Fungi 1,091 18 768 1,117 101 204 0.02
U. maydis Fungi 85 8 31 105 16 30 0.21
S. pombe Fungi 3 0 3 13 0 0 0
S. cerevisiae Fungi 9 0 2 42 3 4 0
N. crassa Fungi 20 2 8 30 5 5 0.20
M. grisea Fungi 151 5 86 194 24 36 0.05
S. nodorum Fungi 36 2 21 37 5 8 0.09
A. flavus Fungi 162 3 124 302 13 22 0.02
A. nidulans Fungi 100 1 74 216 8 17 0.01
H. capsulatum Fungi 50 1 33 65 6 10 0.03
C. posadasii Fungi 950 15 648 1,259 120 167 0.02
C. immitis Fungi 861 8 542 1,035 131 180 0.01
S. sclerotiorum Fungi 323 9 210 419 49 55 0.04
D. discoideum Protist 107 6 33 98 29 39 0.15
P. trichocarpa Plant 664 144 215 392 103 202 0.40
A. thaliana Plant 3,255 251 1,260 2,609 547 1,197 0.17
O. sativa Plant 3,893 450 1,339 3,076 706 1,398 0.25
P. patens Plant 2,068 249 534 1,156 558 727 0.32
C. reinhardtii Plant 490 60 211 520 86 133 0.22
O. lucimarinus Plant 17 0 13 60 2 2 0
P. infestans Protist 406 6 262 564 60 78 0.02
P. sojae Protist 66 1 32 87 15 18 0.03
P. yoelii Protist 38 1 22 92 6 9 0.04
P. falciparum Protist 77 9 34 75 19 15 0.21
P. tetraurelia Protist 535 0 407 786 35 93 0
T. thermophila Protist 282 6 202 423 30 44 0.03
E. histolytica Protist 7 0 6 24 0 1 0
P. tricornutum Protist 215 0 126 643 27 62 0
*For comparison, we include the total number of RIs predicted when unspliced ESTs are not discarded. Discarding unspliced ESTs primarily affects
the number of predicted RIs. Complete results for all forms of alternative splicing, when unspliced ESTs are not discarded, are included in Additional
data file 5.
CE
RI CE+
Genome Biology 2008, Volume 9, Issue 3, Article R50 McGuire et al. R50.7
Genome Biology 2008, 9:R50
retention is consistent with previous reports on baker's yeast
and fission yeast [17,27], although our kingdom-wide sam-
pling indicates RI predominance is not limited to the highly
derived yeasts. RIs also dominate in C. neoformans [15], a
member of a group of intron-rich fungi, indicating that RI
dominance in fungi is not coupled with intron density.
Plants in turn appear intermediate between animals and
fungi in their relative amounts of CEs and RIs. We examined
four multicellular plants: A. thaliana, O. sativa (rice), Popu-
lus trichocarpa (cottonwood), and Physcomitrella patens (a
moss), as well as two unicellular green algae
(Chlamydomonas. reinhardtii and Ostreococcus lucimari-
nus). Overall, we found 3.1 times more RIs than CEs, with an
average CE fraction of 24%, consistent with previous studies
in A. thaliana and O. sativa [11-13]. The unicellular algae C.
reinhardtii has a CE fraction of 22%, which is closer to the
values seen in multicellular plants than other unicellular
organisms. However, it has a large genome size for a unicellu-
lar organism (118 Mb). In contrast, O. lucimarinus is a much
simpler unicellular green algae with smaller genome size (13
Mb), minimal cellular organization and no CEs, a genome
structure that is more like those of unicellular fungi and
protists.
Frequencies of different forms of splice variation, arranged by phylogenetic groupFigure 2
Frequencies of different forms of splice variation, arranged by phylogenetic group. The two bar charts show the relative frequencies of each type of splice
variation. The ratio of CEs to RIs is shown in the chart on the left, while the one on the right displays competing 5' and competing 3' splice sites. Note that
the CE/RI ratio shows wide variation among kingdoms while the ratio of competing 5' to competing 3' splice sites is remarkably consistent. A high-level
overview of the phylogenetic tree is shown on the far left, and the organisms' names are colored according to their phylogenetic grouping. To see all four
forms of splice variation on a single bar plot, see Additional data file 1. The data for H. sapiens was taken from a previous study [8].
P. tricornutum
E. histolytica
T. thermophila
P. tetraurelia
P. falciparum
P. yoelii
P. sojae
P. infestans
O. lucimarinus
C. reinhardtii
P. patens
O. sativa
A. thaliana
P. trichocarpa
D. discoideum
S. sclerotiorum
C. immitis
C. posadasii
H. capsulatum
A. nidulans
A. flavus
S. nodorum
M. grisea
N. crassa
U. maydis
C. neoformans
R. oryzae
S. mansoni
C. elegans
A. mellifera
A. gambiae
A. aegypti
D. melanogaster
S. purpuratus
N. vectensis
C. intestinalis
C. savignyi
B. floridae
T. rubripes
D. rerio
H. sapiens
Cassette exons
Retained introns
Observed splice variants (%)
050100
50 100
Alternate 5´ sites Alternate 3´ sites
Observed splice variants (%)
ANIMALS
FUNGI
SLIME
MOLD
PLANTS
PROTISTS
S. pombe
S. cerevisiae
0
Genome Biology 2008, 9:R50
Genome Biology 2008, Volume 9, Issue 3, Article R50 McGuire et al. R50.8
Table 4
Intron and exon lengths for controls and splice variants
Kingdom Intron
density*
Genome
assembly
size (Mb)
†
Average
intron
length
‡
Average RI
length
§¶
Average
intron length
next to CE
¥
No. of CEs
with
unambiguous
boundaries
#
% introns
>200 bp**
Average
exon
length
¶††
Average
internal exon
length
¶‡‡
Average CE
length
§§
D. rerio Animal 7.2 1,547 2,940 130 3,485 903 71% 180 132 113
T. rubripes Animal 8.1 393 582 126 641 22 45% 140 119 103
B. floridae Animal 5.7 923 1,283 115 1,424 135 91% 151 124 111
C. savignyi Animal 9.1 164 710 87 595 20 82% 148 130 123
C. intestinalis Animal 7.4 117 457 152 544 327 76% 181 143 122
N. vectensis Animal 4.1 357 823 167 820 26 79% 165 110 90
S. purpuratus Animal 907 1,819 176 2,085 40 99% 174 141 133
D. melanogaster Animal 3.9 120 829 90 1,632 218 25% 279 246 167
A. aegypti Animal 3.1 1,384 4,614 106 7,752 112 42% 309 252 204
A. gambiae Animal 3.2 278 1,154 110 2,905 83 26% 286 236 181
A. mellifera Animal 5.4 454 1,171 107 2,969 98 40% 195 172 153
C. elegans Animal 5.5 100 259 84 497 176 30% 189 181 151
S. mansoni Animal 4.8 381 2,222 42 2,387 127 77% 179 167 130
R. oryzae Fungi 2.3 46 58 66 - 0 1% 201 161 -
C. neoformans Fungi 5.4 19 64 67 95 8 5% 228 179 56
U. maydis Fungi 0.8 20 168 134 288 5 18% 256 143 52
S. pombe Fungi 1.3 13 108 58 - 0 14% 309 102 -
S. cerevisiae Fungi 0.1 12 241 244 - 0 49% 596 46 -
N. crassa Fungi 1.8 39 115 126 171 2 11% 206 142 78
M. grisea Fungi 1.7 42 109 110 103 5 7% 238 160 64
S. nodorum Fungi 1.7 37 70 82 88 2 3% 257 178 17
A. flavus Fungi 2.3 40 76 76 76 1 2% 249 161 90
A. nidulans Fungi 2.8 30 74 87 78 1 2% 204 151 8
H. capsulatum Fungi 2.5 33 112 114 114 1 8% 227 155 25
C. posadasii Fungi 2.2 27 80 87 137 10 2% 395 289 81
C. immitis Fungi 2.5 29 80 83 89 3 2% 349 244 54
S. sclerotiorum Fungi 1.8 38 84 98 71 7 5% 316 213 56
D. discoideum Protist 1.3 34 145 107 252 3 13% 265 231 110
P. trichocarpa Plant 3.1 308 431 140 637 80 50% 204 125 103
A. thaliana Plant 4.9 119 180 118 242 138 23% 201 143 101
O. sativa Plant 4.4 371 462 134 725 299 46% 212 135 116
P. patens Plant 3.8 480 295 188 394 188 57% 220 137 113
C. reinhardtii Plant 7 118 264 148 376 30 56% 172 121 103
O. lucimarinus Plant 0.5 13 157 97 - 0 28% 437 135 -
P. infestans Protist 2 229 76 78 88 5 1% 214 146 92
P. sojae Protist 86 87 107 75 1 2% 213 147 111
P. yoelii Protist 1.2 23 179 151 157 1 25% 229 127 18
P. falciparum Protist 1.8 23 157 119 176 8 24% 189 112 113
P. tetraurelia Protist 2.5 72 25 26 - 0 0% 246 233 -
T. thermophila Protist 3.3 104 132 103 136 3 17% 234 166 83
E. histolytica Protist 23 72 62 - 0 2% 296 168 -
P. tricornutum Protist 0.8 26 128 109 - 0 12% 446 410 -
*(Number of introns in genome/Number of genes in genome), calculated from genome annotations.
†
The length of the assembly used in our analysis.
‡
Calculated from constitutive introns in EST alignments.
§
Average length of RIs seen in our EST alignments.
¶
See Table S2 in Additional data file 4 for
average lengths based on genome annotations.
¥
Average length of the two introns surrounding each predicted CE in our EST alignments.
#
Number of
CEs considered for 'Average intron length next to CE' in the previous column and in Figure 5. This excludes those CEs where the introns next to the
CEs do not have identical boundaries between transcripts with and without that CE. **Fraction of constitutive introns longer than 200 bp.
††
Calculated from constitutive exons in our EST alignments.
‡‡
Calculated from constitutive exons in our EST alignments (excluding exons that cannot
be CEs, namely, the first and last exons in a gene, and exons in genes without introns).
§§
Average length of CEs seen in our EST alignments.
Genome Biology 2008, Volume 9, Issue 3, Article R50 McGuire et al. R50.9
Genome Biology 2008, 9:R50
The observed variation in CE fraction closely parallels varia-
tion in intron length. Animals and plants have more long
introns (introns greater than 200 bp) than do protists and
fungi (Table 4). In Figure 3 we plot the fraction of constitutive
introns greater than 200 bp versus the CE fraction, and dem-
onstrate a direct correlation between the presence of long
introns and high incidence of CEs (y = 0.84x + 0.00; R
2
=
0.73). This correlation also holds within each kingdom (fungi,
protists, plants, and animals), providing a phylogenetic con-
trol. As discussed below, this correlation is consistent with the
hypothesis that splice site recognition differs within these
groups.
Variably spliced regions exhibit size constraints
As shown in Table 4, variably spliced introns and exons are
usually shorter than those in our data set that display no
splice variation, in agreement with previous observations
[28]. Moreover, these length differences between constitutive
and variably spliced introns and exons appear to be associ-
ated with the relative frequencies of splice variation via CEs
and RIs. In organisms where CEs are rare, such as fungi, CEs
tend to be noticeably shorter than internal constitutive exons.
However, in organisms with substantial fractions of CEs (ani-
mals and multicellular plants) we observe no significant
length difference between CEs and internal constitutive exons
(Figure 4). Intron retention displays the opposite behavior. In
organisms where RIs are uncommon (animals and multicel-
lular plants), RIs tend to be shorter than constitutive introns,
while organisms with large numbers of RIs (fungi and pro-
tists) show no substantial length difference between RIs and
constitutive introns (Figure 5). In general, CEs and RIs both
tend to be shorter than their constitutively spliced counter-
parts, with the length difference most noticeable in organisms
in which each splice variant was uncommon.
Most splice variants are not functional
We next sought to determine the degree to which the
observed splice variants reflect programmed alternative
splicing versus incomplete splicing or splicing errors. To do
so, we examined the impact of observed splice variants on the
corresponding open reading frame and resultant protein. We
also examined conservation within regions containing splice
variants to look for signatures of coding selection.
Previous analyses of splice variants in mammals have focused
on the more prevalent CEs. One surprising result from these
analyses is the high frequency of CEs that alter reading frame
or introduce stop codons [29]. Overall, approximately half of
human CEs in coding regions result in frameshifts, while an
additional 15% of CEs that do not cause frameshifts introduce
in-frame stop codons [29]. A more recent analysis of splice
variants generated by the ENCODE consortium [30] revealed
little evidence that alternative splice variants commonly give
rise to functional isoforms. In the case of frameshifts, if both
alternative open reading frames lead to functional proteins,
one would expect the polymorphism or divergence level in all
three codon positions to be the same [30]. Few splice variants
in the ENCODE analysis displayed this property [30]. Our
data are consistent with previous results. When looking at all
42 organisms in our analysis summed together (for a total of
7,115 CEs), CEs are more likely to have lengths that are a mul-
tiple of three (45% in all species examined), but over half of all
CEs have lengths that leave remainders of one (28%) or two
(27%) when divided by three.
Less has been reported about the functional impact of RIs. In
humans, many RIs have been shown to be not merely par-
tially spliced transcripts or splicing errors [31]. They were
shown to have evidence of coding potential (having higher GC
content than other introns, having codon usage more like
exons, and having a lower frequency of stop codons). Many
human RIs participate in coding for a protein domain (a
smaller fraction than for exons, but a greater fraction than for
constitutive introns) [31]. However, not all RIs in higher
eukaryotes are necessarily functional. In plants, many RIs
were shown to introduce premature termination codons or
frameshifts [12].
The prevalence of RIs in all organisms we analyzed provides
an opportunity to assess the possibility of a functional role for
these observed events. Our analysis reveals that RIs do not
display a preference for preserving reading frames: the
lengths of all 11,925 observed RIs were roughly equally dis-
tributed between intron lengths evenly divisible by three
(34%), and intron lengths with remainders of one (34%) and
Relationship between long introns and CE fractionFigure 3
Relationship between long introns and CE fraction. The percentage of long
introns (greater than 200 bp) is correlated with the CE fraction
( ). The best-fit line is y = 0.84x + 0.00 (R
2
= 0.73). In each of four
major eukaryotic groups (animals, fungi, plants and protists), species with
more long introns display a higher propensity toward CEs.
80
70
60
90
100
30
20
10
40
50
0
8060 10020 400
% Introns > 200 bp
CE
RI + CE (%)
Animals
Fungi
Plants
Protists
CE
RI CE+
Genome Biology 2008, 9:R50
Genome Biology 2008, Volume 9, Issue 3, Article R50 McGuire et al. R50.10
two (33%) when divided by three. Among the ten organisms
with greater than 500 RIs, the number evenly divisible by
three is 34 ± 2%, with a slightly higher value of 37% for D.
rerio.
Though our analysis shows little evidence of frame preserva-
tion in RIs, we do see weak selection for coding potential.
Between the closely related species of C. neoformans and
Coccidioides immitis dN/dS ratios for concatenated RIs
showed weak but significant evidence of conservation at the
amino acid level (p < 0.001 for C. neoformans and p = 0.05
for C. immitis; Table 5). We also observe significantly fewer
in-frame stop codons within RIs than in constitutive introns,
with 23% fewer (p < 0.0001) in C. immitis, and 20% fewer (p
= 0.02) in C. neoformans (Table 5). We observe no significant
functional group over-representation (Table S3 in Additional
data file 4).
We thus see some evidence for coding potential in RIs, but
taken together with previous observations of CEs, our results
suggest that the majority of observed splice variants are
unlikely to give rise to functional proteins. It has been pro-
posed that splice variants leading to frameshifts or truncated
proteins may be due in part to artifacts associated with EST
library construction or sequencing. However, the universality
of such disrupting variants across the many independent data
sets and kingdoms analyzed here - and the occurrence of such
disruptions associated with both RIs and CEs - suggest that
these events occur naturally and frequently. In humans,
plants, and fungi, transcripts containing premature stop
codons are targeted for degradation through the process of
nonsense mediated decay [32,33]. The widespread
occurrence of premature stop codons in human splice vari-
ants has led to the hypothesis that unproductive splicing and
translation may be pervasive [34]. Our results are consistent
with this hypothesis.
Retained introns are associated with weak splice sites
Studies in mammals have demonstrated that splice sites adja-
cent to CEs and RIs are associated with weak splice site sig-
Average lengths of CEs compared to average lengths of internal constitutive exonsFigure 4
Average lengths of CEs compared to average lengths of internal constitutive exons. Species are sorted by the fractional difference between these two
lengths. In organisms where CEs are common (animals and plants) CEs are almost identical in length to constitutive exons, while in species where CEs are
rare (fungi and protists) CEs tend to be significantly shorter than constitutive exons. In animals and plants, where ED is common, CEs are spliced by the
same process as constitutive exons and these two groups are thus subject to the same length constraints. In organisms that splice primarily by ID, including
fungi and protists, the lengths of constitutive exons are not constrained by ED. However, CEs in these organisms are still recognized by ED. Thus, in these
species, constitutive exons can grow longer than CEs.
Animals
Fungi
Plants
Protists
Avg. CE length
Avg. internal constitutive exon
0
50
100
150
200
250
300
350
P. falciparum
C. savignyi
S. purpuratus
B. floridae
A. mellifera
T. rubripes
O. sativa
D. rerio
C. intestinalis
C. reinhardtii
C. elegans
P. patens
P. trichocarpa
N. vectensis
A. aegypti
S. mansoni
A. gambiae
P. sojae
A. thaliana
D. melanogaster
P. infestans
A. flavus
N. crassa
T. thermophila
D. discoideum
M. grisea
U. maydis
C. neoformans
C. posadasii
S. sclerotiorum
C. immitis
H. capsulatum
P. yoelii
S. nodorum
A. nidulans
base pairs
Genome Biology 2008, Volume 9, Issue 3, Article R50 McGuire et al. R50.11
Genome Biology 2008, 9:R50
nals [28,35-40]. We evaluated RI information content in
plants, fungi and protists and report results in agreement
with previous studies.
We quantified 3' and 5' splice site strength by calculating the
information content of the splice sites (see Materials and
methods; Additional data file 2; Table S1 in Additional data
file 4). We found significantly lower information content on
either side of retained introns than constitutive introns for all
40 organisms in our analysis (P values 3.2e-9 and 2.1e-11,
respectively, calculated from t-test). Overall, RI 5' splice sites
had 1.9 ± 1.4 bits (24%) less information content, while their
3' splice sites had 0.9 ± 0.8 bits (17%) less (see data in Table
S1 in Additional data file 4 and sequence logos [41] in Addi-
tional data file 2.) We observed the largest differences
between RIs and constitutive introns in animals. The average
Average lengths of RIs compared with lengths of constitutive introns and introns adjacent to CEsFigure 5
Average lengths of RIs compared with lengths of constitutive introns and introns adjacent to CEs. RI length, which is constrained by ID, is fairly constant
across all organisms. In protists and fungi, average RI length is close to that of constitutive introns, because ID is the primary mode of splice site
recognition for both groups. In animals, constitutive intron length differs substantially from RI length because most constitutive introns are recognized by
ED and are not subject to the same length constraints as RIs, which are recognized by ID. Plants fall between unicellular organisms and animals. Data are
shown only for organisms with at least five RIs. For introns next to CEs, data are shown only for organisms with at least eight CEs with unambiguous
adjacent intron lengths on both sides. Introns next to CEs are usually longer than constitutive introns, because these introns are recognized by ED and are
free from ID length constraints.
Animals
Fungi
Plants
Protists
Avg. RI length
Avg. constitutive intron
Avg. intron next to CE
10
100
1000
10000
P. tetraurelia
R. oryzae
C. neoformans
S. nodorum
E. histolytica
A. nidulans
A. flavus
P. infestans
C. immitis
C. posadasii
S. sclerotiorum
P. sojae
M. grisea
H. capsulatum
N. crassa
P. tricornutum
T. thermophila
D. discoideum
O. lucimarinus
P. falciparum
U. maydis
P. yoelii
A. thaliana
C. elegans
C. reinhardtii
P. patens
P. trichocarpa
C. intestinalis
O. sativa
T. rubripes
C. savignyi
N. vectensis
D. melanogaster
A. gambiae
A. mellifera
B. floridae
S. purpuratus
S. mansoni
D. rerio
A. aegypti
base pairs
Table 5
dN/dS ratio and stop codon density for Ris
dN/dS ratio for RIs dN/dS for constitutive
introns
p value Stop codon density
for RIs
Stop codon density for
constitutive introns
p value
C. neoformans 0.8588 1.0008 <0.001 0.0124 0.01534 0.02
C. immitis 0.7743 0.9083 0.049 0.01153 0.01507 <0.0001
Genome Biology 2008, 9:R50
Genome Biology 2008, Volume 9, Issue 3, Article R50 McGuire et al. R50.12
differences in information content for 5' and 3' splice sites
were, respectively, 2.3 and 1.0 bits for animals, 2.1 and 0.9
bits for fungi, 1.6 and 0.8 bits for protists, and 1.4 and 0.6 bits
for plants.
While weak splice sites, such as those we observe in our RIs,
have been associated with functional RIs and CEs [28,35-40],
they are also expected to lead to greater occurrence of
incomplete splicing [18]. Therefore, weaker splice sites are
uninformative as to whether these RIs are functional or
merely incomplete splicing.
Discussion
Splice variation reveals mechanisms of splice site
recognition
The variation we observe in the CE fraction, the correspond-
ence of this variation with average intron length, and the size
constraints observed in both RIs and CEs can be
parsimoniously explained by proposing differences in the
proportion of splice junctions each organism recognizes via
ED and ID. Organisms with a high CE fraction presumably
splice predominantly via ED, whereas organisms with a low
fraction presumably have a preference for ID-mediated splic-
ing. Our results suggest that the fraction of introns recognized
by ID and ED vary extensively across kingdoms, yet both
mechanisms play a role in splicing in all phylogenetic groups.
In animals, exons are short relative to introns (Table 4) and
CEs are more common than RIs (Table 3). This pattern is con-
sistent with the hypothesis that splice junctions in animals
are primarily recognized through ED, as has been previously
demonstrated in vertebrates [19]. Moreover, the predomi-
nance of ED in these species predicts that CEs should be
approximately as long as constitutive exons, because they are
spliced the same way and, thus, are subject to the same length
constraints. This is precisely the behavior we observe (Figure
4).
In fungi and protists, conversely, introns are short relative to
exons (Table 4) and RIs far outnumber CEs. We propose that
these groups primarily recognize splice junctions using ID
(Figure 5). Because the splicing machinery in these organisms
recognizes RIs in the same way it recognizes constitutive
introns, we expect both types of intron should be subject to
the same length constraints. Supporting this hypothesis, Fig-
ure 5 shows that constitutive introns in these species are sim-
ilar in length to RIs. Intron definition has been demonstrated
experimentally in the yeasts Saccharomyces and Schizosac-
charomyces [17,27], and in plants [42]. Our analysis extends
this result to all ascomycetes, as well as basidiomycetes and
zygomycetes, and suggests that ID is not simply a character-
istic of the derived yeasts. Furthermore, due to their high
prevalence of RIs, we predict that ID predominates in the
basidiomycete C. neoformans, which possesses 5.4 introns
per gene on average, as well as the protozoan Tetrahymena
thermophila, which has 3.3 introns per gene. ID is not associ-
ated with low intron density per se.
In plants, intron lengths vary widely, and individual species
show substantial numbers of introns both greater and less
than 200 bp in length (Table 4). Correspondingly, we observe
that RIs and CEs both occur in sizeable quantities in this
group. We thus propose that ID and ED both play significant
roles in splice site recognition in plants.
While ED is most common in animals and ID dominates in
fungi and protists, nearly all species analyzed show evidence
for using both mechanisms. ID and ED have previously been
shown to operate within the same species and indeed within
the same gene [21]. We thus propose that the intron and exon
length distributions in any organism are each sums of two
distributions: one made up of shorter introns recognized by
ID and the longer exons that surround them, and one made
up of shorter exons recognized by ED and the surrounding
longer introns. When we examine the lengths of CEs, we sam-
ple from only one of these two distributions: the subset of
exons recognized by ED. When we examine the lengths of RIs,
we sample from the length distribution of introns recognized
by ID. Both these distributions are biased to be short, and this
length bias is particularly noticeable in organisms where
these splice variants are rare. Finally, when we look at the
lengths of introns surrounding CEs, we are primarily sam-
pling from the distribution of introns associated with ED.
This last distribution tends to be long (Additional data file 3),
as is the length distribution of exons surrounding RIs, which
are associated with ID. (See Additional data file 3 for more
detail on intron and exon length distributions in CEs and
RIs.)
Importantly, our model of varying levels of ID or ED splice-
site recognition explains the variation we see in CE fraction,
whether or not individual variants lead to functional mes-
sages. As shown in Figure 1a, ID mis-recognition of a single
splice site should lead to intron retention, as has been demon-
strated by splice site mutation experiments in Drosophila and
Schizosaccharomyces [17,18]. Creating a CE via ID, however,
would theoretically require coordinated mis-recognition of
two splice sites and pairing of splice sites over a greater dis-
tance. If this distance were greater than 200 bp, pairing with
ID would be considerably hindered [24]. Similarly, as experi-
mentally demonstrated and shown in Figure 1b, ED mis-rec-
ognition of a single splice site leads to a CE [19]. The
hypothetical generation of RIs under ED would require mul-
tiple mis-recognitions and pairing of splice sites belonging to
two possibly distant exons.
Thus, if many non-functional splice variants arise as a conse-
quence of incorrect or incomplete splice site recognition, we
would nonetheless expect that splice sites recognized by ID
would more commonly give rise to RIs while those recognized
by ED would more commonly give rise to CEs. Non-func-
Genome Biology 2008, Volume 9, Issue 3, Article R50 McGuire et al. R50.13
Genome Biology 2008, 9:R50
tional splice variants, therefore, are as informative as func-
tional ones when considering the question of how splice sites
are recognized. This is fortunate, as it is unclear at present
what proportion of observed splice variation is indeed func-
tionally significant. Splice variants and their characteristics,
then, provide insight into the underlying mechanisms of
splice site recognition, irrespective of whether such variants
are functional or biological errors.
Evolutionary implications of splice variation
The varying prevalence of CEs and RIs across major eukaryo-
tic groups raises evolutionary questions about modern varia-
tion in splice recognition among lineages, as well as the
nature of splice site recognition in the last common
eukaryotic ancestor. As RIs and CEs are exhibited in almost
every organism we studied, it is likely that almost all extant
eukaryotes are capable of recognizing splice sites via both ID
and ED. The last common eukaryotic ancestor, then, may also
have been capable of both types of splice site recognition.
Indeed, Collins and Penny [43] report that most of the key
components of the spliceosome were present in the last com-
mon eukaryotic ancestor. If the minimal mechanistic require-
ments to support both ID and ED were present in the last
common eukaryotic ancestor, which was more prevalent: ID
or ED? In our analysis, we note that intron density has less
effect on the types of observed splice variation than does
intron length. For example, the fungus C. neoformans recog-
nizes splice sites almost exclusively by ID, despite having
more introns per gene than many plants where ED is preva-
lent. Thus, whether the last common eukaryotic ancestor rec-
ognized splice sites predominantly via ID or ED is probably
not a question of how many introns it had but rather how long
its introns were. As very long introns appear to be a derived
feature associated with multicellularity, we may speculate
that the last eukaryotic common ancestor had introns similar
in size to most protists, and, therefore, probably employed ID
more than ED.
Evidence pertaining to the evolutionary origin of introns also
suggests a prevalence of ID in early eukaryotes. Similarities in
the splicing mechanism between self-splicing group II introns
in prokaryotes and spliceosomal eukaryotic introns suggest
that the former may have begat the latter [44-48]. As group II
introns are mobile genetic elements that spread through ret-
rotransposition, the ancestors of spliceosomal introns were
probably self-contained in terms of their signals for excision,
and would not likely have relied on splicing factors embedded
in flanking coding sequence (as may be required for ED [49]).
Therefore, the earliest spliceosomal introns may have
employed a method of splice site recognition most similar to
ID.
Recent molecular evidence suggests that SR (serine-arginine-
rich) proteins may be associated with the ascendance of ED in
animals and plants [50]. SR proteins bind to RNA sequences
and assist in spliceosome assembly for both constitutively
and alternatively spliced introns. They have been shown to
enhance the splicing efficiency of introns with suboptimal
splice signals in S. pombe [51]. Additionally, Shen and Green
[52] have recently shown that SR proteins can rescue splicing
of introns with suboptimal splice signals if those proteins are
directed to bind to exonic mRNA sequence in S. cerevisiae, a
species that has lost all native SR proteins. If the experimental
binding of SR proteins to pre-mRNA sequences is indicative
of the binding of SR proteins to exonic splicing enhancers in
organisms where ED is prevalent, the fundamental splicing
machinery of ID and ED may be closely related. Along these
lines, Ram and Ast [50] speculate that the primary role of SR
proteins has changed over time. In early eukaryotes, SR pro-
teins assist in the recognition of suboptimal ID introns, while
in higher eukaryotes, they bind to exonic splicing enhancers.
This role change shifts the placement of the basal splicing
machinery across exons instead of across introns and enables
ED using the same spliceosomal machinery employed for ID
[50].
The SR protein family has expanded in multicellular eukary-
otic lineages [53], and this proliferation may have facilitated
the widespread conversion of introns in those lineages from
ID to ED. However, it is unclear what underlying neutral or
selective forces could be responsible for this shift. Changes in
genome size may have played a role. Multicellular eukaryotes
generally exhibit larger genomes than unicellular eukaryotes,
and organisms with large genomes tend to have long introns
[54,55]. Because ID is only effective for introns less than
approximately 250 bp [24], an upward trend in genome size
in multicellular lineages (resulting from a reduced deletion
rate, increased transposon activity, or both) could have
favored ED introns that were spliceable in the face of this
mutational pressure.
Regardless of which evolutionary forces are responsible for
their ascendance, CEs produced through exon definition in
multicellular eukaryotes allow for much greater flexibility
and combinatorial complexity of alternatively spliced tran-
scripts than would RIs recognized by ID. For example, the
large number of transcripts (>30,000) that can be produced
by the Dscam gene in D. melanogaster is facilitated by
independent splicing of CEs [56]. The abundance of CEs ena-
bled by ED in the human proteome may help to explain why
the human genome contains only about as many genes as that
of the worm or fly, despite the (admittedly biased) perception
of our own much greater organismal complexity [57].
Conclusion
Using EST and cDNA data from 42 organisms, we find the
prevalence of RIs and CEs to vary significantly across major
eukaryotic groups, strongly suggesting that the underlying
mode of splice site recognition (ID versus ED) also varies in
prevalence across eukaryotes. Our results show that RIs,
which are present in every organism we analyzed, are more
Genome Biology 2008, 9:R50
Genome Biology 2008, Volume 9, Issue 3, Article R50 McGuire et al. R50.14
widespread than previously thought. We also find a strong
relationship between intron length and the prevalence of
splice variation: the fraction of introns greater than 200 bp is
correlated with the CE fraction. Shorter introns (<200 bp),
such as those found in fungi and protists, are more likely to be
recognized by ID. In all 23 fungi and protists that we exam-
ined, we observed that RIs are more common than CEs. In
contrast, shorter exons surrounded by longer introns (>200-
250 bp), such as those found in animals, are more likely to be
recognized by ED. In the 13 multicellular animals in our anal-
ysis, CEs occur much more frequently, sometimes in greater
numbers than RIs. The six plants in our analysis exhibited
intermediate intron lengths, having more CEs than fungi and
more RIs than animals.
We conclude that ID and ED are likely both present to some
degree in all eukaryotes. We conclude that splicing proceeds
primarily by ID in fungi and unicellular protists, due to the
overwhelming majority of RIs and paucity of CEs observed in
these organisms, as well as their short intron lengths and
longer exon lengths. In contrast, splice sites in multicellular
animals are recognized primarily via ED, due to the larger
numbers of CEs observed, as well as these species' longer
introns and shorter exons. However, the molecular mecha-
nisms underlying the two different forms of recognition (ED
and ID) are still unclear.
These findings help to reveal the complex interplay of selec-
tive constraints and mutational pressures underlying eukary-
otic genome architecture, and improve our understanding of
why eukaryotic genomes exhibit so much variation. Further
sequencing of additional organisms, especially those that
exhibit both unicellular and multicellular properties, will help
to disentangle the effects of multicellularity, genome size, and
intron length on the mechanisms of splice site recognition.
Materials and methods
EST alignments
All EST and assembly data were publicly available and down-
loaded from the Broad Institute [58], GenBank, J Craig Ven-
ter Institute/The Institute for Genomic Research [59], Joint
Genome Institute [60] or VectorBase [61] (Tables 1 and 2).
We used BLAT [62] version 33 to align the ESTs to genomic
sequence using the following parameters: minIdentity = 95
minScore = 50 queryType = rna. We set the maxIntron
parameter to the longest annotated intron in each species.
We filtered the resulting alignments using the following crite-
ria: each alignment must contain at least one canonical splice
site (GT:AG, CG:AG, AT:AC); must have no non-canonical
splice sites; must have ≥ 95% nucleotide identity; must not
have more than nine consecutive insertions; and must not
have more than nine consecutive deletions outside of an
intron. We also required three or more exact matches at every
intron-exon boundary [12]. If a single EST aligned to more
than one location on the genome, we only considered the
alignment with the highest score. To guard against redundant
input data, if multiple alignments in the same locus had the
same sequence after trimming, we disregarded all but one of
them.
We discarded all unspliced alignments to prevent labeling
pre-spliced transcripts as splice variants. Unspliced ESTs
show no evidence of having been processed by the spliceo-
some, and may represent pre-spliced transcript fragments. It
is difficult to distinguish between an unspliced EST that has
been processed and an unspliced EST that has not, and thus
we cannot report how many processed ESTs we discarded.
However, if most unspliced ESTs have already been proc-
essed by the spliceosome, we would expect to find more of
them in organisms with very few introns and/or very long
exons. We found no such correlation in either case (Addi-
tional data file 5). We conclude that a substantial fraction of
the unspliced ESTs represent pre-spliced ESTs, and, there-
fore, that unspliced ESTs are not a reliable indicator of splice
variation.
The number of RIs changed substantially depending on
whether we included or excluded unspliced ESTs, while the
numbers of CEs and competing 3' and 5' splice sites changed
very little. We believe that previous reports that do not
exclude unspliced ESTs overestimate the frequency of intron
retention.
After aligning the ESTs and filtering them, we built tran-
scripts and transcript fragments using CallReferenceGenes,
an unpublished tool used in the Broad Institute's genome
annotation pipeline since 2005. Several previous papers pro-
vide an in-depth discussion of the problem [12,63]. We briefly
sketch our algorithm here. The source code for CallReference-
Genes, as well as the code that labels alternative splice forms,
is included in Additional data file 6.
First, we partition the alignments into clusters, so that every
alignment has exon-exon overlap with at least one other
alignment in the cluster, and no alignment has exon-exon
overlap with any alignment outside its cluster. Alignments
that overlap no other alignments are ignored.
Next, for each cluster, we compare every alignment to every
other alignment that overlaps it. (Here, as opposed to the pre-
vious step, we also consider exon-intron overlaps.) Relation-
ships are directional, and are given one of three labels:
'conflicts', 'extended-by', or 'includes'. Two alignments con-
flict if any base in the region of overlap is exonic in one align-
ment and intronic in the other. If they do not conflict, one
alignment extends another if it ends after the other and does
not begin before it. Lastly, one alignment includes another if
it does not conflict with it, starts before it, and ends after it.
Genome Biology 2008, Volume 9, Issue 3, Article R50 McGuire et al. R50.15
Genome Biology 2008, 9:R50
At this stage the cluster is represented by a graph of nodes
(representing alignments) and labeled edges (representing
their relationships). To turn this into a more tree-like repre-
sentation that is easier to traverse, we build an ordered list of
alignments. We sort them by 3' coordinate, in ascending
order. In the case where we have two alignments with identi-
cal 3' coordinates, we sort by 5' coordinate, again in ascending
order. In this way, no alignment is extended by any element
that sorts before it. An alignment usually, though not always,
sorts after the alignments it includes.
To improve performance, we prune redundant relationships
from the graph. We apply a series of heuristics to reduce the
number of paths from an alignment to its descendants. These
'trimming rules' include: first, if A is extended by B, and C
extends both A and B, and there is no element D such that B
conflicts with D and C does not, then any path containing A
and B will also contain C. The extended-by relationship from
A to C is therefore redundant. Second, if A is included by B,
and there is no element D such that B conflicts with D and A
does not, then any path containing A will also include B. All
extended-by relationships terminating in A are redundant.
Third, if A is extended by B and both are included by C, and
every element D that conflicts with C also conflicts with either
A or B, then any path containing both A and B will also con-
tain C. Thus, the extended-by relationship from A to B is
redundant.
We traverse the list bottom-up so that every element is
pruned before any element it extends. There will be multiple
paths from a parent to a given child if a splice variation lies
between them. If no splice variation occurs between them,
generally, there will be one path, but the above rules are not
exhaustive and some duplicate paths may remain after prun-
ing. As we traverse the list and prune it, we track, per align-
ment, all alignments that can be reached through it (for
example, all its extenders and includees, as well as their
extenders and includees, and so on). We call these sets of
alignments the 'descendants' of each alignment. (Note that
pruning never reduces the membership of these sets, only the
number of edges between them.)
After ordering and pruning, we can traverse the list of align-
ments left-to-right, following 'extended-by' and 'includes'
links to build paths linking splice-compatible alignments. To
do this, we do the following. First, find starts - a start is any
element that extends no other element and has at least one
descendant that cannot be reached through any previously
discovered start. Second, walk the tree - treating each start, in
turn, as a root of a subtree, traverse extension and inclusion
links as edges in a graph; each unique path represents (a frag-
ment of) a transcript. Third, remove sub-paths - if all the
alignments in one path are present in another, we discard the
one containing fewer alignments. Fourth, overlapping paths
with distinct alignments represent splice variants of the same
gene.
Given two overlapping transcripts A and B, all bases in the
region of overlap will be in one of four states: I, A and B are
exonic; II, A is exonic; III, B is exonic; IV, neither is exonic.
We group all adjacent states into a column with a single label,
then use a sliding-window approach, across three such col-
umns, to compare overlapping transcripts. CEs, RIs, and
competing 5' and 3' splice sites all have a different signature
appearance. CEs appear as IV:II:IV and IV:III:IV; RIs appear
as I:II:I and I:III:I; competing 5' and 3' splice sites appear as
I:II:IV, I:III:IV, IV:II:I, and IV:III:I.
We filter the set of splice variants by requiring that every base
in the variant region be exonic in at least one alignment and
intronic in at least one alignment. Because EST data are frag-
mentary we cannot be sure that initial or terminal exons are
complete. To ensure accurate labeling as well as reliable
length statistics, we require that any exon in the alternatively
spliced region not be an initial or terminal exon. Finally, we
require that every alignment spanning the region conform to
either the major or minor variant. The reported length of each
splice variant is simply the width of the center column in the
windows described above.
We also generated a list of constitutive introns and exons as a
control. These are introns and exons predicted from loci
where no ESTs conflict. Furthermore, every base within these
constitutive elements must have ten or more ESTs supporting
it. Note that there is no way to tell for sure that any exon or
intron never exhibits splice variation; this method simply
identifies loci where splice variation has never been seen, and
if present, is presumably rare.
Testing retained introns for evidence of selection at the
codon level
We used a comparative approach to test retained introns for
purifying selection at the codon level using two groups of
fungi, where genome sequences at suitable evolutionary dis-
tances were available. We examined all four sequenced sero-
types of C. neoformans (JEC21, H99, R265 and WM276) in
one group, while the second group consisted of C. immitis and
the C735 strain of Coccidioides posadasii. Orthology of genes
was determined using a reciprocal-best-BLAST criterion,
while the alignment of orthologs was performed using Clus-
talW [64]. Alignments of retained orthologous introns were
concatenated to enhance power for detecting selection. Prior
to concatenation, splice donor and acceptor sites were
removed, and the 5' and 3' ends of each intron alignment were
padded with gaps in order to preserve the native reading
frames of introns. We used a 100 bp cutoff for retained
introns in C. neoformans and 150 bp in C. immitis. Since 95%
of the introns we identified in each organism were less than
these cutoffs, we used a cutoff to eliminate unusually long
introns. We analyzed 477 and 389 orthologous intron align-
ments in C. neoformans and C. immitis, respectively. The
dN/dS ratio of concatenated intron alignments was calcu-
lated using the codeml program (model M0) in the PAML 3.15
Genome Biology 2008, 9:R50
Genome Biology 2008, Volume 9, Issue 3, Article R50 McGuire et al. R50.16
software package [65]. The probability that the resulting dN/
dS ratios were significantly less than one, indicating purifying
selection at the codon level, was calculated using a bootstrap-
ping approach with a set of control introns. We identified 672
and 662 control introns in C. neoformans and C. immitis,
respectively. We randomly resampled, with replacement,
from the control introns to create 1,000 concatenated control
alignments approximately equal in length to the concate-
nated retained intron alignments in each taxonomic group.
Then, we used codeml to calculate the dN/dS ratio exhibited
by each resampled control alignment to determine the prob-
ability of observing dN/dS ratios as low as or lower than those
exhibited by the retained introns in each taxonomic group,
under a null hypothesis that they are non-coding.
Abbreviations
CE, cassette exon; ED, exon definition; EST, expressed
sequence tag; ID, intron definition; RI, retained intron; SR,
serine-arginine-rich.
Authors' contributions
AMM and MDP contributed equally. MDP wrote the EST
alignment software and contributed to writing the paper.
AMM performed the analysis and drafted and finalized the
manuscript. DEN performed the dN/dS and stop codon den-
sity analyses, and contributed to writing the paper. JEG initi-
ated and supervised the study, and revised the manuscript.
Additional data files
The following additional data are available with the online
version of this paper. Additional data file 1 is a figure showing
the frequencies of different forms of splice variation. Addi-
tional file 2 is a figure showing sequence logos for splice sites
for both RIs and controls. Additional data file 3 shows intron
and exon length distributions for six example organisms.
Additional data file 4 contains supplementary tables detailing
the differences in information content between RIs and con-
trols (Table S1), intron and exon lengths from annotations
(Table S2), and details of our analysis of functional group
enrichment of RIs (Table S3). Additional data file 5 is a
spreadsheet containing a comparison of alternative splicing
events for the situations where unspliced ESTs are included
as well as discarded. This spreadsheet also includes data for a
higher-confidence dataset requiring a greater number of
ESTs supporting each predicted alternative splicing event.
Additional data file 6 contains computer source codes for the
CallReferenceGenes program, as well as the code that labels
alternative splice forms. These codes can be inspected but will
not be functional without the rest of the Broad Institute's Cal-
houn environment.
Additional data file 1Frequencies of different forms of splice variationThe data for H. sapiens were taken from a previous study [8].Click here for fileAdditional data file 2Details of splice site strength analysis(a) Sequence logos [41] for 3' splice sites of RIs and control introns. (b) Sequence logos [41] for 5' splice sites of RIs and control introns. For 5' splice sites, we show sequence logos for six intronic and three exonic bases. For 3' splice sites, we show sequence logos for three intronic and one exonic bases.Click here for fileAdditional data file 3Intron and exon length distributionsSix example organisms with large numbers of splice variants were chosen and their normalized intron and exon length distributions are plotted here. (a) CE distributions are shifted towards shorter lengths than the control exon length distribution, because of con-straints on exon length imposed by ED. (b) The peak at short intron lengths is very similar in RIs and constitutive introns, because this short intron peak is primarily made up of introns rec-ognized by ID. In contrast, almost no introns surrounding CEs have lengths close to this 'intron-definition peak' - almost all of them are spread out over a wide range of longer intron lengths, and have low values in the area of the short intron-length ID peak shown here (0-200 bp).Click here for fileAdditional data file 4Supplementary Tables S1-S3Table S1: differences in information content between RIs and con-trols. Table S2: intron and exon lengths from annotations. Table S3: details of our analysis of functional group enrichment of RIs.Click here for fileAdditional data file 5Summary of data including unspliced ESTsA comparison of alternative splicing events for the situations where unspliced ESTs are included as well as discarded. We also include data for a higher-confidence dataset requiring a greater number of ESTs supporting each predicted alternative splicing event.Click here for fileAdditional data file 6Computer source codesWe include the source code for the CallReferenceGenes program, as well as the code which labels alternative splice forms. These codes can be inspected but will not be functional without the rest of the Broad Institute's Calhoun environment. These are included as Unix tar files.Click here for file
Acknowledgements
Preliminary sequence data for S. mansoni and H. capsulatum were obtained
from the website of The Institute for Genomic Research/The J Craig Venter
Institute. Sequencing of S. mansoni is supported by award from the National
Institute of Allergy and Infectious Diseases, National Institutes of Health.
The genome sequencing of H. capsulatum was supported by the National
Institute of Allergy and Infectious Diseases (NIAID). The sequence data for
B. floridae, C. reinhardtii, P. tricornutum, and P. patens were produced by the
US Department of Energy Joint Genome Institute. The sequences of C.
savignyi, C. immitis, H. capsulatum, P. infestans, R. oryzae, S. sclerotiorum, and
S. nodorum were produced by the Broad Institute; EST data for C. posadasii
not generated at JCVI and ESTs from C. immitis were produced by the Coc-
cidioides Genome Resources Consortium (CGRC) as part of the Broad's
Comparative Coccidioides Genome Project. EST data for S. sclerotiorum were
produced by the Broad Institute (Christina Cuomo) as part of a grant with
Christina Cuomo, Marty Dickman, Jeffrey Rollins, and Linda Kohn. S. sclero-
tiorum EST libraries were constructed by Jeffrey Rollins, Dave Edwards,
Adrienne Sexton, and Barbara Howlett. The sequence data for D. rerio were
produced by the D. rerio Sequencing Group at the Sanger Institute. We
would like to thank Michael Koehrsen and his engineering team for their
development of the Calhoun bioinformatics platform, without which this
large-scale analysis would have been impossible. We would also like to
thank the anonymous reviewers, who made many helpful suggestions to
improve this paper. This research was funded by an NSF grant for Compar-
ative Fungal Genomics (MCB-0450812), and an NIAID Contract for Micro-
bial Genome Centers (HHSN26620040001C).
References
1. Roy SW, Gilbert W: The evolution of spliceosomal introns: pat-
terns, puzzles and progress. Nat Rev Genet 2006, 7:211-221.
2. Jeffares DC, Mourier T, Penny D: The biology of intron gain and
loss. Trends Genet 2006, 22:16-22.
3. Hirschman JE, Balakrishnan R, Christie KR, Costanzo MC, Dwight SS,
Engel SR, Fisk DG, Hong EL, Livstone MS, Nash R, Park J, Oughtred
R, Skrzypek M, Starr B, Theesfeld CL, Williams J, Andrada R, Binkley
G, Dong Q, Lane C, Miyasato S, Sethuraman A, Schroeder M, Thana-
wala MK, Weng S, Dolinski K, Botstein D, Cherry JM: Genome
Snapshot: a new resource at the Saccharomyces Genome
Database (SGD) presenting an overview of the Saccharomy-
ces cerevisiae genome. Nucleic Acids Res 2006:D442-D445.
4. Loftus B, Anderson I, Davies R, Alsmark UC, Samuelson J, Amedeo P,
Roncaglia P, Berriman M, Hirt RP, Mann BJ, Nozaki T, Suh B, Pop M,
Duchene M, Ackers J, Tannich E, Leippe M, Hofer M, Bruchhaus I,
Willhoeft U, Bhattacharya A, Chillingworth T, Churcher C, Hance Z,
Harris B, Harris D, Jagels K, Moule S, Mungall K, Ormond D, et al.:
The genome of the protist parasite Entamoeba histolytica.
Nature 2005, 433:865-868.
5. Blencowe BJ: Alternative splicing: new insights from global
analyses. Cell 2006, 126:37-47.
6. Matlin AJ, Clark F, Smith CW: Understanding alternative splic-
ing: towards a cellular code. Nat Rev Mol Cell Biol 2005,
6:386-398.
7. Kwan T, Benovoy D, Dias C, Gurd S, Serre D, Zuzan H, Clark TA,
Schweitzer A, Staples MK, Wang H, Blume JE, Hudson TJ, Sladek R,
Majewski J: Heritability of alternative splicing in the human
genome. Genome Res 2007, 17:1210-1218.
8. Sugnet CW, Kent WJ, Ares M Jr, Haussler D: Transcriptome and
genome conservation of alternative splicing events in
humans and mice. Pac Symp Biocomput 2004:66-77.
9. Ast G: How did alternative splicing evolve? Nat Rev Genet 2004,
5:773-782.
10. Thanaraj TA, Stamm S, Clark F, Riethoven JJ, Le Texier V, Muilu J:
ASD: the Alternative Splicing Database. Nucleic Acids Res
2004:D64-D69.
11. Ner-Gaon H, Halachmi R, Savaldi-Goldstein S, Rubin E, Ophir R, Fluhr
R: Intron retention is a major phenomenon in alternative
splicing in Arabidopsis. Plant J 2004, 39:877-885.
12. Campbell MA, Haas BJ, Hamilton JP, Mount SM, Buell CR: Compre-
hensive analysis of alternative splicing in rice and compara-
tive analyses with Arabidopsis. BMC Genomics 2006, 7:327.
13. Wang BB, Brendel V: Genomewide comparative analysis of
alternative splicing in plants. Proc Natl Acad Sci USA 2006,
103:7175-7180.
14. Kupfer DM, Drabenstot SD, Buchanan KL, Lai H, Zhu H, Dyer DW,
Roe BA, Murphy JW: Introns and splicing elements of five
Genome Biology 2008, Volume 9, Issue 3, Article R50 McGuire et al. R50.17
Genome Biology 2008, 9:R50
diverse fungi. Eukaryot Cell 2004, 3:1088-1100.
15. Loftus BJ, Fung E, Roncaglia P, Rowley D, Amedeo P, Bruno D,
Vamathevan J, Miranda M, Anderson IJ, Fraser JA, Allen JE, Bosdet IE,
Brent MR, Chiu R, Doering TL, Donlin MJ, D'Souza CA, Fox DS, Grin-
berg V, Fu J, Fukushima M, Haas BJ, Huang JC, Janbon G, Jones SJ, Koo
HL, Krzywinski MI, Kwon-Chung JK, Lengeler KB, Maiti R, et al.: The
genome of the basidiomycetous yeast and human pathogen
Cryptococcus neoformans. Science 2005, 307:1321-1324.
16. Collins L, Penny D: Proceedings of the SMBE Tri-National
Young Investigators' Workshop 2005. Investigating the
intron recognition mechanism in eukaryotes. Mol Biol Evol
2006, 23:901-910.
17. Romfo CM, Alvarez CJ, van Heeckeren WJ, Webb CJ, Wise JA: Evi-
dence for splice site pairing via intron definition in Schizosac-
charomyces pombe. Mol Cell Biol 2000, 20:7955-7970.
18. Talerico M, Berget SM: Intron definition in splicing of small Dro-
sophila introns. Mol Cell Biol 1994, 14:3434-3445.
19. Talerico M, Berget SM: Effect of 5' splice site mutations on splic-
ing of the preceding intron. Mol Cell Biol 1990, 10:6299-6305.
20. Berget SM: Exon recognition in vertebrate splicing. J Biol Chem
1995, 270:2411-2414.
21. Kennedy CF, Kramer A, Berget SM: A role for SRp54 during
intron bridging of small introns with pyrimidine tracts
upstream of the branch point. Mol Cell Biol 1998, 18:5425-5434.
22. Robberson BL, Cote GJ, Berget SM: Exon definition may facilitate
splice site selection in RNAs with multiple exons. Mol Cell Biol
1990, 10:84-94.
23. Lim LP, Burge CB: A computational analysis of sequence fea-
tures involved in recognition of short introns. Proc Natl Acad
Sci USA 2001, 98:11193-11198.
24. Fox-Walsh KL, Dou Y, Lam BJ, Hung SP, Baldi PF, Hertel KJ: The
architecture of pre-mRNAs affects mechanisms of splice-site
pairing. Proc Natl Acad Sci USA 2005, 102:16176-16181.
25. Locations of predicted sites of splice variation [http://
www.broad.mit.edu/ftp/pub/seq/msc/pub/altsplice_data.tar.gz]
26. Zavolan M, Kondo S, Schonbach C, Adachi J, Hume DA, Hayashizaki
Y, Gaasterland T: Impact of alternative initiation, splicing, and
termination on the diversity of the mRNA transcripts
encoded by the mouse transcriptome. Genome Res 2003,
13:1290-1300.
27. Howe KJ, Ares M Jr: Intron self-complementarity enforces
exon inclusion in a yeast pre-mRNA. Proc Natl Acad Sci USA
1997, 94:12467-12472.
28. Stamm S, Zhu J, Nakai K, Stoilov P, Stoss O, Zhang MQ: An alterna-
tive-exon database and its statistical analysis. DNA Cell Biol
2000, 19:739-756.
29. Sorek R, Shamir R, Ast G: How prevalent is functional alterna-
tive splicing in the human genome? Trends Genet 2004,
20:68-71.
30. Tress ML, Martelli PL, Frankish A, Reeves GA, Wesselink JJ, Yeats C,
Olason PL, Albrecht M, Hegyi H, Giorgetti A, Raimondo D, Lagarde
J, Laskowski RA, López G, Sadowski MI, Watson JD, Fariselli P, Rossi
I, Nagy A, Kai W, Størling Z, Orsini M, Assenov Y, Blankenburg H,
Huthmacher C, Ramírez F, Schlicker A, Denoeud F, Jones P, Kerrien
S, et al.: The implications of alternative splicing in the
ENCODE protein complement. Proc Natl Acad Sci USA 2007,
104:5495-5500.
31. Galante PA, Sakabe NJ, Kirschbaum-Slager N, de Souza SJ: Detection
and evaluation of intron retention events in the human
transcriptome. Rna 2004, 10:757-765.
32. Neu-Yilik G, Gehring NH, Hentze MW, Kulozik AE: Nonsense-
mediated mRNA decay: from vacuum cleaner to Swiss army
knife. Genome Biol
2004, 5:218.
33. Chang YF, Imam JS, Wilkinson MF: The nonsense-mediated decay
RNA surveillance pathway. Annu Rev Biochem 2007, 76:51-74.
34. Lewis BP, Green RE, Brenner SE: Evidence for the widespread
coupling of alternative splicing and nonsense-mediated
mRNA decay in humans. Proc Natl Acad Sci USA 2003,
100:189-192.
35. Sakabe NJ, de Souza SJ: Sequence features responsible for
intron retention in human. BMC Genomics 2007, 8:59.
36. D'Souza I, Schellenberg GD: tau Exon 10 expression involves a
bipartite intron 10 regulatory sequence and weak 5' and 3'
splice sites. J Biol Chem 2002, 277:26587-26599.
37. Dye BT, Buvoli M, Mayer SA, Lin CH, Patton JG: Enhancer ele-
ments activate the weak 3' splice site of alpha-tropomyosin
exon 2. Rna 1998, 4:1523-1536.
38. Lavigueur A, La Branche H, Kornblihtt AR, Chabot B: A splicing
enhancer in the human fibronectin alternate ED1 exon inter-
acts with SR proteins and stimulates U2 snRNP binding.
Genes Dev 1993, 7:2405-2417.
39. Clark F, Thanaraj TA: Categorization and characterization of
transcript-confirmed constitutively and alternatively spliced
introns and exons from human. Hum Mol Genet 2002,
11:451-464.
40. Garg K, Green P: Differing patterns of selection in alternative
and constitutive splice sites. Genome Res 2007, 17:1015-1022.
41. Schneider TD, Stephens RM: Sequence logos: a new way to dis-
play consensus sequences. Nucleic Acids Res 1990, 18:6097-6100.
42. McCullough AJ, Baynton CE, Schuler MA: Interactions across
exons can influence splice site recognition in plant nuclei.
Plant Cell 1996, 8:2295-2307.
43. Collins L, Penny D: Complex spliceosomal organization ances-
tral to extant eukaryotes. Mol Biol Evol 2005, 22:1053-1066.
44. Cech TR:
The generality of self-splicing RNA: relationship to
nuclear mRNA splicing. Cell 1986, 44:207-210.
45. Rogers JH: How were introns inserted into nuclear genes?
Trends Genet 1989, 5:213-216.
46. Sharp PA: "Five easy pieces". Science 1991, 254:663.
47. Cavalier-Smith T: Intron phylogeny: a new hypothesis. Trends
Genet 1991, 7:145-148.
48. Stoltzfus A: On the possibility of constructive neutral
evolution. J Mol Evol 1999, 49:169-181.
49. Blencowe BJ: Exonic splicing enhancers: mechanism of action,
diversity and role in human genetic diseases. Trends Biochem
Sci 2000, 25:106-110.
50. Ram O, Ast G: SR proteins: a foot on the exon before the tran-
sition from intron to exon definition. Trends Genet 2007, 23:5-7.
51. Webb CJ, Romfo CM, van Heeckeren WJ, Wise JA: Exonic splicing
enhancers in fission yeast: functional conservation demon-
strates an early evolutionary origin. Genes Dev 2005,
19:242-254.
52. Shen H, Green MR: RS domains contact splicing signals and
promote splicing by a common mechanism in yeast through
humans. Genes Dev 2006, 20:1755-1765.
53. Barbosa-Morais NL, Carmo-Fonseca M, Aparicio S: Systematic
genome-wide annotation of spliceosomal proteins reveals
differential gene family expansion. Genome Res 2006, 16:66-77.
54. Vinogradov AE: Intron-genome size relationship on a large
evolutionary scale. J Mol Evol 1999, 49:376-384.
55. Petrov DA: Mutational equilibrium model of genome size
evolution.
Theor Popul Biol 2002, 61:531-544.
56. Schmucker D, Clemens JC, Shu H, Worby CA, Xiao J, Muda M, Dixon
JE, Zipursky SL: Drosophila Dscam is an axon guidance recep-
tor exhibiting extraordinary molecular diversity. Cell 2000,
101:671-684.
57. Lander ES, Linton LM, Birren B, Nusbaum C, Zody MC, Baldwin J,
Devon K, Dewar K, Doyle M, FitzHugh W, Funke R, Gage D, Harris
K, Heaford A, Howland J, Kann L, Lehoczky J, LeVine R, McEwan P,
McKernan K, Meldrim J, Mesirov JP, Miranda C, Morris W, Naylor J,
Raymond C, Rosetti M, Santos R, Sheridan A, Sougnez C, et al.: Initial
sequencing and analysis of the human genome. Nature 2001,
409:860-921.
58. The Broad Institute of Harvard and MIT [http://
www.broad.mit.edu]
59. The Institute for Genomic Research: The J Craig Venter
Institute [ />60. US Department of Energy Joint Genome Institute [http://
www.jgi.doe.gov/]
61. Vectorbase []
62. Kent WJ: BLAT - the BLAST-like alignment tool. Genome Res
2002, 12:656-664.
63. Eyras E, Caccamo M, Curwen V, Clamp M: ESTGenes: alternative
splicing from ESTs in Ensembl. Genome Res 2004, 14:976-987.
64. Thompson JD, Higgins DG, Gibson TJ: CLUSTAL W: improving
the sensitivity of progressive multiple sequence alignment
through sequence weighting, position-specific gap penalties
and weight matrix choice. Nucleic Acids Res 1994, 22:4673-4680.
65. Yang Z: PAML: a program package for phylogenetic analysis
by maximum likelihood. Comput Appl Biosci 1997, 13:555-556.
66. Danio rerio Sequencing Group at the Sanger Institute [http:/
/www.sanger.ac.uk/Projects/D_rerio/]
67. Aparicio S, Chapman J, Stupka E, Putnam N, Chia JM, Dehal P, Christ-
offels A, Rash S, Hoon S, Smit A, Gelpke MD, Roach J, Oh T, Ho IY,
Wong M, Detter C, Verhoef F, Predki P, Tay A, Lucas S, Richardson
P, Smith SF, Clark MS, Edwards YJ, Doggett N, Zharkikh A, Tavtigian
Genome Biology 2008, 9:R50
Genome Biology 2008, Volume 9, Issue 3, Article R50 McGuire et al. R50.18
SV, Pruss D, Barnstead M, Evans C, et al.: Whole-genome shotgun
assembly and analysis of the genome of Fugu rubripes. Science
2002, 297:1301-1310.
68. Dehal P, Satou Y, Campbell RK, Chapman J, Degnan B, De Tomaso A,
Davidson B, Di Gregorio A, Gelpke M, Goodstein DM, Harafuji N,
Hastings KE, Ho I, Hotta K, Huang W, Kawashima T, Lemaire P, Mar-
tinez D, Meinertzhagen IA, Necula S, Nonaka M, Putnam N, Rash S,
Saiga H, Satake M, Terry A, Yamada L, Wang HG, Awazu S, Azumi K,
et al.: The draft genome of Ciona intestinalis: insights into
chordate and vertebrate origins. Science 2002, 298:2157-2167.
69. Putnam NH, Srivastava M, Hellsten U, Dirks B, Chapman J, Salamov
A, Terry A, Shapiro H, Lindquist E, Kapitonov VV, Jurka J, Genikhov-
ich G, Grigoriev IV, Lucas SM, Steele RE, Finnerty JR, Technau U, Mar-
tindale MQ, Rokhsar DS: Sea anemone genome reveals
ancestral eumetazoan gene repertoire and genomic
organization. Science 2007, 317:86-94.
70. Sea Urchin Genome Sequencing Consortium, Sodergren E, Wein-
stock GM, Davidson EH, Cameron RA, Gibbs RA, Angerer RC,
Angerer LM, Arnone MI, Burgess DR, Burke RD, Coffman JA, Dean
M, Elphick MR, Ettensohn CA, Foltz KR, Hamdoun A, Hynes RO,
Klein WH, Marzluff W, McClay DR, Morris RL, Mushegian A, Rast JP,
Smith LC, Thorndyke MC, Vacquier VD, Wessel GM, Wray G, Zhang
L, et al.: The genome of the sea urchin Strongylocentrotus
purpuratus. Science 2006, 314:941-952.
71. Adams MD, Celniker SE, Holt RA, Evans CA, Gocayne JD, Amanati-
des PG, Scherer SE, Li PW, Hoskins RA, Galle RF, George RA, Lewis
SE, Richards S, Ashburner M, Henderson SN, Sutton GG, Wortman
JR, Yandell MD, Zhang Q, Chen LX, Brandon RC, Rogers YH, Blazej
RG, Champe M, Pfeiffer BD, Wan KH, Doyle C, Baxter EG, Helt G,
Nelson CR, et al.: The genome sequence of Drosophila
melanogaster. Science 2000, 287:2185-2195.
72. Nene V, Wortman JR, Lawson D, Haas B, Kodira C, Tu ZJ, Loftus B,
Xi Z, Megy K, Grabherr M, Ren Q, Zdobnov EM, Lobo NF, Campbell
KS, Brown SE, Bonaldo MF, Zhu J, Sinkins SP, Hogenkamp DG,
Amedeo P, Arensburger P, Atkinson PW, Bidwell S, Biedler J, Birney
E, Bruggner RV, Costas J, Coy MR, Crabtree J, Crawford M,
et al.:
Genome sequence of Aedes aegypti, a major arbovirus
vector. Science 2007, 316:1718-1723.
73. Lawson D, Arensburger P, Atkinson P, Besansky NJ, Bruggner RV,
Butler R, Campbell KS, Christophides GK, Christley S, Dialynas E,
Emmert D, Hammond M, Hill CA, Kennedy RC, Lobo NF, MacCallum
MR, Madey G, Megy K, Redmond S, Russo S, Severson DW, Stinson
EO, Topalis P, Zdobnov EM, Birney E, Gelbart WM, Kafatos FC, Louis
C, Collins FH: VectorBase: a home for invertebrate vectors of
human pathogens. Nucleic Acids Res 2007:D503-D505.
74. Holt RA, Subramanian GM, Halpern A, Sutton GG, Charlab R, Nussk-
ern DR, Wincker P, Clark AG, Ribeiro JM, Wides R, Salzberg SL, Lof-
tus B, Yandell M, Majoros WH, Rusch DB, Lai Z, Kraft CL, Abril JF,
Anthouard V, Arensburger P, Atkinson PW, Baden H, de Berardinis
V, Baldwin D, Benes V, Biedler J, Blass C, Bolanos R, Boscus D, Barn-
stead M, et al.: The genome sequence of the malaria mosquito
Anopheles gambiae. Science 2002, 298:129-149.
75. Honeybee Genome Sequencing Consortium: Insights into social
insects from the genome of the honeybee Apis mellifera.
Nature 2006, 443:931-949.
76. C. elegans, Sequencing Consortium: Genome sequence of the
nematode C. elegans: a platform for investigating biology.
Science 1998, 282:2012-2018.
77. Kämper J, Kahmann R, Bölker M, Ma LJ, Brefort T, Saville BJ, Banuett
F, Kronstad JW, Gold SE, Müller O, Perlin MH, Wösten HA, de Vries
R, Ruiz-Herrera J, Reynaga-Peña CG, Snetselaar K, McCann M, Pérez-
Martín J, Feldbrügge M, Basse CW, Steinberg G, Ibeas JI, Holloman W,
Guzman P, Farman M, Stajich JE, Sentandreu R, González-Prieto JM,
Kennell JC, Molina L, et al.: Insights from the genome of the bio-
trophic fungal plant pathogen Ustilago maydis. Nature 2006,
444:97-101.
78. Wood V, Gwilliam R, Rajandream MA, Lyne M, Lyne R, Stewart A,
Sgouros J, Peat N, Hayles J, Baker S, Basham D, Bowman S, Brooks K,
Brown D, Brown S, Chillingworth T, Churcher C, Collins M, Connor
R, Cronin A, Davis P, Feltwell T, Fraser A, Gentles S, Goble A, Hamlin
N, Harris D, Hidalgo J, Hodgson G, Holroyd S, et al.: The genome
sequence of Schizosaccharomyces pombe.
Nature 2002,
415:871-880.
79. Goffeau A, Barrell BG, Bussey H, Davis RW, Dujon B, Feldmann H,
Galibert F, Hoheisel JD, Jacq C, Johnston M, Louis EJ, Mewes HW,
Murakami Y, Philippsen P, Tettelin H, Oliver SG: Life with 6000
genes. Science 1996, 274:563-547.
80. Galagan JE, Calvo SE, Borkovich KA, Selker EU, Read ND, Jaffe D, Fit-
zHugh W, Ma LJ, Smirnov S, Purcell S, Rehman B, Elkins T, Engels R,
Wang S, Nielsen CB, Butler J, Endrizzi M, Qui D, Ianakiev P, Bell-Ped-
ersen D, Nelson MA, Werner-Washburne M, Selitrennikoff CP, Kin-
sey JA, Braun EL, Zelter A, Schulte U, Kothe GO, Jedd G, Mewes W,
et al.: The genome sequence of the filamentous fungus Neu-
rospora crassa. Nature 2003, 422:859-868.
81. Dean RA, Talbot NJ, Ebbole DJ, Farman ML, Mitchell TK, Orbach MJ,
Thon M, Kulkarni R, Xu JR, Pan H, Read ND, Lee YH, Carbone I,
Brown D, Oh YY, Donofrio N, Jeong JS, Soanes DM, Djonovic S,
Kolomiets E, Rehmeyer C, Li W, Harding M, Kim S, Lebrun MH,
Bohnert H, Coughlan S, Butler J, Calvo S, Ma LJ, et al.: The genome
sequence of the rice blast fungus Magnaporthe grisea. Nature
2005, 434:980-986.
82. Galagan JE, Calvo SE, Cuomo C, Ma LJ, Wortman JR, Batzoglou S, Lee
SI, Basturkmen M, Spevak CC, Clutterbuck J, Kapitonov V, Jurka J,
Scazzocchio C, Farman M, Butler J, Purcell S, Harris S, Braus GH,
Draht O, Busch S, D'Enfert C, Bouchier C, Goldman GH, Bell-Peder-
sen D, Griffiths-Jones S, Doonan JH, Yu J, Vienken K, Pain A, Freitag
M, et al.: Sequencing of Aspergillus nidulans and comparative
analysis with A. fumigatus and A. oryzae. Nature 2005,
438:1105-1115.
83. Eichinger L, Pachebat JA, Glöckner G, Rajandream MA, Sucgang R,
Berriman M, Song J, Olsen R, Szafranski K, Xu Q, Tunggal B, Kummer-
feld S, Madera M, Konfortov BA, Rivero F, Bankier AT, Lehmann R,
Hamlin N, Davies R, Gaudet P, Fey P, Pilcher K, Chen G, Saunders D,
Sodergren E, Davis P, Kerhornou A, Nie X, Hall N, Anjard C, et al.:
The genome of the social amoeba Dictyostelium discoideum.
Nature 2005, 435:43-57.
84. Tuskan GA, Difazio S, Jansson S, Bohlmann J, Grigoriev I, Hellsten U,
Putnam N, Ralph S, Rombauts S, Salamov A, Schein J, Sterck L, Aerts
A, Bhalerao RR, Bhalerao RP, Blaudez D, Boerjan W, Brun A, Brunner
A, Busov V, Campbell M, Carlson J, Chalot M, Chapman J, Chen GL,
Cooper D, Coutinho PM, Couturier J, Covert S, Cronk Q, et al.:
The
genome of black cottonwood, Populus trichocarpa (Torr. &
Gray). Science 2006, 313:1596-1604.
85. Arabidopsis Genome Initiative: Analysis of the genome sequence
of the flowering plant Arabidopsis thaliana. Nature 2000,
408:796-815.
86. Goff SA, Ricke D, Lan TH, Presting G, Wang R, Dunn M, Glazebrook
J, Sessions A, Oeller P, Varma H, Hadley D, Hutchison D, Martin C,
Katagiri F, Lange BM, Moughamer T, Xia Y, Budworth P, Zhong J,
Miguel T, Paszkowski U, Zhang S, Colbert M, Sun WL, Chen L,
Cooper B, Park S, Wood TC, Mao L, Quail P, et al.: A draft
sequence of the rice genome (Oryza sativa L. ssp. japonica).
Science 2002, 296:92-100.
87. Palenik B, Grimwood J, Aerts A, Rouzé P, Salamov A, Putnam N,
Dupont C, Jorgensen R, Derelle E, Rombauts S, Zhou K, Otillar R,
Merchant SS, Podell S, Gaasterland T, Napoli C, Gendler K, Manuell
A, Tai V, Vallon O, Piganeau G, Jancek S, Heijde M, Jabbari K, Bowler
C, Lohr M, Robbens S, Werner G, Dubchak I, Pazour GJ, et al.: The
tiny eukaryote Ostreococcus provides genomic insights into
the paradox of plankton speciation. Proc Natl Acad Sci USA 2007,
104:7705-7710.
88. Tyler BM, Tripathy S, Zhang X, Dehal P, Jiang RH, Aerts A, Arre-
dondo FD, Baxter L, Bensasson D, Beynon JL, Chapman J, Damasceno
CM, Dorrance AE, Dou D, Dickerman AW, Dubchak IL, Garbelotto
M, Gijzen M, Gordon SG, Govers F, Grunwald NJ, Huang W, Ivors
KL, Jones RW, Kamoun S, Krampis K, Lamour KH, Lee MK, McDon-
ald WH, Medina M, et al.: Phytophthora genome sequences
uncover evolutionary origins and mechanisms of
pathogenesis. Science 2006, 313:1261-1266.
89. Carlton JM, Angiuoli SV, Suh BB, Kooij TW, Pertea M, Silva JC, Ermo-
laeva MD, Allen JE, Selengut JD, Koo HL, Peterson JD, Pop M, Kosack
DS, Shumway MF, Bidwell SL, Shallom SJ, van Aken SE, Riedmuller SB,
Feldblyum TV, Cho JK, Quackenbush J, Sedegah M, Shoaibi A, Cum-
mings LM, Florens L, Yates JR, Raine JD, Sinden RE, Harris MA, Cun-
ningham DA, et al.: Genome sequence and comparative
analysis of the model rodent malaria parasite Plasmodium
yoelii yoelii. Nature 2002, 419:512-519.
90. Gardner MJ, Hall N, Fung E, White O, Berriman M, Hyman RW, Carl-
ton JM, Pain A, Nelson KE, Bowman S, Paulsen IT, James K, Eisen JA,
Rutherford K, Salzberg SL, Craig A, Kyes S, Chan MS, Nene V, Shal-
lom SJ, Suh B, Peterson J, Angiuoli S, Pertea M, Allen J, Selengut J, Haft
D, Mather MW, Vaidya AB, Martin DM, et al.: Genome sequence
of the human malaria parasite
Plasmodium falciparum. Nature
2002, 419:498-511.
91. Aury JM, Jaillon O, Duret L, Noel B, Jubin C, Porcel BM, Ségurens B,
Daubin V, Anthouard V, Aiach N, Arnaiz O, Billaut A, Beisson J, Blanc
Genome Biology 2008, Volume 9, Issue 3, Article R50 McGuire et al. R50.19
Genome Biology 2008, 9:R50
I, Bouhouche K, Câmara F, Duharcourt S, Guigo R, Gogendeau D,
Katinka M, Keller AM, Kissmehl R, Klotz C, Koll F, Le Mouël A, Lep-
ère G, Malinsky S, Nowacki M, Nowak JK, Plattner H, et al.: Global
trends of whole-genome duplications revealed by the ciliate
Paramecium tetraurelia. Nature 2006, 444:171-178.
92. Eisen JA, Coyne RS, Wu M, Wu D, Thiagarajan M, Wortman JR,
Badger JH, Ren Q, Amedeo P, Jones KM, Tallon LJ, Delcher AL, Salz-
berg SL, Silva JC, Haas BJ, Majoros WH, Farzad M, Carlton JM, Smith
RK Jr, Garg J, Pearlman RE, Karrer KM, Sun L, Manning G, Elde NC,
Turkewitz AP, Asai DJ, Wilkes DE, Wang Y, Cai H, et al.: Macronu-
clear genome sequence of the ciliate Tetrahymena
thermophila, a model eukaryote. PLoS Biol 2006, 4:e286.