Báo cáo y học: "Tracking of TV and video gaming during childhood: Iowa Bone Development Study" pdf
Bạn đang xem bản rút gọn của tài liệu. Xem và tải ngay bản đầy đủ của tài liệu tại đây (253.84 KB, 9 trang )
RESEARCH Open Access
Tracking of TV and video gaming during
childhood: Iowa Bone Development Study
Shelby L Francis
1*
, Matthew J Stancel
1
, Frances D Sernulka-George
1
, Barbara Broffitt
3
, Steven M Levy
2,3
and
Kathleen F Janz
1,2
Abstract
Background: Tracking studies determine the stability and predictability of specific phenomena. This study
examined tracking of TV viewing (TV) and video game use (VG) from middle childhood through early adolescence
after adjusting for moderate and vigorous physical activity (MVPA), percentage of body fat (% BF), and maturity.
Methods: TV viewing and VG use were measure d at ages 5, 8, 11, and 13 (n = 434) via parental- and self-report.
MVPA was measured using the Actigraph, % BF using dual-energy x-ray absorptiometry, and maturity via Mirwald
predictive equations. Generalized Estimating Equa tions (GEE) were used to assess stability and logistic regression was
used to predict children “at risk” for maintaining sedentary behaviors. Additional models examined tracking only in
overfat children (boys ≥ 25% BF; girls ≥ 32% BF). Data were collected from 1998 to 2007 and analyzed in 2010.
Results: The adjusted stability coefficients (GEE) for TV viewing were 0.35 (95% CI = 0.26, 0.44) for boys, 0.32 (0.23,
0.40) for girls, and 0.45 (0.27, 0.64) for overfat. For VG use, the adjusted stability coefficients were 0.14 (0.05, 0.24) for
boys, 0.24 (0.10, 0.38) for girls, and 0.29 (0.08, 0.50) for overfat. The adjusted odds ratios (OR) for TV viewing were
3.2 (2.0, 5.2) for boys, 2.9 (1.9, 4.6) for girls, and 6.2 (2.2, 17.2) for overfat. For VG use, the OR were 1.8 (1.1, 3.1) for
boys, 3.5 (2.1, 5.8) for girls, and 1.9 (0.6, 6.1) for overfat.
Conclusions: TV viewing and VG use are moderately stable throughout childhood and predictive of later behavior.
TV viewing appears to be more stable in younger children than VG use and more predictive of later behavior.
Since habitual patterns of sedentarism in young children tend to continue to adolescence, early in tervention
strategies, particularly to reduce TV viewing, are warranted.
Keywords: physical activity, stabili ty, sedentary behavior, adolescence
Background
Childhood overweight and obesity r ates have increased
dramatically since 1990. The worldwide prevalence of
childhood overweight and obesit y increased from 4.2% in
1990 to 6.7% in 2010. In 2010, 43 million children were
estimated to be overweight and obese, with another 92
million at risk of becoming overweight [1]. In the US,
National Health and Nutrition Examination Survey
(NHANES) data indicate that childhood obesity rates
have tripled from 1980 to 2008 [2,3]. Previous studies
have shown that increased sedentary behaviors, such as
television viewing (TV), video game playing, computer
game playing, and/or electronic game playing (VG), are
linked to increased risk for overweight and obesity in the
child population [4-7]. Based on this knowledge, public
health officials have made reducing sedentary behaviors a
focus for obesity prevention [8]. In order to implement
successful prevention programs, a greater understanding
of the age-related patterns of change, stability, and pre-
dictability of sedentary behaviors is needed.
Tracking studies quantify how well individuals main-
tain his/her rank within a cohort over time [9]. To do
this, three main concepts must be addressed- t he direc-
tion of change (whether the behavior increases or
decreases), the stability of the behavior over time [9], and
whether the behavior at an earlier time can be used to
predict future behavior [9]. If sedentary behavior remains
stable throughout childhood and into early adolescence,
* Correspondence:
1
Department of Health and Human Physiology, University of Iowa, Iowa City,
IA, USA
Full list of author information is available at the end of the article
Francis et al. International Journal of Behavioral Nutrition and Physical Activity 2011, 8:100
/>© 2011 Francis et al; licensee BioMed Central Ltd. This is an Open Access article distributed under the terms of the Cr eative Commons
Attribution License (http://creativecommons .org/licenses/by/2 .0), which permits unrestricted use, distribution, and reproduction in
any medium, provided the original work is properly cited.
insight is provided as to whe n initial precursors and fac-
tors that determine this behavior occur and who should
receive a targeted or high risk intervention ea rly in life
[10-12].
Many studies have focused on tracking of physical
activity (PA) and inactivity [9,12-17], but fewer have
assessed whether sedentary behaviors track in childhood
or adolescence. Sedentary behaviors have been opera-
tionally defined as activities that consist of mostly sitting
[18], and it has been suggested that this should be kept
conceptually distinct from physical inactivity [19]. The
latter, when commonly measured using objective moni-
tors, such as accelerometers or heart rate monitors,
reflects low movement c ounts or low heart rates. These
measures are typically void of context, whereas seden-
tary behaviors are observable actions that children parti-
cipate in within distinct situations (e.g., viewing TV). It
is the actual sedentary behaviors, where the energy
expenditure and movement intensity are assumed t o be
(relatively) low but the context of the activity is known,
that are addressed in this study. A review by Biddle
et al. ex amined the tracking of sedent ary behaviors, and
reported moderate-to-large coefficients for follow-up
over several years, and smaller coefficients for longer
time periods [18]. That review found evidence for
slightly stronger tracking of TV viewing than other
sedentary behaviors, but also noted that TV viewing
may not be reflective of total sedentary time in children
and adolescents as there appears to be a shift towards
more VG use [18].
The aims of the current paper are three-fold: (1) to
investigate the change in sedentary behaviors (specifically
TV viewing and VG use) separately in boys and girls, (2)
to examine the stability of these behaviors from middle
childhoo d to early adolescence, and (3) to determine the
predictability of future sedentary behaviors in childhood
and early adolescence. Previous research has suggested
that tracking of PA can be affected by gender, maturity,
and level of adiposity; therefore, these factors, along with
level of physical activity, were considered in this study of
sedentary behaviors [10,20,21]. Stratification by gender
and consideration of maturity, adiposity, and PA level
reduced potential confoun ding and provided a longitudi-
nal view of factors associated with the behaviors of inter-
est (TV viewing and VG use).
Methods
The current paper is a follow-up of a subsample of the
Iowa Bone Development Study, a longitudinal study to
improve understanding of b one health during childhood
[22-24]. Study participants were recruited between 1998
and 2001 from a larger cohort of Midwestern children
(n = 8 90) that were then partici pating in the Iowa Fluor-
ide Study. The Iowa Fluoride Study population had been
previously recruited (between 1992 and 1995) through
eight Iowa hospitals immediately postpartum. The Iowa
Bone Development Study participants are almost all
(96%) white; nearly two-thirds of the participants’ parents
had some level of coll ege education and a family income
(at recruitment) of $20,000 per year or greater [22].
Sedentary behaviors, moderate and vigorous PA
(MVPA), % BF, and maturity were gathered over an 8-
year time period at four ages: 5, 8, 11 and 13 yr. A total
of 434 children participated in measurements at age 5
(baseline) and at least one or more of the three follow-up
measurements (ages 8, 11, and 13). The study was
approved by The University of Iowa Institutional Review
Board; written, informed consent was provided by the
parents and assen t by the children. Data w ere collected
from 1998 to 2007 and were analyzed in 2010.
Sedentary Behaviors
During each clinical visit, questionnaire data on TV view-
ing and VG use were collected. When the children were
5- and 8-years-old, parents were asked to report the aver-
age amount of time per day their child spent in these
sedentary behaviors to the nearest quarter hour (i.e., On
average, how many hours per day does your child spend
watching any type of television including video movies?
On average, how many hours per day does your child
spend playing video games (such as Nintendo
®
)and/or
computer games?). Parental reports are commonly used
to assess these behaviors in young children [6,7,25] and
have been shown to be moderately accurate when com-
pared to direct observation (TV: r = 0.31 - 0.61; VG: r =
0.44 - 0.49) [26,27]. When the chil dren were 11- and 13-
years-old, self-report questionnaires were used with the
following response categories: (1) < 1 hour · day
-1
or not
at all; (2) ≥ 1hour·day
-1
but < 2 hours · day
-1
;(3)≥ 2
hours · day
-1
but < 3 hours · day
-1
;(4)≥ 3hours·day
-1
but < 4 hours · day
-1
;and(5)≥ 4hours·day
-1
.This
method has been used in previous studies for children
within this age range [28,29] (TV: r = 0.54) [30].
Amounts of t ime spent viewing TV and playing VG
when the children were 5- and 8-years-old were categor-
ized to match the response options when they were 11-
and 13-years-old.
MVPA
MVPA was assessed at each measurement period using
Actigraph uniaxial physical activity monitors (model
7164). When compared to heart rate monitoring and
indirect calorimetry, this method has been shown to be
valid (r = 0.50 - 0.74) [31,32]. Durin g a month in the
autumn season, children aged 5 and 8 years were asked to
wear the monitor during waking hours for 4 consecutiv e
days (including one weekend day). When they were 11-
and 13-years-old they were asked to wear the monitor
Francis et al. International Journal of Behavioral Nutrition and Physical Activity 2011, 8:100
/>Page 2 of 9
during waking hours for 5 consecutive days (including two
weekend days). Previous research has demonstrated less
stable intraclass correlation coefficien ts in activity moni-
tored PA in older children as compared to younger chil-
dren, indicating the necessity for increased wear time for
11- and 13-year-olds [33]. To be considered as having
complete PA data, children had to have worn the Acti-
graph monitor for at least 8 hours per day for a minimum
of 3 days (within 15 months of the DXA scan). Children
who had only 3 weekdays of data were not excluded from
analysis. Movement count values were accumulated an d
summed over 1-minute intervals, as this was the shortest
interval available at the time of measurement. MVPA min-
utes each day were used as a summary variable. The vari-
able was derived using the cut point thresho ld of greater
than 2999 movement counts per min ute (ct · min
-1
)as
defined by Treuth and collegues (R
2
=0.84andSEE=
1.36; calibrated against indirect calorimetry) [34].
% Body Fat
Fat mass was determined using densiometry during clini-
cal visits to the University of Iowa General Clinical
Research Center by one of three qualified technicians.
Specifically, whole-body scans using Hologic QDR 2000
dual energy x-ray absorptiometry (DXA) were conducted
with software version 7.20B and fan-beam mode for 5-
and 8-year-old children. The Hologic QDR 4500 DXA
(Delphi upgrade) with software version 12.3 and fan-beam
mode was used when they reached 11- and 13-years-of-
age. Daily scans using the Hologic phantom were con-
ducted to maintain quality-control.
To account for the differences between the two DXA
machines, translation equations from QDR 2000 DXA
measures to 4500 DXA measures were used for the data
taken at 5 and 8 years of age. These equations were
developed from a separate study developed specifically
for comparing results with the two DXA machines. A
total of 60 children (28 girls and 32 boys) 9.9 to 12.4
years of age (M = 11.4, SD = 0.4) were measured on both
machines during one clinic visit in random order (TLB,
unpublished observations, 2007). Total body fat mass
(kilograms;kg)wasderivedfromthescannedimages.
Percentage of body fat (% BF) was calculated based on
total fat mass and body weight (total fat mass ÷ body
weight × 100). The coefficient for determination (R
2
)for
theQDR2000DXAdataregressedontothe4500DXA
was 0.9979. Actual observations were extremely tight
around the regression line (TLB, unpublished data,
2007). % BF cut points (≥ 25% BF in boys and ≥ 32% BF
in girls) were set to differentiate overfat children from
healthy weight children in this study. Previous research
has confirmed that these cut points are associated with
signi ficant increases in cardiovascu lar disease risk factors
in children [35,36].
Maturity
During each DXA visit, research nurses measured body
mass (kilograms: kg) and height (centimeters; cm) using
a Healthometer physician’s scale (Continental, Bridge-
view IL) and a Harpenden stadiometer (Holtain, United
Kingdom). Both devices were calibrated routinely. Chil-
dren were measured while wearing indoor clothes, with-
out shoes. Sitting height was also measured when the
children were 11 and 13 years. Maturity offset (year from
peak height velocity) was calculated using predictive
equations determined by Mirwald and colleagues [37].
Peak height velocity (or somatic maturity) was deter-
mined using height, weight, age, gender, sitting height,
and leg length as predictors. These equations have been
validated in white Canadian children and adolescents (R
2
= 0.91, 0.92, SEE = 0.49, 0.50). The maturity-offset vari-
able was dichotomized as 0 (prior to peak height velocity,
or pre-mature) or 1 (≥ peak height velocity, or mature).
Statistical Analysis
Age-specific comparisons were conducted between boys
and girls using the Student’s t-test for age, height, weight,
fat mass, % BF, and MVPA. The Cochran-Armitage trend
test was used to determine if one sex reported signifi-
cantly more TV viewing and/or VG use than the other
sex. Bowker’s test of symmetry was used to evaluate pos-
sible directionality of movement between categories of
TV viewing and VG use. Stability of TV vi ewing and VG
use over time was assessed with weighted kappa coeffi-
cients, Kendall Tau b correlations, and Generalized Esti-
mating Equations (GEE). Weighted kappa coefficients
provideamethodofquantifyingthestabilityoftheTV
viewing and VG use measures, while Kendall Tau b cor-
relations measure the association between TV viewing
and VG use measures from one measurement year to the
next. GEE provides a method of analyzing correlated data
in which subjects are assessed at different points in time
and have a varying number of data points. The GEE
models were adjusted for maturity, overfat (at age 5 and
concurrentl y, i.e., current measurement age), and MVPA
(at age 5 and concurrently) in boys and girls sepa rately.
GEE was also used for a subset of overfat children (n =
34, boys and girls combined to maintain power) to exam-
ine if tracking of TV and VG is greater in children who
are already overfat, i.e., already at risk. The overfat model
was adjusted for maturity, sex, and MVPA (at age 5 and
concurrently). Logistic regression was used to d etermine
the odds of remaining in the upper category of TV view-
ing and VG use at ages 8, 11, and 13 based on being in
the upper category at age 5, relative to children in the
lower categories at age 5. The data for each analysis were
divide d into quintiles, with the top quintile being used as
the upper category. The upper category for both boys’
and girls’ TV viewing was > 3 hours · day
-1
.Theupper
Francis et al. International Journal of Behavioral Nutrition and Physical Activity 2011, 8:100
/>Page 3 of 9
categories for boys’ VG use were > 1 hour · day
-1
at age 5,
> 2 hours · day
-1
at ages 8 and 11, and > 3 hours · day
-1
at
age 13. The upper category for girls’ VG use was > 1 hour
·day
-1
except age 1 3, where the upper category was > 2
hours · day
-1
. This model also accounted for maturity,
overfat (age 5 and concurrently), and MVPA (age 5 and
concurrently). A secondary analysis using only the overfat
children was also examined. This model also accounted
for maturity, sex, and MVPA (at age 5 and concurrently).
All statistical analyses were conducted using SAS version
9.1.3. and were analyzed separately by gender (with the
exception of the overfat children analyses, where boys
and girls were combined). Results with p < 0.05 were
considered statistically significant.
Results
Characteristics of Participants
The characteristics of the participants at the time of each
measurement (ages 5, 8, 11, and 13 yr), including age,
height, weight, fat mass, % BF, and MVPA, are provided
in Table 1. At all ages, boys were more active than girls
(p < 0.05). Time in MVPA increased from age 5 to 11 for
boys, and then decreased at age 13. Girls’ time in MVPA
increased from age 5 to 8, and then decreased at ages 11
and 13. The proportion of children in each category for
TV viewing and VG use at each measurement age are
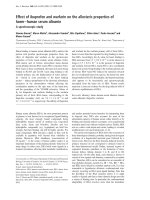
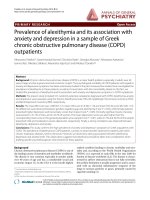
provided in Figure 1. More than half of the entire sample
reported watching more than 2 hours of TV per day at
each measurement age. Boys spent more time playing
VG than girls at all ages (p < 0.05), and the time spent
playing VG increased for both boys and girls over the
four measurement periods.
There was an increase in TV viewing for boys from age
8to13(p<0.05)(Table2).Boys’ VG use increased sig-
nificantly at each age (p < 0.005), except from age 11 to
13, when there was no significant increase. Girls’ TV
viewing decreased from age 5 to 8 (p < 0.05), but then
leveled off. VG use for girls showed no significant
increase from age 5 to 8, but did increase significantly
thereafter (p < 0.05).
Weighted kappa coefficients (Table 3) for boys’ TV
viewing showed slight (0.12 to 0.19) to fair (0.22 to 0.29)
agreement. Their VG use coefficients showed only slight
(0.01 to 0.14) agreement. The weighted kappa coefficients
for girls’ TV viewing time showed slight (0.09 to 0.20) to
fair (0.21 to 0.34) agreement. Similarly, their VG use
coefficients also showed slight (0.01 to 0.18) to fair (0.22
to 0.34) agreement. Landis and Koch characterized coeffi-
cients ranging from 0 to 0.20 as slight agreement, and
coefficients ranging from 0.21 to 0.40 as fair agreement
[38]. Kendall Tau b correlation coefficients are shown in
Table 4. Boys’ TV coefficients ranged from 0.20 to 0.40.
Their VG use coefficients ranged from 0.04 to 0.18. Girls’
TV coefficients ranged from 0.09 to 0.44. Their VG use
coefficients ranged from 0.03 to 0.35.
GEE analyses for TV viewing and VG use for boys,
girls, and overfat children (boys and girls combined) are
summarized in Table 5. After adjustment, the boys’ and
girls’ coefficients remained virtually unchanged, indicat-
ing that maturity, overfat (age 5 and concurrent), and
Table 1 Participant Characteristics
Age 5 Age 8 Age 11 Age 13
Boys Girls Boys Girls Boys Girls Boys Girls
(n = 205) (n = 229) (n = 193) (n = 222) (n = 171) (n = 211) (n = 168) (n = 189)
Age (yr) 5.2 ± 0.4 5.3 ± 0.5* 8.7 ± 0.6 8.7 ± 0.6 11.2 ± 0.3 11.2 ± 0.3 13.3 ± 0.4 13.3 ± 0.4
Height (cm) 112 ± 6 111 ± 6 134 ± 7* 132 ± 7 149 ± 8 149 ± 8 163 ± 10* 160 ± 7
Weight (kg) 21 ± 4 20 ± 4 33 ± 10 32 ± 9 45 ± 13 44 ± 12 58 ± 16 56 ± 15
Fat Mass (kg) 3.9 ± 2.1 4.6 ± 2.4* 8.0 ± 6.3 9.2 ± 5.9 12.7 ± 9.2 14.2 ± 8.7* 15.4 ± 11.6 17.9 ± 10.6*
%BF
a
18.8 ± 5.3 22.8 ± 6.0* 22.6 ± 9.3 27.7 ± 8.8* 26.4 ± 10.9 30.5 ± 9.9* 23.4 ± 12.6 29.3 ± 9.9*
MVPA (minutes · day
-1
)
b
31.5 ± 15.9* 24.5 ± 13.1
c
38.6 ± 21.2* 25.9 ± 15.5
d
42.0 ± 22.1* 22.7 ± 13.9 31.6 ± 18.1* 19.5 ± 13.1
e
TV (≥ 2 hr · day
-1
)
f
(%) 58 56 50 51 63 50 64
†
52
VG (≥ 1 hr · day
-1
)
f
(%) 22
†
12 42
†
14 60
†
32 66
†
34
Values are presented as mean ± SD.
SD, standard deviation.
a
Percentage of body fat determined by DXA scan.
b
moderate-to-vigorous physical activity.
c
n = 228.
d
n = 221
e
n = 187.
Response categories: (1) < 1 hr · day-1 or not at all; (2) ≥ 1 hr · day-1 but < 2 hr · day-1; (3) ≥ 2 hr · day-1 but < 3 hr · day-1;
(4) ≥ 3 hr · day-1 but < 4 hr · day-1; and (5) ≥ 4 hr · day-1.
* Age-specific comparison of boys and girls using Student’s t-test (p < 0.05).
†
Age-specific comparison of boys and girls using the Cochran-Armitage trend test (p < 0.05).
Francis et al. International Journal of Behavioral Nutrition and Physical Activity 2011, 8:100
/>Page 4 of 9
MVPA were not confounding the results. The overfat
children’s coefficients were altered slightly after adjust-
ment; being female was the only significant variable in
the adjusted model for TV v iewing (p < 0.05). None of
the variables were significant in the overfat children’sVG
use model.
Logistic regression was used to determine if we could
predict high levels of TV viewing or VG use later in life
(age 13) based on age 5 levels (Table 5). Both the unad-
justed and adjusted OR, as an estimate of relative risk
(RR), for boys’ and girls’ TV viewing were approximately
3.0. The crude OR for TV viewing for the overfat chil-
dren was 3.7 (95% CI = 1.5, 9.0); after adjustment it was
6.2 (95% CI = 2.2, 17.2). Gender (specifically being
female) was significant in this adjusted model (p < 0.05).
The crude OR for VG use for the overfat children was
2.7 (95% CI = 0.7, 10.6) and 1.9 (95% CI = 0.6, 6.1) after
adjustment; none of the variables were significant in this
model.
Discussion
Increased sedentary behaviors are linked to increased
risk fo r overweight and obesity in the child population
[4-7]. This study examined the tracking of select seden-
tary behaviors (TV viewing and VG use) in one group
of children from approximately age 5 t o age 13. We
report increased sedentary behavior (especially VG use)
over ti me, slight to fair stability of TV viewing and VG
use over time, and the tendency of early values (espe-
cially TV viewing) to predict later values. Additionally,
overfat 5-year-old girls who watched a great deal of TV
were highly likely to continue this behavio r (TV view-
ing) as they aged.
Figure 1 Percentages of children in TV and VG categories at
each age. Boys (age 5: n = 205; age 8: n = 193; age 11: n = 171;
age 13: n = 168). Girls (age 5: n = 229; age 8: n = 222; age 11: n =
211; age 13: n = 189).
Table 2 Bowker’s test of symmetry for percentage of change in daily TV and VG time between ages 5, 8, 11, and 13
Age 5-8 Age 5-11 Age 5-13 Age 8-11 Age 8-13 Age 11-13
TV Viewing
Boys Increase 23 36 36 43* 43* 34
Decrease 41 38 37 28 24 32
Girls Increase 22 27 32 35 37 35
Decrease 41* 39 41 29 33 38
Video Gaming
Boys Increase 33** 54*** 61*** 45*** 53*** 39
Decrease 10 8 8 15 13 35
Girls Increase 9 27** 31*** 26** 32*** 28*
Decrease 7 875917
* p < 0.05; ** p < 0.01; *** p < 0.001.
Boys (age 5: n = 205; age 8: n = 193; age 11: n = 171; age 13: n = 168.)
Girls (age 5: n = 229; age 8: n = 222; age 11: n = 211; age 13: n = 189.)
Francis et al. International Journal of Behavioral Nutrition and Physical Activity 2011, 8:100
/>Page 5 of 9
TV and VG
The amount of time spent watching TV stayed relatively
stable over time, with more than half of the sample
reporting that they watched more than two hours of TV
daily at every measurement age. The current recommen-
dation by the American Academy of Pediatrics is that
children should limit their total media time to 1 to
2 hours per day [39]. The children in our sample were
exceeding that recommendation with TV viewing alone.
The odds of remaining in the “at risk” (highly sedentary)
group are higher for TV viewing than for VG use. It has
been suggested by Sturm [40] that this might be due to
secular trends and the length of time that TV has been
available compared to newer forms of media (i.e., compu-
terandVGgames).TVviewinghasbecomeaprevalent
sedentary behavior in present-day society and it has been
identified that prolonged TV vie wing may be associated
with weight gain. This weight gain could be caused by a
reduction in e nergy expenditure if kids are watching TV
instead of participating in active play or sport and/or by
increasing caloric intake by snacking while viewing or
altering eating patterns based on food advertising [40].
Even though VG use was found to be much l ess stable
than TV viewing, VG time increased roughly three-fold
for both boys and girls. These results might be explained
in two ways: 1) that VG use does increase as children age
from 5 to 13, and/or, 2) that VG use is gaining popularity
as a secular trend at all ages due to targeting and avail-
ability of this technology to younger and younger chil-
dren [40]. Additional research on VG usage in children is
needed to determine if either explanation is plausible.
Maturity, Overfat, and MVPA
Surprisingly, neither the TV viewing nor VG use GEE
and OR results were altered significantly after adjustment
for maturity, overfat, or MVPA, indicating that these
potential confounders do not substantially affect TV
viewing or VG participation. The results for TV viewing
remained relatively stable for both boys and girls. How-
ever, girls’ VG use was more stable than boys’,even
though more boys reported playing VG. This suggests
that, even though a large number of boys (66% reported
≥ 1hr·day
-1
at age 13) participate in VG use, the girls
who play at a young age continue to play throughout
childhood and into adolescence. In fact, the girls in the
present study are over 3 times as likely to remain in the
“at risk” category for VG if they were in this category at
age 5. Unfortunately, data were not collected that could
explain this gender difference, but this does suggest that
for boys a broad, population-based intervention approach
would be warranted since “ at risk” status would be
expected to change, while the girls reporting VG us e at a
Table 3 Weighted kappa coefficients for stability of daily TV and VG time between ages 5, 8, 11, and 13
Age 5-8 Age 5-11 Age 5-13 Age 8-11 Age 8-13 Age 11-13
(n = 193 boys, 222
girls)
(n = 171 boys, 211
girls)
(n = 168 boys, 189
girls)
(n = 161 boys, 205
girls)
(n = 158 boys, 185
girls)
(n = 152 boys, 180
girls)
TV Viewing
Boys 0.29** (0.20, 0.38) 0.12* (0.02, 0.22) 0.17* (0.07, 0.27) 0.19* (0.09, 0.28) 0.22** (0.12, 0.32) 0.24** (0.13, 0.36)
Girls 0.34** (0.25, 0.42) 0.21** (0.11, 0.30) 0.09* (-0.01, 0.19) 0.30** (0.22, 0.39) 0.20* (0.11, 0.30) 0.17* (0.07, 0.26)
Video
Gaming
Boys 0.14* (0.02, 0.26) 0.05* (-0.01, 0.10) 0.01* (-0.04, 0.07) 0.10* (0.01, 0.19) 0.11* (0.04, 0.19) 0.13* (0.02, 0.25)
Girls 0.34** (0.17, 0.51) 0.09* (0.00, 0.17) 0.08* (-0.01, 0.18) 0.22** (0.11, 0.32) 0.02* (-0.05, 0.10) 0.18* (0.08, 0.29)
Presented as kappa (95% confidence interval)
Landis and Koch (1977) proposed classifications for the interpretation of a weighted kappa value. * slight; ** fair.
Table 4 Kendall Tau b correlation coefficients for stability of daily TV and VG time between ages 5, 8, 11, and 13
Age 5-8 Age 5-11 Age 5-13 Age 8-11 Age 8-13 Age 11-13
Boys: n = 193 Boys: n = 171 Boys: n = 168 Boys: n = 161 Boys: n = 158 Boys: n = 152
Girls: n = 222 Girls: n = 211 Girls: n = 189 Girls: n = 205 Girls: n = 185 Girls: n = 180
TV Viewing
Boys 0.40*** 0.20** 0.24*** 0.28*** 0.30*** 0.29***
Girls 0.44*** 0.27*** 0.09 0.41*** 0.28*** 0.25***
Video Gaming
Boys 0.16* 0.15* 0.04 0.13 0.18** 0.15*
Girls 0.35*** 0.15* 0.12 0.32*** 0.03 0.27***
* p < 0.05; ** p < 0.01; *** p < 0.001
Francis et al. International Journal of Behavioral Nutrition and Physical Activity 2011, 8:100
/>Page 6 of 9
young age, or those in the “at risk” group,arelikelyto
remain so and therefore a specific, targeted intervention
would be warranted. Regardless, our findings are cause
for concern due to the increasing availability of VG
which is market ed toward younger populations. In addi-
tion, we suspect that, as VG is marketed more toward
young girls, there will also be an increase in the propor-
tion of girls being classified in the “at risk” category.
Similar to previous research, we found that boys were
more active (MVPA) than girls at each measurement
point [10,13,15]. However, boys also watched more TV at
age 13 than girls and played more VG t han girls at every
age, suggesting that PA and sedentary behaviors are inde-
pendent. This is consistent with research conducted by
Biddle et al. [18] which suggested that TV viewing and
VG use were largely uncorrelated with PA in adolescents,
indicating that there is time for an individual to be both
active and sedentary. Our results contribute to the litera-
ture, suggesting that being both physically active and
sedentary are distinct behaviors and should be adjusted
for when conducting research.
Additionally, our results coincide with previous knowl-
edge that MVPA decreases as children age [41]. Unfortu-
nately, TV viewing and VG use do not appear to be
decreasing with maturity in the same manner. Decreasing
levels of MVPA combined with consistent or increasing
amounts of TV v iewing and VG use as children age may
lead to future health problems.
Overfat Girls and TV
The subgroup of overfat children analyzed were six
times as likely to remain in the upper category for TV
viewing at la ter ages if they were in the upper category
at ag e 5 (from adjusted analyses). Gender (be ing female)
was the only significant co-variate in this model, sug-
gesting that overfat girls are likely to begin watching TV
at a young age and continue watching as t hey age. This
“at risk” group may benefit from targeted interventions.
However, due to the small sample size of overfat girls in
our st udy, more research is needed to determine if TV
viewing time indeed tracks better in the overfat, female
population.
Limitations of our study include limited representation
of minorities and children from low socioeconomic status
(SES) households. Also, parental report of children’s
sedentary behavior is less accurate than direct observation
[42]. However, this study is one of the few to investigate
the longitudinal trends of sedentary behavior in a relatively
largesampleofchildren.Additionalstudystrengths
include the use of objective measures of % BF (DXA) and
physical activity (Actigraph). Finally, our ability to examine
sedentary behaviors from middle childhood through ado-
lescence enhances our understanding of the pattern of
change, stability, and predictability of these behaviors.
Conclusions
With the exception of overfat girls, the tracking of TV
viewing and VG use was at best moderate, suggesting that
some children who initially participate in extremely high
or relatively low levels of sedentary behavior may shift into
other categories over time. Our results are consistent with
those found in the review previously mentioned by Biddle
et al., that tracking coefficients for shorter time periods are
larger than coeff icients for larger time periods [18]. Our
results also indicate that overfat girls maintain s table
sedentary behavior patterns over time which suggests the
Table 5 Generalized estimating equation coefficients and odds (predictability) of TV and VG for boys, girls, and those
classified as overfat (n = 205 boys, 229 girls, 34 overfat)
Unadjusted Adjusted Unadjusted Adjusted
Stability Coefficient Stability Coefficient Odds Ratio Odds Ratio
TV Viewing
Boys 0.35 (0.26, 0.44) 0.35 (0.26, 0.44)
a
3.0 (1.9, 4.8) 3.2 (2.0, 5.2)
a
Girls 0.34 (0.26, 0.43) 0.32 (0.23, 0.40)
a
3.2 (2.1, 4.9) 2.9 (1.9, 4.6)
a
Overfat
b
0.41 (0.23, 0.59) 0.45 (0.27, 0.64)
c
3.7 (1.5, 9.0) 6.2 (2.2, 17.2)
c
Video Gaming
Boys 0.15 (0.05, 0.25) 0.14 (0.05, 0.24)
a
1.9 (1.1, 3.2) 1.8 (1.1, 3.1)
a
Girls 0.24 (0.09, 0.39) 0.24 (0.10, 0.38)
a
3.4 (2.1, 5.8) 3.5 (2.1, 5.8)
a
Overfat
b
0.37 (0.16, 0.57) 0.29 (0.08, 0.50)
c
2.7 (0.7, 10.6) 1.9 (0.6, 6.1)
c
Values are presented as point estimate (95% confidence interval).
a
Adjusted for maturity, overfat (age 5 and concurrent), and MVPA (age 5 and concurrent).
b Cut-points for being overfat: Boys ≥ 25% BF, Girls ≥ 32% BF.
c
Adjusted for maturity, sex, and MVPA (age 5 and concurrent).
Odds of being in upper category at subsequent ages for for children in upper category at age 5, relative to children in lower categories at age 5. The upper
category for both boys’ and girls’ TV was > 3 hours · day
-1.
The upper categories for boys’ VG were > 1 hour · day
-1
at age 5, > 2 hours · day
-1
at ages 8 and 11, and > 3 hours · day
-1
at age 13. The upper category for
girls’ video was > 1 hour · day
-1
except age 13, where the upper category was > 2 hours · day
-1
.
Francis et al. International Journal of Behavioral Nutrition and Physical Activity 2011, 8:100
/>Page 7 of 9
need for “high-risk,” targeted interventions aimed at pre -
venting excessive sedentary behavior patterns early in life.
Acknowledgements and funding
Supported by the National Institute of Dental and Craniofacial Research
(R01-DE12101 and R01-DE09551), the General Clinical Research Centers
Program (M01-RR00059), and the National Center for Research Resources
(UL1 RR024979).
The authors would like to thank the staff of the Iowa Fluoride Study for their
organizational efforts and the investigators—Drs. Trudy Burns, James Torner,
Marcia Willing, and Julie Eichenberger-Gilmore, for their support. Finally, we
gratefully acknowledge and thank the children and families participating in
the Iowa Fluoride Study and the Iowa Bone Development Study, because
without their contributions, this work would not have been possible.
Author details
1
Department of Health and Human Physiology, University of Iowa, Iowa City,
IA, USA.
2
Department of Epidemiology, University of Iowa, Iowa City, IA, USA.
3
Department of Preventive and Community Dentistry, University of Iowa,
Iowa City, IA, USA.
Authors’ contributions
SF participated in the drafting of the manuscript. KJ participated in the
design and coordination of the study, and helped to draft the manuscript.
MS participated in the drafting of the manuscript. DSG participated in the
drafting of the manuscript. BB performed the statistical analysis. SL
participated in the design and coordination of the study. All authors read
and approved the final manuscript.
Competing interests
The authors declare that they have no competing interests.
Received: 28 March 2011 Accepted: 24 September 2011
Published: 24 September 2011
References
1. de Onis M, Blossner M, Borghi E: Global prevalence and trends of
overweight and obesity among preschool children. Am J Clin Nutr 2010,
92:1257-64.
2. National Center for Health Statistics: Health, United States, 2004 with
chartbook on trends in the health of Americans.[.
gov/bookshelf/br.fcgi?book=healthus04&part=chartbook].
3. Ogden CL, Carroll MD, Curtin LR, Lamb MM, Flegal KM: Prevalence of high
body index in us children and adolescents, 2007-2008. JAMA 2010,
303:242-249.
4. Boone JE, Gordon-Larsen P, Adair LS, Popkin BM: Screen time and physical
activity during adolescence: longitudinal effects on obesity in young
adulthood.[ />5. Crespo CJ, Smit E, Troiano RP, Bartlett SJ, Macara CA, Anderson RE:
Television watching, energy intake, and obesity in US children: results
from the third National Health and Nutrition Examination Survey 1988-
1994. Arch Pediatr Adolesc Med 2001, 155:360-365.
6. Danner FW: A national longitudinal study of the association between
hours TV viewing and the trajectory of BMI growth among US children.
J Pediatr Psycho 2008, 33:1100-1107.
7. Taylor RW, Murdoch L, Carter P, Gerrard DF, Williams SM, Taylor BJ:
Longitudinal study of physical activity and inactivity in preschoolers: the
FLAME Study. Med Sci Sports Exerc 2009, 41:96-102.
8. U.S. Department of Health and Human Services: The Surgeon General’s
Vision for a Healthy and Fit Nation.[ />library/obesityvision/obesityvision2010.pdf].
9. Malina RM: Tracking of physical activity across the lifespan. Res Digest
2001, 3:1-8.
10. Janz KF, Dawson JD, Mahoney LT: Tracking physical fitness and physical
activity from childhood to adolescence: the Muscatine study. Med Sci
Sports Exerc 2000, 32:1250-1257.
11. Kelly LA, Reilly JJ, Jackson DM, Montgomery C, Grant S, Paton JY: Tracking
physical activity and sedentary behavior in young children. Pediatr Exerc
Sci 2007, 19:51-60.
12. Pate RR, Baranowski T, Dowda M, Trost SG: Tracking of physical activity in
young children. Med Sci Sports Exerc 1996, 28:92-96.
13. Baggett CD, Stevens J, McMurray RG, Evenson KR, Murray DM, Catellier DJ,
He K: Tracking of physical activity and inactivity in middle school girls.
Med Sci Sports Exerc 2008, 40:1916-1922.
14. Herman KM, Craig CL, Gauvin L, Katzmarzk PT: Tracking of obesity and
physical activity from childhood to adulthood: the physical activity
longitudinal study. Int J Pediatr Obes 2009, 4:281-288.
15. Kristensen PL, Moller NC, Korsholm L, Wedderkopp N, Andersen LB,
Froberg K: Tracking of objectively measured physical activity from
childhood to adolescence: The European youth heart study. Scand J Med
Sci Sports 2008, 18:171-178.
16. McMurry RG, Harrell JS, Bangdiwala SI, Hu J:
Tracking of physical activity
and
aerobic power from childhood through adolescence. Med Sci Sports
Exerc 2003, 35:1914-1922.
17. Sallis JF, Berry CC, Broyles SL, McKenzie TL, Nader PR: Variability and
tracking of physical activity over 2 yr in children. Med Sci Sports Exerc
1995, 27:1042-1049.
18. Biddle SJH, Pearson N, Ross GM, Braithwaite R: Tracking of sedentary
behaviours of young people: a systematic review. Prev Med 2010,
51:354-51.
19. Marshall SJ, Ramirez E: Reducing sedentary behavior: A new paradigm in
physical activity promotion.[ />10/1559827610395487].
20. Hesketh K, Wake M, Graham M, Waters E: Stability of television viewing
and electronic game/computer use in a prospective cohort study of
Australian children: relationship with body mass index. Int J Behav Nutr
Phys Act 2007, 4:60.
21. Janz KF, Burns TL, Levy SM: Tracking of activity and sedentary behaviors
in childhood: The Iowa Bone Development Study. Am J Prev Med 2005,
29:171-178.
22. Janz KF, Levy SM, Burns TL, Torner JC, Willing MC, Warren JJ: Fatness,
physical activity, and television viewing in children during the adiposity
rebound period: the Iowa bone development study. Prev Med 2002,
35:563-571.
23. Janz KF, Burns TL, Torner JC, Levy SM, Paulos R, Willing MC, Warren JJ:
Physical activity and bone measures in young children: The Iowa bone
development study. Pediatrics 2001, 107:1387-1393.
24. Janz KF, Burns TL, Levy SM: Tracking of activity and sedentary behaviors
in childhood: The Iowa bone development study. Am J Prev Med 2005,
29:171-178.
25. Escobar-Chaves SL, Markham CM, Addy RC, Greisinger A, Murray NG,
Brehm B: The fun families study: intervention to reduce children’sTV
viewing. Obesity (Silver Spring) 2010, 18(Suppl 1):99-101.
26. Robinson TN: Reducing children’s television viewing time to prevent
obesity. JAMA 1999, 282:1561-7.
27. Salmon J, Timperio A, Telford A, Carver A, Crawford D: Association of
family environment with children’s television viewing and with low level
of physical activity. Obes Res 2005, 13:1939-51.
28. Epstein LH, Paluch RA, Gordy CC, Dorn J: Decreasing sedentary behaviors
in treating pediatric obesity. Arch Pediatr Adolesc Med 2000, 154:220-6.
29. Taveras EM, Sandora TJ, Shih MC, Ross-Degnan D, Goldmann DA,
Gillman MW: The association of television and video viewing with fast
food intake by preschool-age children. Obesity 2006, 14:2034-41.
30.
Gortmaker SL, Peterson K, Wiecha J, Sobol AM, Dixit S, Fox MK, Laird N:
Reducing obesity via a school-based interdisciplinary intervention
among youth: Planet health. Arch Pediatr Adolesc Med 1999, 153:409-418.
31. Janz KF: Validation of the CSA accelerometer for assessing children’s
physical activity. Med Sci Sports Exerc 1994, 26:369-375.
32. Trost SG, Ward DS, Moorehead SM, Watson PD, Riner W, Burke JR: Validity
of thecomputer science and applications (CSA) activity monitor in
children. Med Sci Sports Exerc 1998, 30:629-633.
33. Janz KF, Witt J, Mahoney LT: The stability of children’s physical activity as
measured by accelerometry and self-report. Med Sci Sports Exerc 1995,
27:1326-1332.
34. Treuth MS, Schmitz K, Catellier DJ, McMurray RG, Murray DM, Almeida MJ,
Going S, Norman JE, Pate R: Defining accelerometer thresholds for
activity intensities in adolescent girls. Med Sci Sports Exerc 2004,
36:1259-1266.
35. Going SB, Loham TG, Falls HB: Body Composition Assessment. In
Fitnessgram/Activitygram 2008 Reference Guides Edited by: Welk GJ, Meredith
Francis et al. International Journal of Behavioral Nutrition and Physical Activity 2011, 8:100
/>Page 8 of 9
MD [ />FITNESSGRAM_ReferenceGuide.pdf].
36. Williams DP, Going SB, Lohman TG, Harsha DW, Srinivasan SR, Webber LS,
Berenson GS: Body fatness and risk of elevated blood pressure, total
cholesterol and serum lipoprotein ratios in children and adolescents. Am
J Pub Hea 1992, 82:358-363.
37. Mirwald RL, Baxter-Jones AD, Bailey DA, Beunen GP: An assessment of
maturity from anthropometric measurements. Med Sci Sports Exerc 2002,
34:689-694.
38. Landis JR, Koch GG: The measurement of observer agreement for
categorical data. Biometrics 1977, 33:159-174.
39. American Academy of Pediatrics, Committee of Public Education: Children,
adolescents, and television. Pediatrics 2001, 107:423-426.
40. Sturm R: Childhood obesity- what we can learn from existing data on
societal trends, part 1.[ />PMC1323315/].
41. Centers for Disease Control and Prevention: Youth risk behavior
surveillance: United States. MMWR 2009, 9:1-148.
42. Anderson DR, Field DE, Collins PA, Lorch P, Nathan JG: Estimates of young
children’s time with television: a methodological comparison of parent
reports with time-lapse VG home observations. Child Dev 1985,
56:1345-1357.
doi:10.1186/1479-5868-8-100
Cite this article as: Francis et al.: Tracking of TV and video gaming
during childhood: Iowa Bone Development Study. International Journal
of Behavioral Nutrition and Physical Activity 2011 8:100.
Submit your next manuscript to BioMed Central
and take full advantage of:
• Convenient online submission
• Thorough peer review
• No space constraints or color figure charges
• Immediate publication on acceptance
• Inclusion in PubMed, CAS, Scopus and Google Scholar
• Research which is freely available for redistribution
Submit your manuscript at
www.biomedcentral.com/submit
Francis et al. International Journal of Behavioral Nutrition and Physical Activity 2011, 8:100
/>Page 9 of 9