Báo cáo y học: " ModuleMiner - improved computational detection of cis-regulatory modules: are there different modes of gene regulation in embryonic development and adult tissues" pptx
Bạn đang xem bản rút gọn của tài liệu. Xem và tải ngay bản đầy đủ của tài liệu tại đây (816.66 KB, 17 trang )
Genome Biology 2008, 9:R66
Open Access
2008Van Looet al.Volume 9, Issue 4, Article R66
Method
ModuleMiner - improved computational detection of cis-regulatory
modules: are there different modes of gene regulation in embryonic
development and adult tissues?
Peter Van Loo
*†‡
, Stein Aerts
*†
, Bernard Thienpont
†
, Bart De Moor
‡
,
Yves Moreau
‡
and Peter Marynen
*†
Addresses:
*
Department of Molecular and Developmental Genetics, VIB, Herestraat 49, B-3000 Leuven, Belgium.
†
Department of Human
Genetics, University of Leuven, Herestraat 49, B-3000 Leuven, Belgium.
‡
Bioinformatics group, Department of Electrical Engineering (ESAT-
SCD), University of Leuven, Kasteelpark Arenberg, B-3001 Heverlee, Belgium.
Correspondence: Peter Van Loo. Email:
© 2008 Van Loo et al.; licensee BioMed Central Ltd.
This is an open access article distributed under the terms of the Creative Commons Attribution License ( which
permits unrestricted use, distribution, and reproduction in any medium, provided the original work is properly cited.
Abstract
We present ModuleMiner, a novel algorithm for computationally detecting cis-regulatory modules
(CRMs) in a set of co-expressed genes. ModuleMiner outperforms other methods for CRM
detection on benchmark data, and successfully detects CRMs in tissue-specific microarray clusters
and in embryonic development gene sets. Interestingly, CRM predictions for differentiated tissues
exhibit strong enrichment close to the transcription start site, whereas CRM predictions for
embryonic development gene sets are depleted in this region.
Background
The identification and functional annotation of transcrip-
tional regulatory sequences in the human genome is lagging
far behind the rapidly increasing knowledge of protein-
encoding genes. These transcriptional regulatory sequences
are often build up in a modular manner and exert their func-
tion in cis through the concerted binding of multiple tran-
scription factors (and co-factors), resulting in the formation
of protein complexes that interact with RNA polymerase II
[1,2]. These sequences are called cis-regulatory modules
(CRMs). In theory, these CRMs can be detected by the pres-
ence of multiple transcription factor binding sites (TFBSs). In
practice, however, reliable detection of functional TFBSs is
difficult and results in many false positives, partly because
these binding sites are too short and too degenerate [3].
Hence, the computational detection of functional regulatory
sequences in the human genome remains a formidable
challenge.
Multiple methods have been developed that aim to detect reg-
ulatory sequences computationally [4-8]. Promising and val-
idated results have been delivered mostly in model organisms
with relatively compact genomes (for example, Drosophila
melanogaster) [9-11]. In the larger human genome, deep
sequence conservation (for instance, up to zebrafish) or
extreme sequence conservation (for example, perfect conser-
vation in mouse over 200 base pairs), irrespective of TFBS
detection, remains the method of choice for approaches vali-
dating regulatory sequences in vitro or in vivo [12-14].
Although these conservation approaches are quite successful
in predicting which regions have a regulatory function, they
provide no information regarding what expression pattern
these regions produce and by which transcription factors they
are targeted.
When several similar CRMs have been characterized, and the
regulatory factors and binding sites have been elucidated, one
Published: 7 April 2008
Genome Biology 2008, 9:R66 (doi:10.1186/gb-2008-9-4-r66)
Received: 30 December 2007
Revised: 7 March 2008
Accepted: 7 April 2008
The electronic version of this article is the complete one and can be
found online at />Genome Biology 2008, 9:R66
Genome Biology 2008, Volume 9, Issue 4, Article R66 Van Loo et al. R66.2
can use this knowledge to find new examples of similar CRMs
that direct the transcription of other genes that are involved
in the same process. A number of computational methods
have been described that apply this approach [15-17]. These
methods have been highly successful [10,11,18], but in prac-
tice - apart from in Drosophila embryonic development - the
lack of available data often precludes the application of these
approaches.
When this knowledge is not available, the detection of tissue-
specific or process-specific CRMs can be tackled by looking
for recurring combinations of TFBSs in putative regulatory
regions of a set of co-expressed genes. A few methods apply-
ing this approach have been developed [19-22]. However,
partly because this is a more complex problem, these methods
have only been applied on a limited scale and few successful
predictions have been reported. To our knowledge, our Mod-
uleSearcher method [20] is the only one to have yielded
results that have undergone experimental validation [23].
Here, we develop ModuleMiner, a novel algorithm designed
to detect similar CRMs in a set of co-expressed genes, focused
on the human genome. ModuleMiner does not require prior
knowledge of regulating transcription factors or annotated
binding sites, but uses only a library of position weight matri-
ces (PWMs). Contrary to existing algorithms, which require a
priori knowledge of CRM properties (such as the length of the
CRMs or the number of binding sites) as input parameters,
ModuleMiner requires no parameters. In addition, Modu-
leMiner differs from existing similar approaches in that it
implements a whole-genome optimization strategy to look
specifically for signals that discriminate the given co-
expressed genes from all other genes in the genome. By leave-
one-out cross-validation on benchmark data, we show that
ModuleMiner outperforms other methods that computation-
ally detect CRMs. Finally, we demonstrate that ModuleMiner
can successfully detect similar CRMs in microarray clusters
with a tissue-specific expression profile, as well as in custom-
build gene sets related to specific embryonic developmental
processes. In total, ModuleMiner predicted 257 CRMs near to
the genes studied, as well as an additional 1,400 CRM predic-
tions resulting from full genome scans for new target genes.
We further analyze these CRM predictions to elucidate differ-
ences between CRMs directing transcription in differentiated
tissues and CRMs directing transcription during embryonic
development.
Results
ModuleMiner: detection of similar CRMs in a set of co-
expressed genes
We developed ModuleMiner, a novel algorithm to detect sim-
ilar CRMs in a set of co-expressed genes. ModuleMiner mod-
els similar CRMs as a combination of motifs (represented by
PWMs) in the same way as in the report by Aerts and cowork-
ers [20]. These models are called 'transcriptional regulatory
models' (TRMs) [24]. We postulate that a good TRM can
retrieve targets in the genome. Therefore, we express the fit-
ness of a TRM in terms of its target gene recovery and we
select the TRM that has maximum specificity for the given set
of co-expressed genes, using a whole-genome optimization
strategy. To determine the fitness of a TRM, each gene's
search space is first scored with the TRM, where we define a
gene's search space as the collection of all conserved noncod-
ing sequences within 10 kilobases (kb) 5' of the transcription
start site (TSS; see Materials and methods, below). These
scores are then used to rank all genes in the genome. Finally,
the ranks of the given co-expressed genes are determined,
and the probability of observing this collection of ranks by
chance is calculated using order statistics (see Materials and
methods, below). If a large part of the co-expressed genes are
ranked high, then the order statistic is highly significant, and
hence the TRM is considered to have a high fitness for mode-
ling similar CRMs that regulate these genes. ModuleMiner
searches the TRM with the most significant order statistic
(the best fitness) using a genetic algorithm (detailed in Mate-
rials and methods, below).
We introduce ModuleMiner and its rigorous validation proce-
dure using an example case study. We constructed a high-
quality set of 12 smooth muscle marker genes [25], and per-
formed leave-one-out cross-validation (LOOCV). In each val-
idation run, one gene was left out and ModuleMiner
constructed a TRM using the remaining 11 genes. This TRM
was then used to rank all genes in the genome and the posi-
tion of the left-out gene was determined. The set of 12 ranks
obtained in this way was used to calculate sensitivity/specifi-
city pairs, which were subsequently plotted on a receiver
operating characteristic (ROC) curve. We used the area under
the ROC curve (AUC) as a measure of ModuleMiner's per-
formance on this set of co-expressed genes.
We repeated the LOOCV for three sets of candidate TFBSs
(Table 1). The first set includes predicted binding sites in
human-mouse conserved noncoding sequences (CNSs),
obtained by aligning 10 kb 5' of all human-mouse orthologs
and selecting regions of at least 75% identity over a minimum
of 100 base pairs. The second set includes a refined series of
binding sites from the first set; specifically, it retains only the
PWMs for which an instance is predicted in both human and
mouse CNSs (we follow the nomenclature presented by Ber-
man and coworkers [10] and call these sites 'preserved' sites).
Finally, the third set is refined further from the second set;
specifically, the CNSs are obtained by aligning 10 kb 5' of all
human genes to 110 kb 5' + 100 kb 3' of the TSS of their mouse
orthologs (and hence correcting for possible differences in
TSS annotation). The resulting ROC curves are shown in Fig-
ure 1a. In all three cases, the AUC values are significantly
above 50% (the theoretical value obtained if the left-out genes
were ranked randomly), indicating that the TRMs obtained
are sensitive and specific in predicting CRMs near to the left-
out genes.
Genome Biology 2008, Volume 9, Issue 4, Article R66 Van Loo et al. R66.3
Genome Biology 2008, 9:R66
We observed that similar TRMs have similar fitness and sim-
ilar order statistic. The TRM that is selected by ModuleMiner
(the one that has the lowest order statistic) is surrounded by
similar TRMs with order statistics that are only slightly
larger. The selection of one TRM out of these similar TRMs is
inherently arbitrary and depends only marginally on the true
regulatory signals. To make ModuleMiner more robust to this
'noise', we cluster the top-scoring TRMs and select the most
prominent cluster instead of the single optimal TRM. We call
this cluster of TRMs a 'transcriptional regulatory global
model' (TRGM). The results of a LOOCV when using these
TRGMs (Figure 1b) show that this indeed has a positive effect
on ModuleMiner's performance: the AUCs increased by 6%
on average. Furthermore, these TRGMs provide additional
information compared with singular TRMs, because they
allow an estimate of the relative importance of each PWM
involved, as discussed below.
When comparing the performance of ModuleMiner (using
TRGMs) on the three sets of candidate binding sites, a large
difference between selecting all detected binding sites (set 1:
AUC value 84.6%) and restricting to preserved sites only (set
2: AUC value 92.8%) is apparent. Correcting for TSS differ-
ences in human and mouse (set 3: AUC value 92.5%) did not
increase this performance further. Thus, for this high-quality
set of co-expressed genes, the preservation of binding sites is
highly beneficial for efficient detection of CRMs. This strongly
suggests that for this gene set the trans-acting factors are con-
served between human and mouse.
We next applied the ModuleMiner algorithm to the full set of
12 smooth muscle marker genes, using the site preservation
measure (set 2). The resulting TRGM identifies SRF, SMAD4,
SP1, and ATF3 as the main transcription factors involved in
the co-regulation of these genes (detailed ModuleMiner out-
put is reported on our website [26]). Importantly, ModuleM-
iner implicates SRF as the most important smooth muscle
regulator, and suggests that smooth muscle specific regula-
tion often entails two or more SRF binding sites, which is in
agreement with the literature [27].
To verify the added value of the resulting combination of
PWMs over SRF alone, we manually generated a TRGM con-
taining only PWMs for SRF, and compared the performance
of this model with that of ModuleMiner. When we applied
this 'SRF only' TRGM to rank the genome, we obtained an
AUC of 79.9%, which is significantly smaller than the 92.8%
AUC of ModuleMiner (obtained in an LOOCV setting).
Table 1
Genome-wide databases of candidate transcription factor binding sites
Number Database properties Number of genes Number of regions Number of binding sites
1 Human-mouse conserved regions, 10 kilobases 5' of TSS 8,759 22,582 1,858,800
2 (1) + limited to binding sites occurring both in the human and mouse
CNS
8,759 22,582 878,338
3 (2) + correct for possible mouse TSS differences (add 100 kilobases
of mouse sequence 5' and 3')
11,653 35,021 1,316,927
CNS, conserved noncoding sequence; TSS, transcription start site.
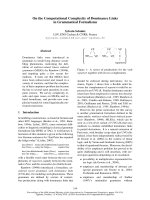
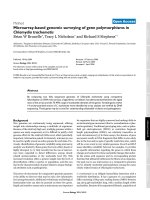
Performance of ModuleMinerFigure 1
Performance of ModuleMiner. Illustrated is the performance of
ModuleMiner on a set of smooth muscle marker genes, using the three
different sets of candidate transcription factor binding sites (TFBSs).
Receiver operating characteristic curves are shown, representing results
for leave-one-out cross-validations on the set of smooth muscle markers,
(a) using singular transcriptional regulatory models and (b) using
transcriptional regulatory global models.
TFBS set 1
TFBS set 2
TFBS set 3
(a)
1.0
0.8
0.6
0.4
0.2
0
0.2 0.4 0.6 0.8 1.0
Sensitivity
1-specificity
TFBS set 1
TFBS set 2
TFBS set 3
(b)
1.0
0.8
0.6
0.4
0.2
0
0.2 0.4 0.6 0.8 1.0
Sensitivity
1-specificity
Genome Biology 2008, 9:R66
Genome Biology 2008, Volume 9, Issue 4, Article R66 Van Loo et al. R66.4
Sensitivity to noise
To assess the performance of ModuleMiner as a function of
the composition of the input set of co-expressed genes, we
performed LOOCV on input sets that contain a varying per-
centage of genuinely co-regulated genes ('true positives'). As
true positive genes, we selected the set of ten smooth muscle
markers that share similar CRMs that can be identified by
ModuleMiner (these ten genes all are ranked within the top
7% of the genome by a LOOCV, as shown in Figure 1b). We
approximated negative genes (genes that do not contain the
smooth muscle CRM) by random genes.
In a first analysis, we kept the number of true positive genes
constant at ten, and we added a varying number of negative
genes. The decrease in performance as a function of an
increasing number of negative genes was surprisingly small
(Figure 2). Even when only 10 out of 50 genes contained the
smooth muscle CRM, ModuleMiner was able to pick up this
signal (the AUC was 85.2%, and SRF and SP1 were still iden-
tified as key factors).
In a second analysis, we kept the total number of genes con-
stant at ten, and we varied the percentage of negative genes.
We now observed a steep decrease in ModuleMiner perform-
ance as a function of an increasing percentage of negative
genes (Figure 2).
We conclude from these experiments that ModuleMiner
requires a critical mass of true positive genes for successful
detection of similar CRMs. However, when this critical mass
is present, ModuleMiner is highly robust to false-positive
genes.
Comparison with other CRM detection algorithms
We next compared ModuleMiner with other in silico
approaches for CRM detection on benchmark data. From
PAZAR [28], we selected all 'boutiques' containing annotated
regulatory regions directing expression in a particular sys-
tem: M02, muscle; M03, liver; M08, ORegAnno Stat1; and
M09, ORegAnno Erythroid. As a fifth benchmark set, we used
the 12 smooth muscle genes described above. On each of these
five sets, we compared the performance of ModuleMiner with
that of four state-of-the-art publicly available algorithms
designed to detect similar CRMs in co-expressed genes: Mod-
uleSearcher [29], CREME [19], CisModule [22], and EMC-
MODULE [30]. We also included the Clover algorithm [31],
which looks for individual over-represented TFBSs in puta-
tive regulatory sequences of a set of co-expressed genes. We
note that our analysis does not focus specifically on the
known enhancers, but in contrast we consider all CNSs in the
entire 10 kb 5' of the TSS (which may or may not contain the
known enhancer, as well as other sequences). This effectively
mimics a real-life situation, where the exact location of the
regulatory sequences is not known a priori.
The CREME algorithm was unable to identify similar CRMs
in any of the five benchmark sets, most likely in part because
of its focus on larger sets of more loosely co-expressed genes
[19]. Using the remaining algorithms, we performed LOOCV
on each of the five benchmark sets. For this LOOCV, we used
each algorithm to train a TRM or TRGM using gene sets in
which one gene is left out (see Materials and methods, below,
for details). Hence, as training data, we used all CNSs in the
10 kb 5' of the TSS of the benchmark set, except for the left-
out gene. For CisModule and EMCMODULE, the inputs were
the sequences of the CNSs; for Clover, the inputs where the
sequences of the CNSs as well as all TRANSFAC and JASPAR
vertebrate PWMs; for ModuleSearcher, the inputs were the
predicted binding sites within those CNSs, using all TRANS-
FAC and JASPAR vertebrate PWMs. The combination of
PWMs that each algorithm provided as output was used to
build a TRM or TRGM. We subsequently used the ModuleS-
canner algorithm to rank all genes in the genome based on the
predicted TRM/TRGM, and we used the results to construct
ROC curves. We used the site preservation measure (candi-
date TFBS set 2) for the ModuleMiner runs (because this was
the set in which we obtained the best results for the smooth
muscle genes). Because the other algorithms do not use site
preservation in the discovery step, we used candidate TFBS
set 1 (without preservation) also in their genome ranking
step. We also constructed random ROC curves based on
genome ranking using random TRMs (see Materials and
methods, below, for details).
Sensitivity of ModuleMiner's performance to the quality of the input genesFigure 2
Sensitivity of ModuleMiner's performance to the quality of the input genes.
The ratio of true positive genes (containing the smooth muscle cis-
regulatory module [CRM]) to negative genes (approximated by random
genes) was varied. Each time, a leave-one-out cross-validation was
performed, a receiver operating characteristic (ROC) curve was
constructed, and the area under the ROC curve (AUC) was calculated.
These AUCs were plotted as a function of the ratio negative genes/
positive genes. Because an AUC of 50% signifies random ordering of the
left-out genes (and hence indicates that no CRMs can be detected), this
value was taken as the origin on the y-axis. Blue: the number of positive
genes was kept constant at ten, and the number of negative genes was
varied. Red: the total number of genes was kept constant at ten, and the
ratio negative genes/positive genes was varied.
AUC
Number of random genes / number of smooth muscle genes
1.0
0.9
0.8
0.7
0.6
0.5
43210
Genome Biology 2008, Volume 9, Issue 4, Article R66 Van Loo et al. R66.5
Genome Biology 2008, 9:R66
On the OregAnno Erythroid benchmark set neither Modu-
leMiner nor any of the other algorithms appear to perform
better than random (Figure 3a). Because this is the smallest
set, containing only six genes with human-mouse CNSs, this
is consistent with the results we obtained in the previous sec-
tion, in which we concluded that a critical number of co-reg-
ulated genes is required for CRM detection. In contrast, on
each of the four other benchmark sets, ModuleMiner per-
forms better than random TRMs, as do some of the other
algorithms (Figure 3b-e). Comparing the performance of all
CRM detection algorithms, ModuleMiner appears to exhibit
the best performance in all four cases. Interestingly, only
ModuleMiner can compete with 'simple' TFBS over-represen-
tation in this setup, emulating a real-life situation in which
the regulatory sequences are not known. Indeed, only Modu-
leMiner outperforms Clover on four of the five benchmark
sets. On the fifth benchmark set (muscle), Clover and Modu-
leMiner seem to be closely matched, with the Clover method
showing a steeper start of the ROC curve.
The performance of the other CRM detection algorithms can
be improved by using site preservation (TFBS set 2) in the
genome ranking step (Figure 3f-i), although ModuleMiner
outperforms all other CRM detection algorithms here also,
which suggests that the TRMs predicted by ModuleMiner are
more informative or more specific than those suggested by
other methods. Candidate TFBS set 2 was not in all cases the
optimal choice for ModuleMiner; on the muscle benchmark
set, candidate TFBS set 3 performed better (Figure 3j).
We noticed that the CRM predictions ModuleMiner made on
the muscle, liver, and ORegAnno Stat1 sets correspond well
with the known regulatory elements. The TRGMs ModuleM-
iner contructed contain PWMs for SRF, MEF2, Myf and
MyoD (muscle), HNF1, HNF3, HNF4 and CEBP (liver), and
STAT (ORegAnno Stat1), even though we used all CNSs in the
10 kb upstream region. In addition, the CRM predictions
mostly overlap the true enhancer, when the real regulatory
sequence was in our CNS collection. Indeed, for the muscle
set, in 9 of the 11 cases in which the known enhancer was in
our CNS set, ModuleMiner was ably to identify this region.
For the liver set, ModuleMiner identified seven out of eight
regulatory elements (data not shown).
Detection of CRMs in microarray clusters
Realizing that clustering of microarray data provides a rich
source of large co-expressed gene sets, in which robustness to
genes that are not co-regulated ('false positive genes') is criti-
cal, our sensitivity to noise analysis above encouraged us to
apply ModuleMiner to microarray clusters on a larger scale.
The GNF SymAtlas [32] contains expression profiles of 140
human and mouse tissues. Nelander and coworkers [33]
obtained gene clusters by hierarchically clustering this data-
set, followed by a Pearson's correlation coefficient cut-off.
From this clustering, we selected all clusters with at least 25
genes in our dataset (genes with at least one CNS within 10 kb
5' of the TSS). This results in ten clusters with sizes ranging
from 26 to 214 genes. Large clusters were randomly divided in
a training set of 50 genes, and a test set containing the
remaining genes.
Because it was our goal here to identify similar CRMs within
a subset of the genes in each microarray cluster, we used a
two-step procedure. First we detected which subset of genes
potentially share CRMs, and next we detected the actual
CRMs in their upstream regions (Figure 4a). The first step
consisted of a fivefold cross-validation, where in each valida-
tion run we used ModuleMiner to train a TRGM on four-fifths
of the genes in a cluster, and next we determined which of the
other one-fifth of left-out genes were targets of the TRGM. If
the total number of true target genes among left-out genes
was not significantly higher than random, then we concluded
that ModuleMiner is unable to detect similar CRMs within
this cluster. If on the other hand there was a significant
enrichment of these true target genes, then we concluded that
ModuleMiner can detect similar CRMs, and we used these
high scoring genes in the second step. In this second step,
ModuleMiner was applied to this focused subcluster,
identifying similar CRMs that regulate these genes. As an
extra validation, LOOCV was used to confirm the presence of
similar CRMs, as done previously on the smooth muscle and
other benchmark sets.
Application of this procedure to the microarray clusters
described above resulted in successful CRM detection in nine
out of the ten clusters (Table 2 and Figure 4b). In each case,
this success was confirmed by a LOOCV on the selected sub-
cluster (all AUCs were significantly above 50%, with an aver-
age AUC of 90.3%; Figure 4c). For the TRGMs obtained for
clusters containing more than 50 genes, the number of targets
in the independent test set was determined. This was signifi-
cantly higher than random in three of the five cases (Table 2).
In total, we predicted 209 CRMs. These ModuleMiner predic-
tions can be viewed in detail on our website [26].
Detection of CRMs in embryonic development gene
sets
In the previous section we detected CRMs in microarray clus-
ters expressed in different adult tissues. Next, we aimed to
predict CRMs involved in embryonic development processes.
We constructed five gene sets involved in specific embryonic
development processes, based on the literature (Table 3).
Contrary to the previous section, in which we aimed to detect
similar CRMs in a subset of the genes in the microarray
clusters (using a two-step approach), here we can assume that
the embryonic development gene set is more focused, and
hence we can directly apply ModuleMiner to these sets (as in
our high-quality smooth muscle gene set). We performed
LOOCV, confirming that ModuleMiner was able to success-
fully detect similar CRMs in all five gene sets (Table 3).
Genome Biology 2008, 9:R66
Genome Biology 2008, Volume 9, Issue 4, Article R66 Van Loo et al. R66.6
Figure 3 (see legend on next page)
(a)
ORegAnno Erythroid
1 - specificity
Sensitivity
1.0
0.8
0.6
0.4
0.2
0
00.20.40.60.81.0
(b)
Liver
1 - specificity
Sensitivity
1.0
0.8
0.6
0.4
0.2
0
0 0.2 0.4 0.6 0.8 1.0
(c)
Muscle
1 - specificity
Sensitivity
1.0
0.8
0.6
0.4
0.2
0
0 0.2 0.4 0.6 0.8 1.0
(d)
ORegAnno Stat1
1 - specificity
Sensitivity
1.0
0.8
0.6
0.4
0.2
0
0 0.2 0.4 0.6 0.8 1.0
(e)
Smooth muscle
1 - specificity
Sensitivity
1.0
0.8
0.6
0.4
0.2
0
0 0.2 0.4 0.6 0.8 1.0
(f)
Liver
1 - specificity
Sensitivity
1.0
0.8
0.6
0.4
0.2
0
00.20.40.60.81.0
(g)
Muscle
1 - specificity
Sensitivity
1.0
0.8
0.6
0.4
0.2
0
0 0.2 0.4 0.6 0.8 1.0
(h)
ORegAnno Stat1
1 - specificity
Sensitivity
1.0
0.8
0.6
0.4
0.2
0
0 0.2 0.4 0.6 0.8 1.0
(i)
Smooth muscle
1 - specificity
Sensitivity
1.0
0.8
0.6
0.4
0.2
0
00.20.40.60.81.0
(j)
Muscle
1 - specificity
Sensitivity
1.0
0.8
0.6
0.4
0.2
0
0 0.2 0.4 0.6 0.8 1.0
Legend (a)-(i)
ModuleMiner
ModuleSearcher
CisModule
EMCMODULE
Clover
Random TRMs
TFBS set 1
TFBS set 2
TFBS set 3
Genome Biology 2008, Volume 9, Issue 4, Article R66 Van Loo et al. R66.7
Genome Biology 2008, 9:R66
Characterization of the CRMs
The TRGMs that were predicted by ModuleMiner in each of
the ten microarray clusters and each of the five embryonic
development gene sets are summarized in Tables 4 and 5.
Apart from this TRGM, ModuleMiner also provides addi-
tional information characterizing the CRMs. We shall discuss
here the results we obtained in cluster 9, which contains
genes related to cardiac muscle function.
First, ModuleMiner characterizes the given input genes,
retrieving descriptions and commonly used identifiers (for
example, HGNC) from the Ensembl database. In addition, the
Gene Ontology (GO) terms annotated to the input genes are
retrieved, and the over-represented GO terms are reported.
For the cardiac muscle subcluster 'muscle contraction'
(GO:0006936), 'muscle development' (GO:0007517), 'orga-
nogenesis' (GO:0009887), 'contractile fiber' (GO:0043292),
and 'regulation of heart contraction rate' (GO:0008016) were
among the over-represented GO terms.
Next, ModuleMiner determines the weight of each PWM in
the TRGM (see Materials and methods, below). By grouping
similar PWMs, the weight of each trans-factor involved is
determined. The cardiac muscle TRGM contains PWMs for
SRF, MEF2A, myogenin, SP3, a thyroid hormone response
element (all with weights of approximately 1), and a muscle
TATA box (with weight approximately 0.5). ModuleMiner
also displays the CRMs that it identifies on the input genes.
Figure 4d shows this for the heart muscle genes.
Because our approach uses only human and mouse sequences
to model CRMs, sequenced genomes of other species can be
used as validation data. ModuleMiner employs the rat and
dog genomes for this purpose, by checking for CRMs that fit
the obtained TRGM in rat-dog CNSs. For the cardiac muscle
genes, 11 orthologs were present in our rat-dog TFBS data-
base, seven of which were ranked within the top 10% of the
genome (P = 2.28 × 10
-5
).
Finally, ModuleMiner selects putative new target genes of the
TRGM from the complete genome. We aim to minimize noise
in these target gene predictions by using network level con-
servation [34], particularly through phylogenetic fusion of
target gene rankings. To this end, first all genes in the human-
mouse TFBS database (excluding the input genes) and all
(noninput) genes in the dog-rat TFBS database are ranked
separately. ModuleMiner then fuses these two rankings into
one global ranking using order statistics (similar to the
approach used by Aerts and coworkers [23,35]). Among the
100 top ranking new target genes of the cardiac muscle
TRGM were MYL3 ('cardiac myosin light chain 1'), MYOD1
('myoblast determination protein 1'), TNNI1 ('troponin I'),
and MYH3 ('myosin heavy chain, embryonic skeletal
muscle').
The results we obtained on all sets of co-expressed genes dis-
cussed in this work can be viewed on our website [26].
Where are the CRM predictions located?
ModuleMiner successfully detected nine sets of similar CRMs
in the ten microarray clusters and five sets of similar CRMs in
the five embryonic development gene sets. In total, 257 CRMs
were predicted. In addition to this, ModuleMiner predicted
100 new target genes of each TRGM. We next used this com-
pendium of 1,657 CRMs to examine their positions relative to
the TSSs of the genes that they regulate.
Because a gene's search space was defined as all CNSs within
10 kb 5' of the TSS, we first examined the distributions of CNS
locations, because these represent the background distribu-
tion to which the CRM locations will be compared. A first
important observation is that the CNSs are highly over-repre-
sented close to the TSS, as shown in Figure 5a,b. The type of
gene set, namely adult tissue versus embryonic development,
introduces a second CNS location bias (Figure 5c). Indeed,
the adult tissue CNS set is enriched in sequences close to the
TSS (<200 base pairs; P = 7.6 × 10
-16
by a Wilcoxon rank sum
test), whereas the embryonic development CNS set is
depleted in sequences close to the TSS and enriched in
sequences further from the TSS (2,000 to 4,000 base pairs; P
= 5.6 × 10
-7
). When evaluating each of the gene sets separately
(Figure 5f), eight of the nine adult tissue CNS sets are
enriched in sequences less than 200 base pairs from the TSS
(in six cases, this was statistically significant by a χ
2
test),
whereas all five embryonic development CNS sets are
depleted in sequences less then 200 base pairs from the TSS
(in three cases, this was statistically significant).
Next, we examine the location distribution of the CRMs that
were identified by ModuleMiner. For adult tissue genes,
CRMs are strongly over-represented close to the TSS (Figure
5d). Of these CRMs, 63% are within 200 base pairs of the TSS.
In contrast, the CRMs that ModuleMiner identified near to
the embryonic development genes are depleted close to the
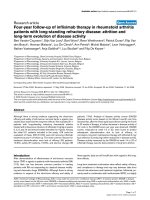
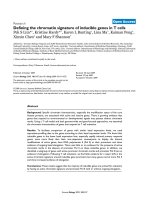
Comparison with other CRM detection algorithmsFigure 3 (see previous page)
Comparison with other CRM detection algorithms. (a-e) Receiver operating characteristic (ROC) curves for the leave-one-out cross-validation using
ModuleMiner, ModuleSearcher, CisModule, EMCMODULE, Clover, and random transcriptional regulatory models for each of the five benchmark sets:
ORegAnno Erythroid (panel a), liver (panel b), muscle (panel c), ORegAnno Stat1 (panel d) and smooth muscle (panel e). (f-i) ROC curves when using
transcription factor binding site (TFBS) preservation (TFBS set 2) in the genome ranking step for all algorithms, on the four benchmark sets that performed
above random: liver (panel f), muscle (panel g), ORegAnno Stat1 (panel h), and smooth muscle (panel i). (j) ModuleMiner performance for the three TFBS
sets on the muscle benchmark data. CRM, cis-regulatory module.
Genome Biology 2008, 9:R66
Genome Biology 2008, Volume 9, Issue 4, Article R66 Van Loo et al. R66.8
TSS and enriched further away (1,000 to 2,000 base pairs).
These conclusions remain valid even when controlling for
both biases mentioned above; comparing Figure 5d to Figure
5c (the predicted CRMs in Figure 5d can be considered a
selection from the CNS sets in Figure 5c), the enrichment of
predicted CRMs directing expression in adult tissues close to
the TSS persisted (P = 2.6 × 10
-27
). (This was calculated as fol-
lows; the distances to the TSS of the predicted CRMs and all
CNSs of the genes in the microarray clusters were ranked and
the Wilcoxon rank sum test was applied.) For the CRMs
directing expression in embryonic development, no statisti-
cally significant deviation from random selection from the
embryonic development CNS sets could be identified (P =
0.18). When considering the gene sets separately, in eight
microarray clusters expressed in adult tissues CRMs are
enriched in sequences close to the TSS (Figure 5g; this was
statistically significant when controlling for bias in six cases).
In contrast, in four embryonic development gene sets, CRMs
are depleted close to the TSS (markedly, for three of these
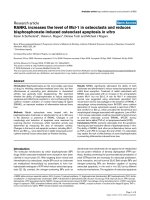
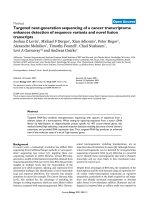
Application of ModuleMiner to microarray clustersFigure 4
Application of ModuleMiner to microarray clusters. (a) The two-step procedure used to detect similar cis-regulatory modules (CRMs) in a subset of genes
within a given microarray cluster. In the first step, a fivefold cross-validation is performed, and the number of left-out genes considered as target genes is
counted. If this number is significantly more than expected under a random distribution of the ranks, then these genes are transferred to the second step.
In this second step, ModuleMiner is used to model the similar CRMs regulating the genes in this focused subcluster. (b) Results of the first step of the
procedure in panel (a) for the ten microarray clusters and the three different sets of candidate transcription factor binding sites (TFBSs). Significantly
higher numbers of target genes among the left-out genes than randomly expected are depicted by an asterisk. Clusters 7 and 10 only contained sufficient
genes (≥ 25) in TFBS set 3 and therefore are omitted for the other two sets. (c) Leave-one-out cross-validation results on the subclusters with a significant
enrichment of target genes from panel (b). Each left-out gene was ranked using the transcriptional regulatory global model (TRGM) obtained on the
remaining genes. Next, sensitivity/specificity pairs where calculated for different detection thresholds, and these were used to construct receiver operating
characteristic (ROC) curves. The areas under these ROC curves (AUCs) were calculated and are depicted here. The colors are as in panel (b). (d)
Presented is an example of a set of similar CRMs identified by ModuleMiner. These results were obtained on the cardiac muscle genes by the procedure
depicted in panel (a). Each horizontal line represents a human-mouse conserved noncoding sequence (CNS) upstream of a gene within the cluster. The
different colored boxes represent binding sites of different transcription factors. Detailed results, including descriptions of the genes shown, and the exact
positions of the CNSs are available on our website [26].
…
Set of co-
regulated
genes
Leave out 1/5
of genes
ModuleMiner:
Train a CRM model
on the remaining
4/5 of genes
Score the full genome
and consider positions
of left-out genes
191 bp
p,v
211 bp
p
Are co-regulated genes
overrepresented in the
top 10%?
p < 0.05?
NO
YES
No similar
CRMs found
Top-scoring
genes
187 bp
p,v
ModuleMiner:
train CRM
model
+ +
Selection of genes containing similar CRMsCRM detection
Validation:
leave-one-out
cross-validation
Target genes
Search for other similar CRMs in non-target genes
(a)
(b)
(c)
(d)
TFBS set 1 TFBS set 2 TFBS set 3
TFBS set 1 TFBS set 2 TFBS set 3
Cluster
Cluster
nr of target genesAUC
0
2
4
6
8
10
12
14
16
18
12345678910
12345678910
SRF
SP-3
Myogenin
MEF2A
Thyroid hormone
response element
Muscle TATA box
****
*
*
*
*
*
*
*
1.0
0.9
0.8
0.7
0.6
0.5
Genome Biology 2008, Volume 9, Issue 4, Article R66 Van Loo et al. R66.9
Genome Biology 2008, 9:R66
sets, no CRMs were predicted within 200 base pairs of the
TSS).
A similar difference in TSS distance distribution was also
observed for the new target genes (Figure 5e). Here as well,
the distances to the TSS of the CRMs predicted to direct
expression in adult tissues were clearly nonrandomly distrib-
uted compared with all CNSs (P = 3.6 × 10
-74
by Wilcoxon
rank sum test). For the CRMs predicted to direct expression
in embryonic development, no statistically significant differ-
ence was observed (by Wilcoxon rank sum test). However,
these sequences appear to be (slightly) depleted within 200
base pairs of the TSS (P = 1.5 × 10
-4
by a χ
2
test). Considering
each of the gene sets separately (Figure 5h), in seven adult tis-
sue microarray clusters, CRMs were significantly enriched
within 200 base pairs of the TSSs, whereas for two embryonic
development gene sets CRMs were significantly depleted
close to the TSS. Although in six cases this effect was highly
significant (P < 10
-9
), it was smaller than the effect within the
clusters (compare Figures 5d and 5e).
In summary, the CRMs that ModuleMiner detected were non-
randomly positioned in the genome. CRMs predicted to direct
expression in adult tissues were highly enriched very close to
the TSS, whereas CRMs predicted to direct expression in
embryonic development were depleted very close to the TSS.
Discussion
Although the sequence of the human genome has been avail-
able for a considerable time now, our ability to chart the
regions that control gene expression is still limited. The situ-
ation appears to improve as a function of smaller genome
size. Indeed, in the Drosophila early segmentation network,
CRMs can be predicted based on known examples [10,11]. In
the yeast Saccharomyces cerevisiae, with a much smaller
genome, it is possible to go one step further and predict the
expression of genes based only on upstream sequences [36].
Here, we focus on the computational detection of CRMs in the
human genome, and hence this work makes a contribution
toward bridging this gap.
ModuleMiner detects CRMs by taking as input a set of co-
expressed genes, under the assumption that a subset of these
are co-regulated, and looking for a recurrent pattern of (com-
putationally predicted) TFBSs. The advantages of this
approach are that it does not require known examples and
that it allows prediction of a probable function for the
detected CRMs.
ModuleMiner is similar in scope to ModuleSearcher [20,29]
and CREME [19]. It differs from these previous approaches in
that ModuleMiner maximizes specificity for the given set of
co-expressed genes by performing a whole-genome optimiza-
tion. Indeed, ModuleMiner optimizes the combined rankings
of the given gene set in a ranking of the complete genome. In
addition, this approach allows comparison between TRMs
with different parameters (for example, maximum CRM
length, and number of PWMs in the TRM). Therefore, Modu-
leMiner can optimize over these parameters, and hence our
approach effectively eliminates the need for parameters
required by previous approaches.
Table 2
Summary of ModuleMiner's results for the ten microarray clusters
Cluster Annotation TFBS set Number of target genes
after cross-validation (P)
AUC on target genes Number of target
genes in independent
test set (P)
Total number of CRMs
1 Protein synthesis 1 10/50 (0.025) 0.96 14/123 (0.35) 30
2 Oocyte/fertilized egg 3 10/50 (0.025) 0.98 30/164 (8.6 × 10
-4
)43
3 Neural tissues 3 10/50 (0.025) 0.84 15/122 (0.24) 29
4 Lymphocytes 3 10/50 (0.025) 0.87 23/85 (7.0 × 10
-6
)36
5 Testis/spermatogenesis - - - - -
6 Liver 3 14/50 (2.9 × 10
-4
) 0.93 7/29 (0.022) 23
7 Mitochondrion 3 9/31 (0.0026) 0.87 - 12
8 Extracellular matrix 2 7/32 (0.036) 0.92 - 10
9 Cardiac muscle 3 17/32 (6.6 × 10
-10
)0.95 - 16
10 Energy metabolism 3 7/26 (0.012) 0.82 - 10
Transcription factor binding site (TFBS) sets: set 1 includes human-mouse conserved noncoding sequences (CNSs) 10 kilobases 5' of the
transcription start site (TSS); set 2 includes set 1 + binding site preservation; and set 3 includes set 2 + correction for TSS differences. For clusters in
which multiple TFBS sets resulted in successful cis-regulatory module (CRM) detection, only the result showing the best cross-validation
performance is shown. Genes (in the cluster) that by cross-validation were ranked within the top 10% of the genome where considered target genes
of the transcriptional regulatory global model (TRGM). The total number of CRMs constitutes all successful CRM predictions near to genes in the
cluster. CRM predictions were considered successful if the TRGM score was sufficient to rank the target gene within the top 10% of the genome. In
some cases, multiple CRMs are found that control the same target gene.
Genome Biology 2008, 9:R66
Genome Biology 2008, Volume 9, Issue 4, Article R66 Van Loo et al. R66.10
Other algorithms have been developed that aim to detect sim-
ilar CRMs in a set of co-expressed genes that (contrary to the
approaches described above) do not use a library of PWMs
[21,22,30,37]. Instead, and in addition to optimizing the
combination of motifs, these algorithms optimize the motifs
themselves. Hence, these methods attempt to solve a problem
with considerably greater complexity, resulting in lower per-
formance, as confirmed by our comparison on benchmark
data. Given the extremely poor performance of motif
detection methods in organisms other than yeast [38], we
have opted to circumvent motif optimization by using exper-
imentally determined PWMs. Note that this decision does not
necessarily limit the search to known PWMs, because librar-
ies of computationally predicted PWMs are also available (for
example, the phylofacts PWM library [39]). In addition, we
believe that with the emergence of the protein binding micro-
array technology [40], high quality PWMs will soon become
available for a large fraction of the human transcription factor
repertoire. Even though the currently available libraries of
experimental PWMs exhibit high redundancy and may con-
tain low quality PWMs, our new approach of clustering
similar TRMs is able to group redundant PWMs, and our val-
idations show that in many cases a combination of five exper-
imental PWMs can capture enough information of a CRM to
yield acceptable genome-wide specificity levels.
ModuleMiner outputs the predicted CRMs and a TRGM. This
TRGM can be considered a bag of PWMs (selected from
TRANSFAC and JASPAR), with a weight associated to each
PWM. Therefore, this TRGM not only predicts the transcrip-
tion factors that function in the process under study, but it
also allows an assessment of the relative importance of each
of these transcription factors.
TRGMs do not contain spatial relations between TFBSs
(except for the total size of the CRMs and a Boolean parame-
ter indicating whether different binding sites can overlap).
Although certain spatial relations between transcription fac-
tors working in concert are known to exist (for example
[41,42]), we did not find any reports indicating that this is the
rule rather then the exception. Therefore, we reasoned that
any such relationships should not be hard-coded into the
TRGMs, but rather would become apparent by inspection of
the predicted CRMs. Upon inspection of the predicted CRMs
presented above, no such spatial relationships surfaced.
Our method for scoring a sequence using a TRM or TRGM
(see Materials and methods, below) does not take homotypic
clustering of TFBSs into account (like hidden Markov model
based methods do [15,17,43]). However, this cooperative
binding of one transcription factor can nevertheless be mod-
eled in our framework by the construction of a TRM or TRGM
that contains multiple instances of the same PWM. Therefore,
if multiple instances of a specific transcription factor are
important for the regulation of a set of co-regulated genes,
then this is represented accordingly in the optimal model. For
example, when applying ModuleMiner to the tightly co-
expressed set of smooth muscle markers, the transcription
factor SRF occurs two or three times in each of the TRMs in
the resulting TRGM, suggesting an extensive cooperation
between SRF binding sites for smooth muscle specific tran-
scription regulation. In contrast, the SMAD4, SP1, and ATF3
PWMs occur exactly once in 97.5% of the TRMs (SMAD4 and
SP1 occur twice in 1.5% and 1% of the TRMs, respectively).
ModuleMiner takes the genomic background sequence into
account in two ways. First, a third order background model is
used in the process of annotating putative TFBSs. Second, our
optimization strategy selects the TRM (or TRGM) that opti-
mally separates the given genes (sequences) from all other
genes in the genome. Hence, our system corrects both for
local sequence properties (by the third order background
model) as for more global sequence properties (by selecting
against combinations of TFBSs that occur independently of
the given sequences).
We included all CNSs up to 10 kb 5' of the TSS in our pipeline.
Although this choice is inherently arbitrary, it is motivated by
Table 3
Summary of ModuleMiner's results for the five embryonic development gene sets
Embryonic development process TFBS set Number of target genes after
LOOCV (P)
AUC
Primary heart field [50] 1 6/7 (6.4 × 10
-6
) 0.92
Secondary heart field [50] 1 6/9 (6.4 × 10
-5
) 0.79
Neural crest cells [51] 2 6/10 (1.5 × 10
-4
) 0.86
Eye development [52] 1 10/15 (1.9 × 10
-7
) 0.79
Limb development [53] 1 10/24 (5.2 × 10
-5
) 0.77
A key review or book used as a basis for construction of the development gene set is given in the first column. The genes in each set as well as the
detailed results can be viewed at our website [26]. Transcription factor binding site (TFBS) sets: set 1 includes the human-mouse conserved
noncoding sequences (CNSs) 10 kilobases 5' of the transcription start site (TSS); set 2 includes set 1 + binding site preservation; and set 3 includes
set 2 + correction for TSS differences. For clusters where multiple TFBS sets resulted in successful cis-regulatory module (CRM) detection, only the
result showing the best cross-validation performance is shown. Genes (in the cluster) that by cross-validation where ranked within the top 10% of
the genome where considered target genes of the transcriptional regulatory global model. LOOCV, leave-one-out cross-validation.
Genome Biology 2008, Volume 9, Issue 4, Article R66 Van Loo et al. R66.11
Genome Biology 2008, 9:R66
the following arguments. First, sequences 3' of the TSS might
harbor translational regulatory signals, which we do not wish
to model here. Second, potential regulatory sequences far
upstream can be difficult to assign to a target gene. Third,
selecting 10 kb 5' of the TSS has proven to be valuable in our
previous study [20], and others have made similar choices as
well [44]. In a previous study, in which CRMs were predicted
in an unbiased way across the complete human genome [8], it
was shown that CRMs are highly depleted between 10 kb and
30 kb 5' of the TSS.
The validation framework that we use, combining genome-
wide ranking with LOOCV, could also be useful in evaluating
or comparing hypotheses regarding the working principles of
transcription regulation, and in this regard can be considered
similar in scope to CodeFinder [24]. In this work, two such
tests are implicitly performed: CRMs driving a tissue-specific
expression pattern are compared with CRMs driving an
embryonic development expression pattern; and by compar-
ing the three sets of putative TFBSs (for example, Figures 1,
3j, and 4b) the importance of binding site preservation is
evaluated, as well as the impact of a correction for differences
in TSSs between human and mouse.
Construction of a high-quality set of co-regulated genes
involved in a certain process under study is not always
straightforward. In this regard, robustness to noise in a set of
putative co-expressed genes is highly desirable in an algo-
rithm to detect similar CRMs. We found ModuleMiner to be
highly robust to the quality of this input gene set. Indeed, in
our experiments with smooth muscle marker genes we
observed that ModuleMiner was able to pick up the correct
signal even when only 10 out of 50 given genes are really co-
regulated (Figure 2). These properties of ModuleMiner
prompted us to apply the algorithm to gene sets obtained from
clustering microarray data. In nine out of ten microarray clus-
ters, ModuleMiner succeeded in finding similar CRMs in a sub-
set of the genes. Perhaps unsurprisingly, a critical mass of co-
regulated genes is required for ModuleMiner to detect similar
CRMs. However, this minimum required number of co-regu-
lated genes is sufficiently small so as not to preclude applica-
tion of the algorithm. This is illustrated both by our results
obtained on the smooth muscle genes (Figure 2) and by the
Table 4
Transcriptional regulatory global models constructed for the ten microarray clusters
Cluster Key transcription factors and binding sites in TRGM (weight)
Protein synthesis NF-Y (1.59), DEC (1.13), HIC1 (1.09), general initiator sequence (0.47), CCAAT box (0.44), TCF-4 (0.32)
Oocyte/fertilized egg T3R (1.00), NF-Y (1.00), ETS/PEA3 (0.99), MAZ (0.92), AP2α (0.78), SP1 (0.30)
Neural tissues UF1-H3β (1.13), CRE-BP/CJUN/ATF-1 (1.00), AP-2 (0.87), ETF (0.55), AP-1/NF-E2 (0.33)
Lymphocytes STAT6 (1.00), PU.1 (0.99), ETS (0.96), STAT5/STAT (0.95), SP1 (0.89)
Testis/spermatogenesis -
Liver TCF1/HNF-1 (1.00), NF-1 (1.00), C/EBP (0.99), HNF-4/COUP (0.99), PPAR/HNF-4/COUP/RAR (0.66), MYC-MAX (0.58),
PPAR (0.33)
Mitochondrion c-ETS (1.35), VDR (1.00), GATA-1/GATA-2 (1.00), ZID (0.82), AR (0.43), ROAZ (0.34)
Extracellular matrix AP-1/NF-E2/BACH1 (2.00), FOXD1 (1.00), BLIMP1 (1.00), SRF (0.70), MEF-2/RSRFC4 (0.51), STAT5/STAT6 (0.35)
Cardiac muscle SP-3 (1.00), myogenin (1.00), MEF2A (1.00), SRF (1.00), tyroid hormone receptor/RAR/RXR (0.91), muscle TATA box
(0.48)
Energy metabolism CREB/ATF/HLF (1.01), WHN (1.00), SPIB (0.71), PPARγ/RXRα (0.65), general initiator sequence (0.51), RFX (0.31)
TRGM, transcriptional regulatory global model.
Table 5
Transcriptional regulatory global models constructed for the five embryonic development sets
Development
process
Key transcription factors and binding sites in TRGM (weight)
Primary heart field D type LTRs (1.12), HAND1/TCF3 (1.01), STAT3 (0.92), STAT5A (0.89), GATA1/GATA2 (0.63), ELK1 (0.32)
Secondary heart field HNF3α (1.56), STAT5A/STAT5B (1.00), GATA2 (0.56), NFAT (0.56), GATA/GATA3 (0.48), WHN (0.35)
Neural crest cells FREAC-7 (1.00), Poly A (1.00), TBX5 (1.00), HSF (0.89), FREAC-2 (0.30)
Eye development RREB1 (1.00), IRF (0.96), POU3F2 (0.92), ZF5 (0.80), GATA/GATA1 (0.46), LMO2 (0.39), NKX6-1 (0.32)
Limb development TEF (1.00), PLZF (1.00), PAX4 (0.96), EGR (0.87), AP-2 (0.65), PBX (0.63), Ikaros 1 (0.37)
TRGM, transcriptional regulatory global model.
Genome Biology 2008, 9:R66
Genome Biology 2008, Volume 9, Issue 4, Article R66 Van Loo et al. R66.12
successful CRM detection in two small heart development
gene sets (Table 3).
Application of ModuleMiner to the smooth muscle marker
genes resulted in CRMs with multiple binding sites for SRF,
and with single binding sites for SMAD4, SP1, and ATF3.
Both SRF and SP1 have been shown to play a role in regulat-
ing smooth muscle specific expression [27]. Furthermore,
SMADs are effectors of the transforming growth factor-β sig-
naling pathway, and have been shown to work in concert with
SRF to control smooth muscle cell differentiation [45]. Mod-
uleMiner identified transcription factors known to play a key
role in other co-expressed gene sets as well. Examples are
GATA factors, NFATs and HAND1 in heart development;
HNF-1 and HNF-4 in liver-specific gene expression; PU.1 in
lymphocyte specific gene expression; and myogenin, SRF, the
thyroid hormone receptor, and MEF2 in heart-specific gene
expression.
Imposing trans-factor conservation by motif preservation
between human and mouse sequences of a CNS significantly
improved the performance of ModuleMiner on the set of
smooth muscle marker genes. A similar approach has also
been shown to improve CRM detection performance in the
Drosophila early segmentation gene network [10]. When we
applied ModuleMiner to the microarray clusters and the
embryonic development gene sets, in some cases this trans-
factor conservation also increased performance (microarray
clusters 6, 7 and 9, and the neural crest cell gene set), but in
other cases it did not.
Figure 5
TFBS set 1 and 2
TFBS set 3
(a)
(b)
(c)
(d)
(e)
(f)
(g)
(h)
0
1,000
2,000 3,000
4,000 5,000
6,000 7,000
8,000
9,000 10,000
TFBS set 1 and 2
TFBS set 3
<200 200 - 1,000 1,000 - 2,000 2,000 - 4,000 4,000 - 7,000 >7,000
<200 200 - 1,000 1,000 - 2,000 2,000 - 4,000 4,000 - 7,000 >7,000
<200 200 - 1,000 1,000 - 2,000 2,000 - 4,000 4,000 - 7,000 >7,000
<200 200 - 1,000 1,000 - 2,000 2,000 - 4,000 4,000 - 7,000 >7,000
Adult tissues
Embryonic development
Adult tissues
Embryonic development
Adult tissues
Embryonic development
Cl. 1
Cl. 2
Cl. 3
Cl. 4 Cl. 6
Cl. 7
Cl. 8
Cl. 9
Cl. 10
prim HF
sec HF
NCC
eye
limb
all CNSs
all CNSs
all CNSs
Cl. 1
Cl. 2
Cl. 3
Cl. 4
Cl. 6
Cl. 7
Cl. 8
Cl. 9
Cl. 10
prim HF sec HF
NCC
eye
limb
Cl. 1
Cl. 2
Cl. 3 Cl. 4
Cl. 6
Cl. 7
Cl. 8
Cl. 9
Cl. 10
prim HF
sec HF
NCC
eye
limb
Distribution of distance to transcription start site for CNSs and predicted CRMsFigure 5
Distribution of distance to transcription start site for CNSs and predicted
CRMs. (a) All human-mouse conserved noncoding sequences (CNSs) in
transcription factor binding site (TFBS) sets 1 and 2 (both are based on the
same set of CNSs) and in TFBS set 3. (b) The distribution from panel (a),
when divided into six unequal bins. (c) Distribution of all CNSs upstream
of genes within the microarray clusters (of genes expressed in different
adult tissues) and the embryonic development gene sets, where CRMs
could successfully be detected (Tables 2 and 3), divided into the same six
bins as under panel (b). (d) Distribution of the distance to transcription
start for the CRMs that ModuleMiner identified near to the genes from
panel (c). (e) Distribution of distance to transcription start for the CRMs
that ModuleMiner identified in a whole genome scan (genes in panel (d)
were removed, such that only new target genes where represented here).
Note that panels (b) to (e) are drawn to the same scale. (f) Portion of
CNSs near to the genes in the different microarray clusters and embryonic
development sets that is located within 200 base pairs (bp) of the
transcription start site. (g) Portion of predicted CRMs near to the genes
in the different microarray clusters and embryonic development sets that
is located within 200 bp of the transcription start site. (h) Portion of
CRMs predicted in a whole-genome scan for the transcriptional regulatory
global model built for the different gene sets that is located within 200 bp
of the transcription start site. The blue line in panels (f) to (h) indicates
the portion of all CNSs (within 10 kilobases 5' of all human genes) that is
less then 200 base pairs of the transcription start site. CI, Confidence
Interval.
Genome Biology 2008, Volume 9, Issue 4, Article R66 Van Loo et al. R66.13
Genome Biology 2008, 9:R66
Correcting for possible differences in TSS in human and
mouse by a three-step alignment procedure (see Materials
and methods, below) resulted in increased performance for
most of the microarray clusters, but not for the development
gene sets. This marked difference may be related to the differ-
ent locations of the detected CRMs in these two different
systems.
We observed a significant difference in the locations of the
CRMs ModuleMiner predicted to direct expression in adult
tissues and the CRMs ModuleMiner predicted to direct
expression in embryonic development. CRMs driving tissue-
specific expression are highly over-represented within 200
base pairs of the TSS. In contrast, CRMs driving expression in
embryonic development are more evenly distributed in the 10
kb sequences we considered, and appear to be under-repre-
sented within 200 base pairs of the TSS. These results suggest
that transcription regulation of tissue-specific expression is
mainly exerted by proximal promoters, whereas transcription
regulation of expression during embryonic development
appear mainly to be exerted by more distal enhancers.
ModuleMiner can be applied to three conceptually different
tasks: prediction of transcription factors that play a role in
regulating a set of co-regulated genes; prediction of regula-
tory regions; and predictions of new target genes of a TRGM.
It is important to appreciate that the accuracy of predictions
differs between those tasks. Although exact performance sta-
tistics can only be obtained through careful experimental
testing of our predictions, which is outside the scope of the
present study, the results we obtained in this work can be
used to provide rough estimates of the predictive accuracy.
When we applied ModuleMiner to the two well studied
benchmark sets, we obtained HNF1, CEBP, HNF3, GATA1,
PAX6 and HNF4 for the liver benchmark set; and MZF1,
PPARγ, SRF, MEF2, the Epstein-Barr virus transcription
factor R, MYF, and MYOD for the muscle benchmark set.
Comparing this with the literature [4,46] and with the PWM
libraries we use, we obtain a sensitivity of 70% (7/10 known
PWMs are recovered), a specificity of 99.6% (630/633 [liver]
and 619/621 [muscle] probably incorrect PWMs are rejected),
and a positive predictive power of 62% (8/13 total predicted
PWMs are correct). These values need to be regarded with
some reservations when extrapolating to other cases, because
both liver and muscle are well studied systems for which high-
quality PWMs are available. Nevertheless, we can conclude
that ModuleMiner is quite accurate in selecting PWMs/tran-
scription factors that play a key role in regulating the genes
under study.
Regarding detection of regulatory sequences, ModuleMiner
was able to detect 16 out of 24 known muscle/liver enhancers,
when a total of 24 predictions were made. This repesents a
sensitivity of 67% and a positive predictive power of 67%,
although we emphasize that this last value is an underesti-
mate because some of our predictions may be yet unknown
enhancers. Notwithstanding some reservations on extrapo-
lating these data, we conclude that the predictive accuracy of
ModuleMiner for detection of regulatory regions (CRMs)
near to a set of co-regulated genes is quite high.
Regarding the predictive accuracy of ModuleMiner for the
detection of new target genes given a TRGM, the results of our
LOOCV procedure can provide some estimates. From the
resulting ROC curves, one can see that for a sensitivity of
50%, the specificity is about 90%, and for a sensitivity of 80%
the specificity is about 80%, although the differences between
different gene sets can be large. However, typically only a few
dozen new target genes can be tested, and thus specificity may
not be high enough to select the right targets from the com-
plete genome. In our previous study [23] we confirmed that
the predictive accuracy of new target genes is quite low,
although we showed it to be detectably present. We note that
in that study we used our previous ModuleSearcher algo-
rithm, which was shown here to have lower performance than
ModuleMiner. In addition, ModuleMiner's use of network
level conservation between human-mouse and rat-dog pre-
dictions of new target genes might increase performance.
Finally, the results we obtained in the TSS distribution of the
CRMs predicted near to the new target genes are consistent
with these performance predictions; Figures 5e and 5h show
a similar trend to that in Figures 5d and 5g but to a lesser
extent, hence pointing to a substantial amount of noise, but
also indicating that a signal can be picked up even in a whole-
genome scan.
Conclusion
We present ModuleMiner, the first algorithm to detect CRMs
in the human genome that is based on whole-genome optimi-
zation. ModuleMiner is generally applicable and outperforms
other similar approaches to detecting CRMs on benchmark
data. In addition, ModuleMiner can detect similar CRMs in
noisy sets of co-expressed genes, such as microarray clusters.
We successfully applied the algorithm to sets of genes
expressed in adult tissues and sets of genes expressed in
embryonic development processes. We show that CRMs pre-
dicted to regulate genes expressed in adult tissues are highly
over-represented within 200 base pairs of the TSS, whereas
CRMs predicted to regulate genes involved in embryonic
development processes are depleted within this region. These
findings suggest that expression in adult tissues is mainly
directed by proximal promoters, whereas expression in
embryonic development is more often regulated by distal
enhancers.
Materials and methods
Construction of three sets of candidate TFBSs
We constructed three sets of genome-wide candidate TFBSs
in human-mouse CNSs. The first set contains all predicted
binding sites in all CNSs. Sequences 10 kb 5' (+ 50 base pairs
Genome Biology 2008, 9:R66
Genome Biology 2008, Volume 9, Issue 4, Article R66 Van Loo et al. R66.14
3') of the TSS of all human genes and their mouse orthologs
were obtained from Ensembl (version 36). When another
gene was encountered, only the sequence up to that gene was
included. CNSs were selected by LAGAN alignments [47].
Thresholds were set at 75% conservation over at least 100
base pairs. TFBS predictions were performed using MotifS-
canner [48], with the prior set at 0.2. Both TRANSFAC [49]
(version 9.4) and JASPAR [39] were used as PWM libraries.
The second set aims to restrict the candidate binding sites by
enforcing that the regulatory factors should be conserved.
This is achieved by selecting only binding sites in each human
region for transcription factors for which we also detect bind-
ing sites in the orthologous mouse region (preserved sites).
We note that this constraint does not require the binding sites
to be conserved or that they should align.
In the construction of the third set we aimed to correct for dif-
ferences in human and mouse TSSs, and for possible annota-
tion errors of TSSs. To this end, we extended the mouse
sequences used in the alignments by 100 kb in both direc-
tions. Alignment errors were kept in check by applying a
multi-step alignment procedure. The human 10 kb sequence
was aligned to the 10 kb mouse sequence (alignment A), the
mouse sequence extended by 10 kb in both directions
(alignment B), and the mouse sequence extended by 100 kb in
both directions (alignment C). If CNSs were predicted in
alignment A, then we assumed that the correct orthologous
region in the mouse is not off by more then 10 kb, and hence
we used the CNSs from alignment A supplemented by all
additional CNSs from alignment B. CNSs that were truncated
in alignment A because they extended over the sequence bor-
ders were replaced by their counterpart from alignment B. If
no CNSs were predicted in alignment A, then we reasoned
that the correct orthologous region in the mouse might be off
by more then 10 kb, and we used the CNSs from alignment C.
Here also, for each CNS (in human) we selected only pre-
served binding sites.
The same procedure was used with the dog and rat sequences
to create sets of candidate TFBSs corresponding to the three
human-mouse sets. Because neither dog nor rat could serve
as a reference species, we did not extend the sequences in the
dog-rat candidate TFBS set that corresponds to human-
mouse set 3.
Transcriptional regulatory models
We model similar CRMs in a set of co-expressed genes by
TRMs. These TRMs are parameterized as in the report by
Aerts and coworkers [20]. A TRM is a combination of PWM
instances (up to six), supplemented by three parameters: the
maximum length of CRMs; a Boolean parameter stating
whether different binding sites can overlap or not; and a
Boolean parameter that indicates whether incomplete mod-
ules will be penalized. Given a TRM and a sequence, a score
S
seq
can be calculated, as detailed in the report by Aerts and
coworkers [20]. A TRM may contain multiple instances of one
specific PWM. In the calculation of S
seq
, each PWM in the
TRM is matched to at most one binding site; thus, if a PWM
occurs twice, up to two binding sites for the corresponding
transcription factor can be taken into account. We assign a
score S
g
to a gene by taking the maximum of S
seq
for all CNSs
of that gene. The S
g
scores for the given set of co-regulated
genes are used to determine a 'fitness score' of a TRM. This
fitness score of a TRM for a given set of co-expressed genes is
determined by the positions of the co-expressed genes in a
ranking of S
g
for all genes in the genome. We use order statis-
tics to assign a probability to the combination of ranks of the
given co-expressed genes (using the numerical approach
detailed in the report by Aerts and coworkers [23]). Hence,
the resulting P value represents how well that TRM models
the given set of co-expressed genes, compared with all other
genes in the genome. We use 1 minus that P value as the fit-
ness score for the TRM.
The ModuleMiner algorithm
ModuleMiner uses a genetic algorithm to find the TRM with
the optimal fitness score. At the onset, a starting population
of TRMs is obtained by running our ModuleSearcher algo-
rithm [29] using many different combinations of parameters.
This initial step is not absolutely required (one can start from
a population of randomly generated CRMs), but it provides a
speed advantage. These TRMs obtained by ModuleSearcher
are assigned a fitness score, and the 200 best scoring TRMs
are retained as starting population for the ModuleMiner
genetic algorithm. During each 'generation' of the algorithm,
200 new individuals (TRMs) are generated (based on the
TRM population at that time) and added to the population.
This population of 400 TRM is then required to compete (by
fitness score), and the 200 best scoring TRMs are retained.
This procedure is repeated until the stop criterion is reached
(at least 300 generations and at most 1,000 generations).
Generation of new individuals (TRMs) is done using two 'par-
ent' TRMs randomly selected from the population. Each of
the TRM parameters (number of PWMs, length, overlap, and
penalization) is determined by random selection from both
parents, allowing a small probability of mutation (each
parameter is set to a random value with a probability of 0.1).
Subsequently, PWMs are selected at random from both
parents. Here also, each PWM can be 'mutated' (replaced by
a PWM randomly selected from TRANSFAC and JASPAR)
with a probability of 0.1. As the stop criterion, we use
homogeneity of the population: if more than 80% of the
TRMs can be grouped into one TRGM (see below) and at least
300 generations have passed, then the algorithm is stopped.
If this stop criterion is not reached, then the algorithm is
stopped after 1,000 generations. The parameters of the Mod-
uleMiner genetic algorithm (for example, population size,
mutation probability, and so on) were selected by optimizing
for speed. The convergence of the algorithm is highly insensi-
tive to these parameters over a wide range, and sensitivity of
Genome Biology 2008, Volume 9, Issue 4, Article R66 Van Loo et al. R66.15
Genome Biology 2008, 9:R66
speed to these parameter settings is also limited (data not
shown).
Transcriptional regulatory global models
Aiming to minimize the sensitivity of our models of similar
CRMs to noise in TFBS predictions, we constructed compos-
ite models (TRGMs) from multiple high-scoring TRMs. To
this end, similar TRMs are clustered, and the largest cluster is
returned as resulting TRGM. TRMs were clustered when the
CRMs they predict near to the high scoring genes (out of the
given set of co-expressed genes) occur in the same CNS. As a
cut-off for determining which genes are among the 'high scor-
ing genes', we used the top 2.5% in a ranking of the complete
genome.
Scoring a sequence with a TRGM is performed by scoring this
sequence for each TRM within the TRGM, subsequently nor-
malizing this score (maximum CNS score = 1), and finally
adding the normalized TRM scores.
Because a TRGM is a collection of TRMs and TRMs each con-
tain a collection of PWM instances, TRGMs are also collec-
tions of PWMs. In addition, a weight can be assigned to each
PWM in the TRGM, quantifying the significance of the PWM
for the process under study. This weight of a PWM is calcu-
lated as follows: for each TRM in the TRGM, the number of
instances of that PWM is counted, and this number is aver-
aged over all of the TRMs in the TRGM.
Performance comparison on benchmark data
Four benchmark datasets containing annotated regulatory
regions directing expression in a particular system were
selected from PAZAR [28]. We selected all human genes (or
human orthologs) from each of these 'boutiques'. The regula-
tory sequence search space was defined as all CNSs within 10
kb 5' of the TSS (as throughout our study). We used this
search space for all algorithms, except CREME [19], for which
only the online version was available that by default uses one
CNS within 1.5 kb of the TSS. Because the other CRM detec-
tion algorithms had multiple parameters (absent in Modu-
leMiner), these parameters were set to default options. For
the ModuleSearcher algorithm [29], we used the same
parameters as in the cell cycle case study reported [20]. For
CisModule [22] and EMCMODULE [30] we used the default
parameter settings. We used Clover [31] as follows; for each
PWM found to be over-represented, we constructed a TRM
(with parameters; no overlap between binding sites, no
penalization, and a maximum distance of 1,000 base pairs),
and this way we constructed TRGMs containing enriched
PWMs reported by Clover. We also generated 100 random
TRMs (combinations of three to six PWMs with randomly
generated parameters) and we used these to rank the genes of
each benchmark set, as a proxy for a method unable to detect
similar CRMs.
Availability
ModuleMiner can be accessed at our website [26]. A stand-
alone version is available upon request.
Abbreviations
AUC, area under the ROC curve; CNS, conserved noncoding
sequence; CRM, cis-regulatory module; GO, Gene Ontology;
kb, kilobases; LOOCV, leave-one-out cross-validation; PWM,
position weight matrix; ROC, receiver operator characteris-
tic; TFBS, transcription factor binding site; TRGM, transcrip-
tional regulatory global model; TRM, transcriptional
regulatory model; TSS, transcription start site.
Authors' contributions
PVL, SA, and PM conceived and designed the experiments.
PVL performed the experiments. PVL and SA analyzed the
data. PVL, SA, BT, BDM, and YM contributed reagents/mate-
rials/analysis tools. PVL wrote the paper. All authors read
and approved the final manuscript.
Acknowledgements
PVL is supported by a PhD fellowship and SA by a postdoctoral fellowship
of the Research Foundation - Flanders (FWO). BT is supported by a PhD
fellowship of the IWT. Research performed by YM and BDM is supported
by the following: (i) Research Council KUL: GOA AMBioRICS, CoE EF/05/
007 SymBioSys, several PhD/postdoctoral and fellow grants; (ii) Flemish
Government: FWO: PhD/postdoctoral grants, projects G.0241.04 (Func-
tional Genomics), G.0499.04 (Statistics), G.0232.05 (Cardiovascular),
G.0318.05 (subfunctionalization), G.0553.06 (VitamineD), G.0302.07 (SVM/
Kernel), research communities (ICCoS, ANMMM, MLDM); IWT: PhD
Grants, GBOU-McKnow-E (Knowledge management algorithms), GBOU-
ANA (biosensors), TAD-BioScope-IT, Silicos; SBO-BioFrame; Belgian Fed-
eral Science Policy Office: IUAP P6/25 (BioMaGNet, Bioinformatics and
Modeling: from Genomes to Networks, 2007-2011); EU-RTD: ERNSI:
European Research Network on System Identification; FP6-NoE Biopat-
tern; FP6-IP e-Tumours, FP6-MC-EST Bioptrain, FP6-STREP Strokemap.
This research was conducted utilizing high-performance computational
resources provided by the University of Leuven.
We are grateful to Irina Balikova, Boyan Dimitrov, and Koen Devriendt for
help with the construction of the development gene sets. The authors
declare no competing financial interests.
References
1. Davidson EH: Genomic Regulatory Systems: Development and Evolution
San Diego, CA: Academic Press; 2001.
2. Balmer JE, Blomhoff R: Anecdotes, data and regulatory
modules. Biol Lett 2006, 2:431-434.
3. Wasserman WW, Sandelin A: Applied bioinformatics for the
identification of regulatory elements. Nat Rev Genet 2004,
5:276-287.
4. Wasserman WW, Fickett JW: Identification of regulatory
regions which confer muscle-specific gene expression. J Mol
Biol 1998, 278:167-181.
5. Elnitski L, Hardison RC, Li J, Yang S, Kolbe D, Eswara P, O'Connor
MJ, Schwartz S, Miller W, Chiaromonte F: Distinguishing regula-
tory DNA from neutral sites. Genome Res 2003, 13:64-72.
6. Siepel A, Bejerano G, Pedersen JS, Hinrichs AS, Hou M, Rosenbloom
K, Clawson H, Spieth J, Hillier LW, Richards S, Weinstock GM, Wil-
son RK, Gibbs RA, Kent WJ, Miller W, Haussler D: Evolutionarily
conserved elements in vertebrate, insect, worm, and yeast
genomes. Genome Res 2005, 15:1034-1050.
Genome Biology 2008, 9:R66
Genome Biology 2008, Volume 9, Issue 4, Article R66 Van Loo et al. R66.16
7. Hallikas O, Palin K, Sinjushina N, Rautiainen R, Partanen J, Ukkonen E,
Taipale J: Genome-wide prediction of mammalian enhancers
based on analysis of transcription-factor binding affinity. Cell
2006, 124:47-59.
8. Blanchette M, Bataille AR, Chen X, Poitras C, Laganiere J, Lefebvre C,
Deblois G, Giguere V, Ferretti V, Bergeron D, Coulombe B, Robert
F: Genome-wide computational prediction of transcriptional
regulatory modules reveals new insights into human gene
expression. Genome Res 2006, 16:656-668.
9. Yuh CH, Brown CT, Livi CB, Rowen L, Clarke PJ, Davidson EH:
Patchy interspecific sequence similarities efficiently identify
positive cis-regulatory elements in the sea urchin. Dev Biol
2002, 246:148-161.
10. Berman BP, Pfeiffer BD, Laverty TR, Salzberg SL, Rubin GM, Eisen MB,
Celniker SE: Computational identification of developmental
enhancers: conservation and function of transcription factor
binding-site clusters in Drosophila melanogaster and Dro-
sophila pseudoobscura. Genome Biol 2004, 5:R61.
11. Schroeder MD, Pearce M, Fak J, Fan H, Unnerstall U, Emberly E,
Rajewsky N, Siggia ED, Gaul U: Transcriptional control in the
segmentation gene network of Drosophila. PLoS Biol 2004,
2:E271.
12. Nobrega MA, Ovcharenko I, Afzal V, Rubin EM: Scanning human
gene deserts for long-range enhancers. Science 2003, 302:413.
13. Woolfe A, Goodson M, Goode DK, Snell P, McEwen GK, Vavouri T,
Smith SF, North P, Callaway H, Kelly K, Walter K, Abnizova I, Gilks
W, Edwards YJ, Cooke JE, Elgar G: Highly conserved non-coding
sequences are associated with vertebrate development. PLoS
Biol 2005, 3:e7.
14. Pennacchio LA, Ahituv N, Moses AM, Prabhakar S, Nobrega MA,
Shoukry M, Minovitsky S, Dubchak I, Holt A, Lewis KD, Plajzer-Frick
I, Akiyama J, De VS, Afzal V, Black BL, Couronne O, Eisen MB, Visel
A, Rubin EM: In vivo enhancer analysis of human conserved
non-coding sequences.
Nature 2006, 444:499-502.
15. Rajewsky N, Vergassola M, Gaul U, Siggia ED: Computational
detection of genomic cis-regulatory modules applied to body
patterning in the early Drosophila embryo. BMC Bioinformatics
2002, 3:30.
16. Berman BP, Nibu Y, Pfeiffer BD, Tomancak P, Celniker SE, Levine M,
Rubin GM, Eisen MB: Exploiting transcription factor binding
site clustering to identify cis-regulatory modules involved in
pattern formation in the Drosophila genome. Proc Natl Acad Sci
USA 2002, 99:757-762.
17. Sinha S, van NE, Siggia ED: A probabilistic method to detect reg-
ulatory modules. Bioinformatics 2003, 19(suppl 1):i292-i301.
18. Halfon MS, Grad Y, Church GM, Michelson AM: Computation-
based discovery of related transcriptional regulatory mod-
ules and motifs using an experimentally validated combina-
torial model. Genome Res 2002, 12:1019-1028.
19. Sharan R, Ovcharenko I, Ben-Hur A, Karp RM: CREME: a frame-
work for identifying cis-regulatory modules in human-mouse
conserved segments. Bioinformatics 2003, 19(suppl 1):i283-i291.
20. Aerts S, Van Loo P, Thijs G, Moreau Y, De Moor B: Computational
detection of cis-regulatory modules. Bioinformatics 2003,
19(suppl 2):II5-II14.
21. Thompson W, Palumbo MJ, Wasserman WW, Liu JS, Lawrence CE:
Decoding human regulatory circuits. Genome Res 2004,
14:1967-1974.
22. Zhou Q, Wong WH: CisModule: de novo discovery of cis-regu-
latory modules by hierarchical mixture modeling. Proc Natl
Acad Sci USA 2004, 101:12114-12119.
23. Aerts S, Lambrechts D, Maity S, Van Loo P, Coessens B, De Smet F,
Tranchevent LC, De Moor B, Marynen P, Hassan B, Carmeliet P,
Moreau Y: Gene prioritization through genomic data fusion.
Nat Biotechnol 2006,
24:537-544.
24. Philippakis AA, Busser BW, Gisselbrecht SS, He FS, Estrada B, Michel-
son AM, Bulyk ML: Expression-guided in silico evaluation of
candidate cis regulatory codes for Drosophila muscle founder
cells. PLoS Comput Biol 2006, 2:e53.
25. Nelander S, Mostad P, Lindahl P: Prediction of cell type-specific
gene modules: identification and initial characterization of a
core set of smooth muscle-specific genes. Genome Res 2003,
13:1838-1854.
26. ModuleMiner: Computational Detection of Cis-Regulatory
Modules [ />27. Kumar MS, Owens GK: Combinatorial control of smooth mus-
cle-specific gene expression. Arterioscler Thromb Vasc Biol 2003,
23:737-747.
28. Portales-Casamar E, Kirov S, Lim J, Lithwick S, Swanson MI, Ticoll A,
Snoddy J, Wasserman WW: PAZAR: a framework for collection
and dissemination of cis-regulatory sequence annotation.
Genome Biol 2007, 8:R207.
29. Aerts S, Van Loo P, Moreau Y, De Moor B: A genetic algorithm
for the detection of new cis-regulatory modules in sets of
coregulated genes. Bioinformatics 2004, 20:1974-1976.
30. Gupta M, Liu JS: De novo cis-regulatory module elicitation for
eukaryotic genomes. Proc Natl Acad Sci USA 2005, 102:7079-7084.
31. Frith MC, Fu Y, Yu L, Chen JF, Hansen U, Weng Z: Detection of
functional DNA motifs via statistical over-representation.
Nucleic Acids Res 2004, 32:1372-1381.
32. Su AI, Wiltshire T, Batalov S, Lapp H, Ching KA, Block D, Zhang J,
Soden R, Hayakawa M, Kreiman G, Cooke MP, Walker JR, Hogenesch
JB: A gene atlas of the mouse and human protein-encoding
transcriptomes. Proc Natl Acad Sci USA 2004, 101:6062-6067.
33. Nelander S, Larsson E, Kristiansson E, Mansson R, Nerman O, Sig-
vardsson M, Mostad P, Lindahl P: Predictive screening for regula-
tors of conserved functional gene modules (gene batteries)
in mammals. BMC Genomics 2005,
6:68.
34. Pritsker M, Liu YC, Beer MA, Tavazoie S: Whole-genome discov-
ery of transcription factor binding sites by network-level
conservation. Genome Res 2004, 14:99-108.
35. Aerts S, van HJ, Sand O, Hassan BA: Fine-tuning enhancer models
to predict transcriptional targets across multiple genomes.
PLoS ONE 2007, 2:e1115.
36. Beer MA, Tavazoie S: Predicting gene expression from
sequence. Cell 2004, 117:185-198.
37. Grad YH, Roth FP, Halfon MS, Church GM: Prediction of similarly
acting cis-regulatory modules by subsequence profiling and
comparative genomics in Drosophila melanogaster and D.
pseudoobscura. Bioinformatics 2004, 20:2738-2750.
38. Tompa M, Li N, Bailey TL, Church GM, De MB, Eskin E, Favorov AV,
Frith MC, Fu Y, Kent WJ, Makeev VJ, Mironov AA, Noble WS, Pavesi
G, Pesole G, Regnier M, Simonis N, Sinha S, Thijs G, van HJ, Vanden-
bogaert M, Weng Z, Workman C, Ye C, Zhu Z: Assessing compu-
tational tools for the discovery of transcription factor
binding sites. Nat Biotechnol 2005, 23:137-144.
39. Vlieghe D, Sandelin A, De Bleser PJ, Vleminckx K, Wasserman WW,
van RF, Lenhard B: A new generation of JASPAR, the open-
access repository for transcription factor binding site
profiles. Nucleic Acids Res 2006, 34:D95-D97.
40. Mukherjee S, Berger MF, Jona G, Wang XS, Muzzey D, Snyder M,
Young RA, Bulyk ML: Rapid analysis of the DNA-binding specif-
icities of transcription factors with DNA microarrays. Nat
Genet 2004, 36:1331-1339.
41. Fickett JW: Coordinate positioning of MEF2 and myogenin
binding sites. Gene 1996, 172:GC19-GC32.
42. Papatsenko D, Levine M: A rationale for the enhanceosome and
other evolutionarily constrained enhancers. Curr Biol 2007,
17:R955-R957.
43. Frith MC, Li MC, Weng Z: Cluster-Buster: finding dense clusters
of motifs in DNA sequences. Nucleic Acids Res 2003,
31:3666-3668.
44. Chang LW, Nagarajan R, Magee JA, Milbrandt J, Stormo GD: A sys-
tematic model to predict transcriptional regulatory mecha-
nisms based on overrepresentation of transcription factor
binding profiles. Genome Res 2006, 16:405-413.
45. Nishimura G, Manabe I, Tsushima K, Fujiu K, Oishi Y, Imai Y, Mae-
mura K, Miyagishi M, Higashi Y, Kondoh H, Nagai R: DeltaEF1
mediates TGF-beta signaling in vascular smooth muscle cell
differentiation. Dev Cell 2006, 11:93-104.
46. Krivan W, Wasserman WW: A predictive model for regulatory
sequences directing liver-specific transcription. Genome Res
2001, 11:1559-1566.
47. Brudno M, Do CB, Cooper GM, Kim MF, Davydov E, Green ED,
Sidow A, Batzoglou S: LAGAN and Multi-LAGAN: efficient
tools for large-scale multiple alignment of genomic DNA.
Genome Res 2003, 13:721-731.
48. Aerts S, Thijs G, Coessens B, Staes M, Moreau Y, De Moor B: Tou-
can: deciphering the cis-regulatory logic of coregulated
genes. Nucleic Acids Res 2003, 31:1753-1764.
49. Matys V, Fricke E, Geffers R, Gossling E, Haubrock M, Hehl R, Hor-
nischer K, Karas D, Kel AE, Kel-Margoulis OV, Kloos DU, Land S,
Lewicki-Potapov B, Michael H, Munch R, Reuter I, Rotert S, Saxel H,
Scheer M, Thiele S, Wingender E: TRANSFAC: transcriptional
regulation, from patterns to profiles. Nucleic Acids Res 2003,
31:374-378.
Genome Biology 2008, Volume 9, Issue 4, Article R66 Van Loo et al. R66.17
Genome Biology 2008, 9:R66
50. Buckingham M, Meilhac S, Zaffran S: Building the mammalian
heart from two sources of myocardial cells. Nat Rev Genet
2005, 6:826-835.
51. Stoller JZ, Epstein JA: Cardiac neural crest. Semin Cell Dev Biol
2005, 16:704-715.
52. Graw J: The genetic and molecular basis of congenital eye
defects. Nat Rev Genet 2003, 4:876-888.
53. Epstein CJ, Erickson BP, Wynshaw-Boris A: Inborn Errors of Develop-
ment: The Molecular Basis of Clinical Disorders of Morphogenesis New
York, NY: Oxford University Press; 2004.