Báo cáo y học: "Dynamic instability of the major urinary protein gene family revealed by genomic and phenotypic comparisons between C57 and 129 strain mice" ppt
Bạn đang xem bản rút gọn của tài liệu. Xem và tải ngay bản đầy đủ của tài liệu tại đây (818.82 KB, 16 trang )
Genome Biology 2008, 9:R91
Open Access
2008Mudgeet al.Volume 9, Issue 5, Article R91
Research
Dynamic instability of the major urinary protein gene family
revealed by genomic and phenotypic comparisons between C57 and
129 strain mice
Jonathan M Mudge
*
, Stuart D Armstrong
†
, Karen McLaren
*
,
Robert J Beynon
†
, Jane L Hurst
‡
, Christine Nicholson
*
,
Duncan H Robertson
†
, Laurens G Wilming
*
and Jennifer L Harrow
*
Addresses:
*
Wellcome Trust Sanger Institute, Wellcome Trust Genome Campus, Hinxton, Cambridge, CB10 1SA, UK.
†
Proteomics and
Functional Genomics Group, Department of Veterinary Preclinical Science, University of Liverpool, Crown Street and Brownlow Hill,
Liverpool, L69 7ZJ, UK.
‡
Mammalian Behavior and Evolution Group, Department of Veterinary Preclinical Science, University of Liverpool,
Leahurst, Neston, CH64 7TE, UK.
Correspondence: Jonathan M Mudge. Email:
© 2008 Mudge et al.; licensee BioMed Central Ltd.
This is an open access article distributed under the terms of the Creative Commons Attribution License ( which
permits unrestricted use, distribution, and reproduction in any medium, provided the original work is properly cited.
Mouse major urinary proteins<p>Targeted sequencing, manual genome annotation, phylogenetic analysis and mass spectrometry were used to characterise major uri-nary proteins (MUPs) and the <it>Mup</it> clusters of two strains of inbred mice.</p>
Abstract
Background: The major urinary proteins (MUPs) of Mus musculus domesticus are deposited in
urine in large quantities, where they bind and release pheromones and also provide an individual
'recognition signal' via their phenotypic polymorphism. Whilst important information about MUP
functionality has been gained in recent years, the gene cluster is poorly studied in terms of
structure, genic polymorphism and evolution.
Results: We combine targeted sequencing, manual genome annotation and phylogenetic analysis
to compare the Mup clusters of C57BL/6J and 129 strains of mice. We describe organizational
heterogeneity within both clusters: a central array of cassettes containing Mup genes highly similar
at the protein level, flanked by regions containing Mup genes displaying significantly elevated
divergence. Observed genomic rearrangements in all regions have likely been mediated by
endogenous retroviral elements. Mup loci with coding sequences that differ between the strains
are identified - including a gene/pseudogene pair - suggesting that these inbred lineages exhibit
variation that exists in wild populations. We have characterized the distinct MUP profiles in the
urine of both strains by mass spectrometry. The total MUP phenotype data is reconciled with our
genomic sequence data, matching all proteins identified in urine to annotated genes.
Conclusion: Our observations indicate that the MUP phenotypic polymorphism observed in wild
populations results from a combination of Mup gene turnover coupled with currently unidentified
mechanisms regulating gene expression patterns. We propose that the structural heterogeneity
described within the cluster reflects functional divergence within the Mup gene family.
Published: 28 May 2008
Genome Biology 2008, 9:R91 (doi:10.1186/gb-2008-9-5-r91)
Received: 23 January 2008
Revised: 7 April 2008
Accepted: 28 May 2008
The electronic version of this article is the complete one and can be
found online at />Genome Biology 2008, 9:R91
Genome Biology 2008, Volume 9, Issue 5, Article R91 Mudge et al. R91.2
Background
Communication between conspecifics mediates such interac-
tions as mate choice, parental care and territory defense.
Whilst higher primates employ vocalization and visual dis-
play for these purposes, many other mammals communicate
chiefly by the use of chemical messengers in the form of scent
[1]. Human urination performs a purely excretory function;
the urine of the house mouse Mus musculus domesticus, in
contrast, is replete with liver-expressed major urinary pro-
teins (MUPs), encoded by a multigene family (Mup genes) on
chromosome 4 [2,3]. Notably, the human genome contains a
single Mup pseudogene [4].
In mice, urinary MUPs are key semiochemicals in several fac-
ets of non-overlapping M. m. domesticus behavior, including
both male to male and male to female interactions [5-13].
MUPs are characterized as an eight stranded beta-barrel
structure that encloses a hydrophobic pocket, which in turn
binds male specific pheromones 2-sec-butyl 4,5-dihydrothia-
zole (thiazole) and 3,4-dehydro-exo-brevicomin (brevicomin)
[14-16]. Sequestration of volatile molecules within MUPs
delays their evaporation from a scent mark, such that a
deposit is detectable for hours as opposed to seconds [17]. In
addition to a role in pheromone release, MUPs also commu-
nicate information directly. In wild mice, the MUP profile is
stable and highly polymorphic: 8 to 14 MUPs are typically
detected in each adult individual by electrophoretic separa-
tion, with only certain close relatives excreting the same set of
molecules [3,9,12,18]. Selective cross-breeding of wild mice
and the manipulation of MUP profiles using recombinant
molecules have allowed us to conclude that mice remember
and distinguish between the profiles of conspecifics; MUPs
thus convey an individual recognition signal [6,9,19]. How-
ever, certain MUPs are also present in female urine, though at
lower concentrations [3,20], and mice avoid inbreeding with
very close relatives sharing the same MUP phenotype [12].
Females also preferentially associate with Mup heterozygous
males [13]. The efficiency of pheromone binding varies dra-
matically between specific proteins [21,22], suggesting that
the gene cluster contains divisions of functionality that are
currently uncharacterized. Finally, not all MUPs are excreted
in urine, with the transcription of specific Mup genes having
been detected in mammary, parotid, sublingual, submaxillary
and lachrymal glands [22-24]. The function of such non-uri-
nary MUPs is poorly understood, although it is possible to
envisage similar communication roles between mother and
offspring, delivered through milk, saliva or even tears.
The extreme heterogeneity of the MUP profile in wild mice
has only recently been established as most laboratory work
has focused on inbred strains, typically C57BL/6J (hence-
forth B6) from the C57-related strain genealogy and BALB/c
from the Castle's mice lineage [25]. The MUP profiles of
inbred mice do not vary appreciably between individual
adults of the same sex and strain, although the B6 and BALB/
c strain profiles are distinct [16]. However, our understanding
of the genomic organization of the Mup gene cluster lags
behind our knowledge of protein functionality, essentially
due to complexities in obtaining contiguous genome
sequence over the region; the genomic information that has
been gleaned was largely generated during the pre-genome
sequencing era [26-28]. As such, it is unclear whether the dis-
tinct phenotypic profiles of individual mice result from genic
polymorphism or variation in gene expression patterns, or
perhaps a combination of the two. Little is known about the
evolution of the Mup gene family, in particular regarding the
relationship between urinary MUPs and non-urinary MUPs,
and between those MUPs that do and do not exhibit sexually
dimorphic expression. It is anticipated that an understanding
of the evolution of the Mup cluster will, in turn, offer insights
into the population dynamics of MUP heterogeneity.
We report here targeted sequencing, detailed annotation and
phylogenetic analysis in an in-depth genomic analysis of the
Mup region of B6 mice. The architecture of the cluster is rec-
onciled with urinary protein expression data, and we propose
a functional divergence within the gene family linked to
organizational heterogeneity, which in turn reflects differing
modes and tempo of evolution. We have also generated a
comparable amount of genomic sequence and new protein
phenotype data from 129 strain mice. These data allow us to
develop a model in which ongoing Mup genomic instability
facilitates phenotypic variation, and ultimately drives the
evolution of mouse behavior.
Results
Analysis of B6 and 129S7 genomic sequences
Whilst efforts to close all remaining sequence gaps in the
mouse genome are ongoing, a targeted attempt to improve
the B6 tile path across the Mup cluster was made as part of
this study. The selection of bacterial artificial chromosome
(BAC) clones from FingerPrinted Contig (FPC) proved to be
partially successful [29], with BACs CT572146 and CR550303
added. However, a parallel strategy based around the
sequencing of B6 fosmid ends from the WIBR-1 library
proved unsuccessful (data not shown). The mapping difficul-
ties result from the high level of sequence conservation within
the repeat elements (see below), and they are not unprece-
dented; many of the remaining euchromatic sequence gaps in
both the mouse and human genomes are found within regions
containing high-identity sequence repeats, often linked to
gene families (unpublished data and [30]). The difficulties
faced here are therefore symptomatic of a wider problem in
genome sequencing, the solution to which may depend on the
further development of new or existing technologies such as
optical mapping [31]. At present we do not speculate as to the
size of the sequence gaps. The current 'finished' tile path for
this region can be viewed in Ensembl as part of the mouse
NCBIm36 assembly [32].
Genome Biology 2008, Volume 9, Issue 5, Article R91 Mudge et al. R91.3
Genome Biology 2008, 9:R91
Figure 1a displays our manual annotation of the Mup cluster
of the B6 genome, this being done in accordance with the cri-
teria of the Vega genome browser resource [33] (see Materials
and methods). There are 19 predicted genes and 18 loci that
are pseudogenes (variously due to frameshifts, exon deletions
and stop codons). However, the presence of three gap regions
within the tiling path indicates that the full complement of
Mup loci is not yet represented. The aligned protein transla-
tions from each predicted functional Mup are presented in
Additional data file 1. The first approximately 30 amino acids
of each MUP is a signal peptide sequence, excised from the
mature protein. The following discussions discount this
sequence, although observed variation in these signals may
have unappreciated roles in, for example, protein localization
[34].
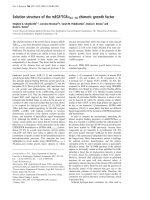
A neighbor-joining tree of B6 Mup loci was constructed using
intronic sequences (Figure 2). Three points of particular
interest stand out. Firstly, the distinct clade marked A con-
sists of the 13 predicted genes that co-localize within the cen-
tral portion of the cluster (Figure 1a); we refer to these as
central loci. Assuming a mouse/rat divergence of 12-24 mil-
lion years ago (Mya) and an average of 0.166 substitutions per
neutral site between loci within the mouse lineage [35], the
timing of the oldest duplication event within this clade is pre-
dicted at 1.2-2.4 Mya. Secondly, the pseudogenes present
within the central region also cluster together (clade B), sug-
gesting their propagation occurred by the serial duplication of
an existing pseudogene. Finally, in contrast, the remaining
genes and pseudogenes form distinct isolated nodes, and
these loci flank the central genes on the periphery of the
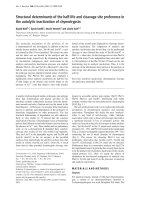
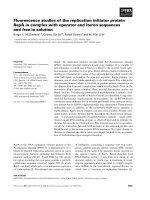
Schematic view of (a) B6 and (b) S7 Mup clustersFigure 1
Schematic view of (a) B6 and (b) S7 Mup clusters. The tiling path of BAC clones is indicated by black lines with accession numbers listed. Predicted genes
are represented by triangles, pseudogenes by rectangles. Predicted genes are numbered from the 5' direction independently in both strains; official names
acquired by certain Mups based on cDNA sequences are listed as appropriate. Pseudogenes are listed alphabetically. Open triangles within the S7 sequence
represent gene loci with CDSs that differ from their B6 counterparts, or in the case of gene 5 have no equivalent locus. The gray background shading
within the center of each cluster contains those B6 genes and pseudogenes (and S7 equivalents) that form distinct clades within the phylogenetic analysis
presented in Figure 2; the loci within the unshaded peripheral regions form isolated nodes. The calculated weight of the mature protein derived from each
gene in B6 is indicated, with masses of non-equivalent S7 genes also being listed. Masses that correspond to mass spectrometry peaks identified in Figure 5
are highlighted in bold. The protein corresponding to B6 gene 18 has been identified by other methods (Figure 6); we predict that the calculated mass of
the protein does not reflect the urinary mass due to the occurrence of glycosylation (see Results). B6 gene 11 matches closely to an additional protein
mass we have previously identified in fractionated urine [21] (see Results). There are three non-equivalent sequence gaps within the central regions of
both B6 and S7; the ordering of the central contigs presented here is arbitrary. The S7 genomic sequence includes the Tscot and Zfp37 loci, which flank
the cluster in B6 (not shown), indicating that the start and end of the cluster are present. Ignoring gap regions, the B6 cluster is 1.56 Mb in size, the S7
cluster 0.72 Mb.
AL831738
AL929376
AL772327
CR589880
BX950196
BX001066
BX470151
AL772344
BX088584
AL683829
1
2
3
A
4
B
7
E
89
G
12
K
13
L
14
M
15
N
16
OP Q R S1718 19
BX470228
CR847872
5
C
CR550303
CT990634
CT990636
CT990633
CT990635
CU104690
CU041261
CT572146
6
D
HIJ
10 11
78EF9GH101112
D
3
4
A
18,693.8
(b)
S7
(a)
B6
CU075549
1
2
Mup4 Mup2 Mup5
18,956.3
Mup3
F
5
6
B
C
Central region Peripheral region 2
18,816.4 18,644.8 18,692.8 18,664.8 18,692.9 18,707.9 18,681.9 18,712.8 18,682.8 18,863.1 18,893.2 19,109.4
18,984.5
18,695.8
18,698.9 18,896.3
18,893.2
19,061.318,644.8
Peripheral region 1
Genome Biology 2008, 9:R91
Genome Biology 2008, Volume 9, Issue 5, Article R91 Mudge et al. R91.4
cluster; we refer to these as peripheral loci. The timing of the
oldest divergence amongst the lineage of these genes is esti-
mated at 11.2-22.4 Mya between genes 16 and 19; the timing
of the minimum at 4.4-8.8 Mya between genes 18 and 19. The
topology of this intronic tree is recapitulated by a phyloge-
netic analysis based on coding sequence (CDS; data not
shown); the central gene CDSs share an average nucleotide
identity of 99.2%, and the peripheral genes 88.2%.
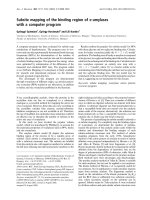
Phylogenetic analysis of B6 Mup lociFigure 2
Phylogenetic analysis of B6 Mup loci. This unrooted tree was constructed using intron 2, which has an average size of 766.9 bp. Nodes with a bootstrap
support of less than 700/1,000 replicates are marked with an asterisk, with the exception of those nodes within the clades marked 'A' and 'B' which are, in
general, poorly supported. Numbers and letters at each node refer to genes and pseudogenes, respectively, as annotated in Figure 1a. Pseudogenes O and
P are not present as these partial loci do not contain an adequate portion of intron 2; similar phylogenetic analysis with different sequence indicates that
these pseudogenes also form isolated nodes (data not shown).
19
18
1
Q
17
R
16
S
J
C
M
H
D
I
B
L
N
A
G
E
K
2
3
12
5
14
11
10
4
6
7
9
15
13
8
1,000
738
1,000
975
876
1,000
923
Clade B
Clade A
*
*
Genome Biology 2008, Volume 9, Issue 5, Article R91 Mudge et al. R91.5
Genome Biology 2008, 9:R91
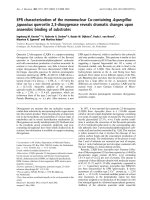
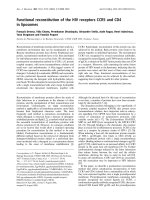
Figure 3 shows dot-plot analyses of the proximal (Figure 3a)
and distal (Figure 3b) contigs of the Mup cluster. Both con-
tain a transition towards the center of the cluster from a
region of low structural definition into a lattice-like array of
homogenized sequence. The array comprises the tandem
duplication of 14 complete or partial (due to sequence gaps)
80 kb inverted-duplication cassettes, which contain in each
complete case a predicted gene and a pseudogene pair corre-
sponding to the loci in clades A and B, respectively, from Fig-
ure 2. The average base-pair sequence identity approximates
to 98% between cassettes, although sub-regions of alignment
are frequently identical over stretches of several kilobases.
Dot-plot analysis of the 23 kb of sequence flanking the break-
point between gene 4 and pseudogene B, which lie on adja-
cent cassettes, is presented in Additional data file 2. The
breakpoint corresponds precisely to the location of a murine
endogenous retrovirus (ERV), modified into an inverted
duplication. This same sequence conformation is observed
between each of the central array cassettes. Provirus elements
are known to mediate non-allelic homologous recombination
(NAHR); the male-infertility linked AZFa microdeletions on
human chromosome Y, for example, are caused by NAHR
between HERV15 elements [36]. We thus predict that the
central cassette repeat unit was formed by recombination
between nearby ERV elements.
We have sequenced and annotated seven BACs from the
genome of the 129S7/AB2.2 inbred mouse strain (henceforth
S7). The 129 lineage diverged from the C57-related lineage
early in the 20th century in a manner that was poorly docu-
mented [25]. However, recent investigations have confirmed
that the parental line was not inbred before divergence, and
subsequent inbreeding of the separated lineages has fixed dis-
tinct patterns of wild genetic variation [37]; differing genomic
segments of C57, 129 mice and other lineages originate vari-
ously from M. m. musculus, M. m. domesticus and M. m. cas-
taneus subspecies [38,39]. It is clear that the essential
architecture of the B6 Mup cluster is conserved in S7 (Figure
1b). However, five of the twelve S7 gene loci have either amino
acid substitutions compared with their corresponding B6
genes or else do not have equivalent loci; these differences are
discussed alongside the protein phenotype data below.
Analysis of B6 and 129S5 phenotypic profiles
The protein content of mouse urine is almost exclusively
MUPs, expressed at high concentrations. Accordingly, we
Self comparison of (a) B6 proximal contig AL181738 to CR847872 and (b) distal contig BX001066 to AL683829Figure 3
Self comparison of (a) B6 proximal contig AL181738 to CR847872 and (b) distal contig BX001066 to AL683829. Genes and pseudogenes are annotated
as in Figure 1. Loci that form isolated nodes in the phylogeny presented in Figure 2 are boxed in white; those genes and pseudogenes that form respective
clades marked A and B in Figure 2 are boxed in gray.
446,118 bp 842,038 bp
12 435AB C 1213141516 171819KL M NOPQRS
Central regionPeripheral region 1 Peripheral region 2
(a) (b)
Genome Biology 2008, 9:R91
Genome Biology 2008, Volume 9, Issue 5, Article R91 Mudge et al. R91.6
have developed a phenotypic survey based on electrospray
ionization of the protein mixture, generating a complex and
overlapping set of multiply charged ions that can be deconvo-
luted to yield a mass profile of the urinary MUPs. The resolu-
tion of this method is ±2 Da, which is inadequate to resolve
proteins containing, for example, an Asp/Asn substitution,
but which allows many proteins to be unambiguously identi-
fied. Although the relative intensities of each peak can be
taken as a semi-quantitative index of abundance, we caution
against over-interpretation of the profiles in this regard, as
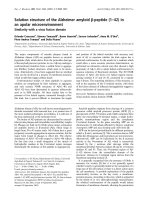
ESI-MS spectra of MUP isoforms in urine samples according to sex and strainFigure 4
ESI-MS spectra of MUP isoforms in urine samples according to sex and strain. Black lines show average for (a) male B6 (n = 5), (b) female B6 (n = 8), (c)
male BALB/c (n = 5), (d) female BALB/c (n = 7), and circles show individual values for the relative intensity of each major peak (expressed relative to the
base peak, the highest peak in each spectrum, which is set to 1). The mass spectra for a male and female S5 are shown shaded in gray in (c,d), respectively.
A duplicate analysis on male and female S5 mice, non-sibling to those above, produced identical results within the boundaries of measurement error. Black
arrowheads on the x-axis indicate predicted masses from the B6 genome analysis; unfilled arrowheads additional masses from the S7 genome analysis.
Gray arrows above the x-axis indicate known +98 Da adducts of major mass peaks. No consistent peaks were detectable in the range 18,900-19,200 Da
(Additional data file 4). The spectra for each individual sample from B6, 129 and BALB/c mice are shown in Additional data file 5.
B6 males
B6 females
BALB/c and S5 males
BALB/c and S5 females
0.0
0.2
0.4
0.6
0.8
1.0
0.0
0.2
0.4
0.6
0.8
1.0
18,600
18,700
18,800
18,900
0.0
0.2
0.4
0.6
0.8
1.0
18,709
18,693
18,645
18,893
Relative intensity
Mass (Da)
0.0
0.2
0.4
0.6
0.8
1.0
18,600
18,700
18,800
18,900
0.0
0.2
0.4
0.6
0.8
1.0
18,645
18,693
18,709
Relative intensity
Mass (Da)
18,893
0.0
0.2
0.4
0.6
0.8
1.0
18,600
18,700
18,800
18,900
18,893
18,709
18,693
18,645
Relative intensity
Mass (Da)
0.0
0.2
0.4
0.6
0.8
1.0
18,600
18,700
18,800
18,900
0.0
0.2
0.4
0.6
0.8
1.0
0.0
0.2
0.4
0.6
0.8
1.0
18,893
1
8,709
18,693
18,645
Relative intensity
Mass (Da)
(a)
(b)
(c)
(d)
Genome Biology 2008, Volume 9, Issue 5, Article R91 Mudge et al. R91.7
Genome Biology 2008, 9:R91
MUP expression is subject to developmental and endocrino-
logical control and differences between individuals of the
same sex and strain in the relative amounts of individual
MUPs are evident (Figure 4).
Figure 4 shows average processed electrospray ionization
(ESI) mass spectra derived from the urine of adult male and
female B6 mice (Figure 4a,c) and male and female BALB/c
mice (Figure 4b,d); these spectra match our previously
reported results [16,21]. Previously unreported spectra
obtained from two male and two female adult 129S5 (hence-
forth S5) urinary samples are superimposed onto the BALB/c
data. The S5 strain is closely related to S7; the lineages were
separated in 1987 from the ancestral inbred 129/Sv stock,
with the latter undergoing a mutation in the hypoxanthine
guanine phosphoribosyl transferase 1 locus [25]. Neither of
these 129 lineages has been outbred with wild mice or crossed
with other inbred strains since their separation. Although
mice inbreeding programs are designed to minimize genetic
drift, this process undoubtedly occurs at low levels both
between and within specific lineages [40,41]. We do not,
therefore, reject out of hand the possibility that there is minor
Mup genomic variation either within B6 and BALB/c or
between S5 and S7.
The spectra from the S5 males comprised three MUPs, corre-
sponding within 1 Da to the three BALB/c peaks at 18,645 Da,
18,693 Da and 18,709 Da, whilst the spectra from the females
of both of the strains contained two MUPs of masses 18,693
Da and 18,709 Da. As well as equivalent peaks at 18,645 Da,
18,709 Da and 18,693 Da, B6 male mice excrete a mass of
18,893 Da not observed in S5 or BALB/c. The genomic anno-
tation of B6 and S7 Mup genes presented in Figure 1 allows us
to reconcile the urinary MUPs we have identified in Figure 4.
This preliminary relationship is summarized below. We have
also examined the transcriptional profile of these loci by com-
parison against the GenBank sequence database [42].
Observed mass 18,645 Da
MUPs of this mass, observed in all three strains, match to the
calculated mass of 18,644.8 Da for B6 and S7 gene 3, which
have identical translations. The protein is predominantly
expressed in males, but there is some evidence of low expres-
sion (typically <5%) in females (Figure 4b,d). There is exten-
sive transcriptional support for this locus from liver-derived
libraries of B6, FVB/N (a distinct lineage from 129/BALB/c
and C57 mice [25]) and BALB/c strains.
Observed mass 18,709 Da
MUPs of this mass, observed in both sexes of all three strains,
are matched to gene 8 in B6 (18,707.9 Da), which lacks tran-
scriptional support from any strain. There is no correspond-
ing gene in the S7 genomic sequence at present; we predict
this locus resides within a gap region.
Observed mass 18,693 Da
MUPs of this mass, identified in both sexes of all three strains,
can be matched to seven of the central array genes of B6 (4, 6,
7, 9, 12, 14, 15), five of which (6, 9, 12, 14, 15) have identical
translations except for their signal peptides (Additional data
file 1). Genes 4 and 7 have predicted masses that differ by less
than 1 Da from both each other and that of the five identical
translations; such proteins are indistinguishable at the intact
protein level by the analysis conducted here. However, in pre-
vious work combining ESI mass spectrometry (ESI-MS) with
anion exchange chromatography we observed that this
18,693 spectral peak in BALB/c actually consists of two MUP
species that can be separated by their charge; we thus now
predict that these distinct proteins are derived from central
array genes that differ by one or few amino acid substitutions
[16]. We did not find evidence for the similar excretion of
charge variants in B6. However, we characterized individual
anion exchange fractions from B6 urine and identified a pro-
tein mass at 18,713 that had co-eluted with the 18,693 Da
material [21]; we now link this protein mass to B6 gene 11
(calculated mass 18,712.8 Da). Mass 18,693 corresponds to S7
genes 4, 6, and 7. The majority of gene loci from both B6 and
S7 are supported by transcriptional evidence, invariably from
liver-derived libraries. Note that B6 gene 4 and S7 gene 4 dif-
fer by a single amino acid substitution: a Gln/Glu change at
position 13 (Additional data file 1); the S7 gene 4 has a trans-
lation identical to that of B6 genes 6, 9, 12, 14 and 15.
Observed mass 18,893 Da
MUPs of mass 18,893 Da correspond to gene 17 in B6
(18,893.2 Da); the protein is predominantly expressed in B6
males (Figure 4a,b) and is thus sexually dimorphic. This locus
is supported by cDNA Em:BC089613, derived from B6 male
liver, and Em:BC092096, derived from FVB/N male liver.
The absence of this protein was previously noted in the urine
of 6 out of 84 male wild mice [21], and in this report the pro-
tein mass is undetected in the urine of S5 and BALB/c mice of
both sexes. This S5 result was surprising, since S7 gene 10 has
an identical CDS to B6 gene 17 (Additional data file 1). Also,
S7 gene 9 is equivalent in location to B6 pseudogene Q, yet
this locus has a CDS identical to that of B6 gene 17/S7 gene 10.
We further investigated the relationship between these four
18,893-associated loci in order to explain this non-conform-
ity.
B6 pseudogene Q is classified as such due to the loss of 20 bp
of sequence within exon 4; this deletion has been confirmed
by checking the original whole-genome shotgun data across
this region [43]. A dot-plot comparison of the two 18,893-
associated B6 duplication regions is displayed in Additional
data file 3. Ignoring the presence of a unique IAPLTR-1 retro-
transposon within pseudogene Q, it is clear that the loci were
duplicated as part of a larger event involving 29 kb of
sequence. The proximal breakpoint occurs within the solitary
long terminal repeat of an IAPLTR2 element, whilst the
downstream breakpoint occurs within an ERV element
Genome Biology 2008, 9:R91
Genome Biology 2008, Volume 9, Issue 5, Article R91 Mudge et al. R91.8
homologous to those associated with the central array dupli-
cations (Additional data file 2). Over the proximal 22 kb the
nucleotide identity between the two regions averages as
99.6%; after this point the similarity drops abruptly, averag-
ing at 92.2% over the final 7 kb. The point of transition occurs
795 bp in the 5' direction from the transcriptional start site,
and it does not correspond to any known transposable ele-
ments or repetitive sequence. This pattern of nucleotide iden-
tity could be explained by the occurrence of a 22 kb
duplication on top of the site of a pre-existing duplication
event. The genomic sequence of S7 contains the same dupli-
cation architecture (not shown).
We examined the DNA sequence up to 5 kb upstream of these
four loci in order to identify changes to potential promoter
elements. Figure 5 displays a portion of the alignment of the
sequences immediately upstream of the transcriptional start
site. The functional B6 gene 17 contains one notable differ-
ence: the presence of an extra 13 [A]s and a nearby C/A sub-
stitution within an A-rich site 30 bp upstream of the TATA-
box element. We observe that similar (though non-identical)
A-rich sites are present in the same location at each predicted
Mup locus, and their presence and putative functionality have
previously been highlighted in the equivalent rat gene family
[44,45]. These elements do not appear to be protein binding
sites. Instead, they may act as spacer elements, affecting tran-
scriptional efficiency by adjusting the distance between the
TATA-box and upstream control elements.
Protein corresponding to B6 gene 18
B6 gene 18/S7 gene 11 has extensive support for liver tran-
scription from both B6 and FVB/N mice, although the calcu-
lated mass of 18,956.3 Da is not observed by mass
spectrometry. The inability to observe this mass probably
stems from the fact that the sequence contains a potential N-
linked glycosylation site at Asn
66
(62
AFVENITVLENSLVFK77, tryptic peptide T5) that would, if
modified, increase the mass. However, we have isolated and
identified this protein in male B6 urine using a combination
of gel electrophoresis, tandem mass spectrometry and pep-
tide mass fingerprinting (Figure 6). A minor protein species is
evident in native gel electrophoresis as a low mobility band,
and on SDS-PAGE as a higher mass band (Figure 6a). In both
instances, the bands could be excised and digested with
trypsin or endopeptidase LysC, generating comprehensive
peptide mass fingerprints that permitted unambiguous iden-
tification of the protein as that encoded by gene 18. Tandem
mass spectrometry of fragment ions allowed recovery of pep-
tide sequence data; representative data for one such tryptic
fragment (T16: ENIIDLTNVNR, m/z 1,300.7) confirm unam-
biguously the identity of this protein. Confirmation of the gly-
cosylation status was provided by treatment with
endoglycosaminidase, after which the low mobility/high
mass band on SDS-PAGE disappeared, consistent with it
being glycosylated. Although present at a comparatively low
concentration in urine (less than 2% of total urinary MUP
protein), this peripheral MUP appears to be sexually dimor-
phic since it cannot be detected in female urine. We have not
yet examined the presence of the equivalent gene product in
129 or BALB/c mice.
Eight Mup loci lack corresponding mass spectrometry
data
There are eight predicted genes across B6 and S7 that do not
correspond to mass spectrometry peaks in either strain (or
have corresponding proteins identified through our other
Alignment of promoter regions of mass 18,893-associated lociFigure 5
Alignment of promoter regions of mass 18,893-associated loci. The alignment ends immediately prior to the predicted common transcriptional start site of
Mup loci. The first underlined region indicates a C/A substitution followed by an additional 13 A residues present in B6 gene 17. Similar though non-
identical A-rich regions are found in the equivalent location at each Mup loci. The second underlined region is the TATA-box sequence, common to all
Mup loci.
S7 gene9 CTTGGCCTCTAATCAATAAATGAAAGAACATTCCACAAAGCCTGATGGAAGTAGACCGAT 60
S7 gene10 CTTGGCCTCTAATCAATAAATGAAAGAACATTCCACAAAGCCTGATGGAAGTAGACCGAT 60
B6 pseudoQ CTTGGCCTCTAATCAATAAATGAAAGAACATTCCACAAAGCCTGATGGAAGTAGACCGAT 60
B6 gene17 CTTGGCCTCTAATCAATAAATGAAAGAACATTCCACAAAGCCTGATGGAAGTAGACCGAT 60
S7 ACCAGAAGTAAAAAAAAAAAAAAAAAAAAAACAA CAAAAAACAAAAA 107
S7 ACCAGAAGTAAAAAAAAAAAAAAAAAAAAAACAA CAAAAAACAAAAA 107
B6 ACCAGAAGTAAAAAAAAAAAAAAAAAAAAAACAA CAAAAAACAAAAA 107
B6 ACCAGAAGTAAAAAAAAAAAAAAAAAAAAAAAAAAAAAAAAAAAAAACAAAAAACAAAAA 120
S7 AACACCGAACCCAGAGAGTATATAAGTACAAGCAAAGGAGCTGGGGTG 155
S7 AACACCGAACCCAGAGAGTATATAAGTACAAGCAAAGGAGCTGGGGTG 155
B6 AACACCGAACCCAGAGAGTATATAAGTACAAGCAAAGGAGCTGGGGTG 155
B6 AACACCGAACCCAGAGAGTATATAAGTACAAGCAAAGGAGCTGGGGTG 168
1
2
gene9
gene10
pseudoQ
gene17
gene9
gene10
pseudoQ
gene17
Genome Biology 2008, Volume 9, Issue 5, Article R91 Mudge et al. R91.9
Genome Biology 2008, 9:R91
methodologies detailed above). Interestingly, three of these
genes do have predicted masses for which we have readily
detected closely matching spectra of 18,666 and 18,682 in a
parallel analysis on wild-derived M. m. domesticus mice
(unpublished data and [46]). These are B6 central array genes
5 (calculated weight 18,664.8 Da), 10 (18,681.9 Da), and 13
(18,682.8 Da), each of which lacks transcriptional support.
This suggests that these loci are not active at detectable levels
in B6 or S7, but are in certain wild individuals. In contrast, we
have never observed a protein mass corresponding to S7 gene
5 (predicted 18,698.9 Da), which has two amino acid substi-
tutions not present in any B6 loci: Asp/Val at position 34 and
Ser/Arg at position 128 (Additional data file 1). However,
both of these positions are variant in other B6 urinary pro-
teins with alternative substitutions, raising the possibility
that the two sites display functional polymorphism. This S7
gene is supported by a single EST, Em:BI256026, derived
from FVB/N liver.
Strikingly, the four remaining genes make up six of the genes
located within the peripheral regions of both strains. Two of
these genes have previously been described as expressing
non-urinary MUPs. Transcription of the B6 gene 1/S7 gene 1
has been described in lachrymal and parotid gland tissue
[23], and the set of cDNAs and ESTs corresponding to this
locus in GenBank are limited to these tissues. The second is
B6 gene 16/S7 gene 8, for which the S7 and B6 CDS differ in
three amino acid positions. The S7 form of the locus is
identical to BALB/c cDNA Em:M16360, a major transcript in
the submaxillary gland [24]; again, there is no liver transcrip-
tional support in GenBank. This is the only MUP to lack a
tyrosine residue at position 121 within the internal binding
cavity of the protein. This residue may have a direct role in lig-
and binding [22,47], raising the possibility that the submaxil-
lary protein might have profoundly altered ligand specificity,
or may operate in the absence of bound ligand.
The functional status of the two remaining loci is unclear. B6
gene 2/S7 gene 2 has two associated ESTs, Em:CF894970 and
Em:AV585390, derived from distinct undifferentiated
embryo stem cell libraries, although the protein has never
been identified experimentally. Finally, B6 gene 19/S7 gene
12, which differ in one amino acid position, lack the non-cod-
ing final exon of other Mup genes, suggesting they may be
pseudogenes in spite of their intact CDS. However, FVB/N
liver ESTs Em:BI146097 and Em:CA478551 indicate the
locus is transcribed in this strain at least, although again there
is no evidence for secretion of the protein.
Discussion
This is the first in depth analysis of the Mup gene clusters of
two distinct strains of mice, strengthened by resolution of the
distinct urinary profiles of these mice alongside their respec-
tive gene complements. We have linked our experimental
observations to a combination of structural and phylogenetic
analyses of the cluster, and observe that the region contains a
distinct pattern of organization, with the central and periph-
eral sections being structurally and phylogenetically distinct.
This appears to reflect differing modes of evolution, which
may be linked to a division of functionality within the cluster.
Figure 7 summarizes the total information now available
regarding the transcriptional and phenotypic profile of the
Mup gene cluster. It must be reiterated that our investigation
has studied inbred laboratory mice and not wild mice. Heter-
ozygous wild males typically contain approximately twice as
many MUPs in urine as inbred males, and it seems a fair
assumption that this increase is due at least in part to hetero-
zygosity across the cluster [3,9,12,18]. It should also be noted
that the human selection of mouse breeding pairs in the
development of laboratory strains over the last hundred years
may have imparted a degree of artificial selection on the Mup
clusters, given that these genes directly influence various
aspects of mouse behavior.
The central region is likely subject to concerted
evolution
The genes within the central array of both B6 and S7 differ by
an average of just 0.8 bp within their CDS, and since an
almost identical degree of nucleotide identity is maintained
across their intronic sequence, this similarity cannot be due
to purifying selection alone. Instead, the homogenized nature
of the central array indicates the action of concerted evolution
[48], which operates via both NAHR and gene conversion
events. The action of concerted evolution is typically demon-
strated by comparing the alignment of paralogs from a variety
of species [49]. Here, ambiguities arising from the incomplete
nature of the B6 and S7 genomic sequences limit the value of
a detailed analysis at present. However, the alignment of cen-
tral B6 MUP proteins 3, 5, 7, 10, 11 and 13, displays mosaicism
in the pattern of amino acid substitutions, indicative of
recombination (Additional data file 1). We predict NAHR
Identification of 18,956 Da MUP by gel electrophoresis, tandem mass spectrometry and peptide mass fingerprinting (PMF)Figure 6 (see following page)
Identification of 18,956 Da MUP by gel electrophoresis, tandem mass spectrometry and peptide mass fingerprinting (PMF). (a) Urine pooled from five B6
males and five females was first resolved by non-denaturing (native) or SDS-PAGE electrophoresis (8 μg protein loaded). The male specific band indicated
by the arrow was excised from the gel and digested with trypsin or endopeptidase LysC for peptide mass fingerprinting. (b) The peptide maps define
peptides (trypsin: T1 T17, endopeptidase LysC: L1 L11) that would be obtained from the MUP of unmodified mass 18,956. Peptides that were identified
by PMF (shown in (c)) or by MS/MS (shown in (d)) are shaded or highlighted with an asterisk. Overlaid narrow bands define peptides identified as part of
a missed cleavage. (c) A representative MS/MS spectra of peptide ENIIDLTNVNR, m/z 1,300.67, [M+2H]
2+
650.7. This protein contains a putative
glycosylation site at Asn66 (AFVENITVLENSLVFK77, peptide T5) and, after digestion with N-glycanase (NG, enzyme band indicated by an asterisk), shifted
in electrophoretic mobility (a).
Genome Biology 2008, 9:R91
Genome Biology 2008, Volume 9, Issue 5, Article R91 Mudge et al. R91.10
Figure 6 (see legend on previous page)
200 300 400 500 600 700 800 900 1,000 1,100 1,200 1,300
m/z
0
50
100
Relative abundance
831.42
603.34
944.44
633.13
502.27
716.39
289.16
567.24
994.49
781.28
339.11
452.14
680.15
357.15
1,012.35
1,057.66
226.07
1,126.65
927.60
1,170.38
1,260.50
NVNTL D I I NE
y10
y9
y8
y7
y6
y5
y4
y3
y2
b07
b06
b05
b04
b03
b09
b02
900 1,000 1,100 1,200 1,300 1,400 1,500 1,600 1,700 1,800 1,900 2,000 2,100 2,200 2,300 2,400 2,500 2,600 2,700 2,800 2,900
m/z
0
100
Percentage
1,215.86
1,753.06
1,557.99
2,479.30
2,462.23
954.46
958.52
1,126.91
1,258.90
1,300.95
2,274.28
1,472.99
2,268.30
2,164.20
1,882.15
2,117.14
2,408.36
2,719.34
2,525.40
T15
T1
T16
T3-4
T11
T7
T4
T8-9
T6
T14-15
T8
T2
T15-16
T
T2-3
T11-12
T10-11
T11-13
Trypsin
Lys C
954.37 +
T1
2,462.11 +
T2
958.42 +
T4
1,822.98 +
T5
2,479.14 +
T6
2,116.99 +
T7
1,752.85 +
T8
1,257.61 +
T1
1
1,029.53 +
T12
1
,126.55 +
T15
1,300.67 +
T16
648.3 +
T17
3,654.61 +
L1
2,762.4 +
L2
2,479.14 +
L3
2,116.99 +
L4
1,752.85 +
L5
2,268.14 +
L8
3,166.56 +
L1
1
*
*
*
18,956 Da
18,956 Da
(b)
*
- NG
+ NG
B6 pooled male urine
B6 pooled female urine
Native
SDS-PAGE
(a)
(c)
(d)
18,956 Da
18,956 Da
**
Genome Biology 2008, Volume 9, Issue 5, Article R91 Mudge et al. R91.11
Genome Biology 2008, 9:R91
generates novel Mup genes by recombining mutations from
different cassettes, whilst the action of gene conversion gen-
erates polymorphism where single conversion events
between Mup genes result in only partial homogenization
[49-51]. By this model NAHR also causes the continuing
expansion and contraction of the cluster via duplication and
deletion events, potentially involving multiple cassettes; a
recent report into the incidence of murine global copy
number variation highlighted the Mup cluster as varying dra-
matically in size between different inbred strains [52]. We
predict that the central Mup region is polymorphic in wild
populations, both in terms of copy number and in the specific
loci that are present, and that the ongoing action of concerted
evolution acts to prevent the long-term differentiation of
these Mup genes [53].
The central region may confer self/non-self recognition
MUPs confer a 'signature' of individuality and kinship iden-
tity via the highly polymorphic set of proteins excreted by
wild individuals [3,6,12]. The central array of Mup genes
could generate the requisite genetic polymorphism for this
functionality by the ongoing action of point mutation and
concerted evolution. This individuality coding may overlap
with functionality in pheromone binding; interestingly, how-
ever, our earlier work showed that the central 18,645 Da,
18,709 Da and 18,693 Da proteins are poor binders of thiazole
compared to the peripheral 18,893 Da protein [21] (see
below). Furthermore, individuality coding appears to func-
tion in both male and female mice, and it is noteworthy that
the two MUP peaks identified in the female mice of the three
strains studied here correspond to central genes.
Our analysis indicates that the oldest array duplication events
occurred 1.2-2.4 Mya, although this value may be an
underestimate due to gene conversion. As it stands, the
timing for the expansion of the central array overlaps with the
separation of M. m. domesticus from the Algerian mouse Mus
spretus and eastern European mouse Mus macedonicus line-
ages around 1.5 Mya [54,55]. Wild M. m. domesticus mice
have higher population densities than M. spretus and M.
macedonicus, and it is believed that the former became com-
mensal alongside the development of human civilization
10,000 years ago [56]. We have recently performed mass
spectrometry analyses on wild M. macedonicus mice cap-
tured from different locations, and observed in each case the
same solitary mass peak, indicative of a single protein species
[46]. Similar analyses of five wild-caught M. spretus males
revealed nearly identical individual profiles, in this case con-
sisting of three peaks [57]. We proposed that MUP family
expansion and polymorphism arose in M. m. domesticus to
match a demand for elaborate communication coupled to an
increase in social complexity, and we now predict that this
Summary of Mup cluster transcriptional and phenotypic profilesFigure 7
Summary of Mup cluster transcriptional and phenotypic profiles. The cluster of B6 is presented as annotated in Figure 1. Red arrows and red text boxes
indicate tissues in which transcription can be confirmed for each locus based on the presence of 100% supporting cDNAs or ESTs in GenBank [42] (whilst
allowing for poor-quality sequence at the immediate 5' and 3' ends for ESTs); blue arrows and blue text boxes indicate genes where a corresponding
protein has been detected in urine. The asterisks marking genes 5, 10 and 13 indicate that potentially corresponding proteins for these loci have previously
been detected in wild mice, but not in the inbred mice studied in this investigation [46] (see Results). Genes 4, 6, 7, 9, 12, 14 and 15 each have proteins
with predicted masses that can be matched to detected mass 18,693 Da; it is currently unclear which of these loci contribute to the protein peak in Figure
4. Proteins that exhibit sexual dimorphism (being detected in males but not females) are indicated by green arrows and text boxes marked 'Male'.
1
2
3
4
7
89
12
13 14 15 16 17 18 19
5 6 10 11
Liver transcription
Urinary protein
Male
Male
Male
Submaxillary gland
Embryo stem cells
Lachrymal and parotid gland
***
Genome Biology 2008, 9:R91
Genome Biology 2008, Volume 9, Issue 5, Article R91 Mudge et al. R91.12
acquisition of functionality may have been facilitated by the
expansion of the central Mup cluster.
The peripheral regions are likely subject to birth-and-
death evolution
The six genes that flank the central array (Figure 1) form iso-
lated nodes in the tree in Figure 2, and do not exist within
homogenized cassettes as seen in Figure 3. The divergence of
these loci pre-dates the predicted divergence of the M. m.
domesticus, M. spretus and M. macedonicus lineages [54,55],
falling closer to the estimated divergence of the mouse/rat
lineages 12-24 Mya [35]. The exception is the duplication
event forming the B6 gene 17/pseudogene Q pair, which rep-
resents a much more recent event. Thus, whilst we infer the
peripheral regions have a higher degree of structural stability
than the central region, the potential for instability persists.
There are four other pseudogenes in the downstream periph-
eral region, which do not represent serial duplications. These
observations suggest that birth-and-death evolution is the
dominant mode of change over these regions [53,58],
whereby gene copies are created by duplication and either
acquire functionality or else undergo pseudogenization. By
this model, the differences between the CDS of these loci may
indicate the acquisition of individualized functions in the
absence of homogenization by NAHR. Of the six peripheral
MUP proteins, two appear to be predominantly expressed by
males in urine (B6 genes 17 and 18), two are non-urinary (1
and 16) and two have never been detected experimentally (2
and 19; Figure 7).
It has been suggested that signaling ligands may be trans-
ferred from sequestering urinary MUPs to MUPs in the nasal
cavity when a scent mark is investigated [59]. We have previ-
ously shown that the 18,893 Da protein sequesters 40% of the
total quantity of thiazole in B6 urine, in spite of the signifi-
cantly lower concentration of this protein compared with the
other urinary MUPs [21]. Interestingly, the nasally excreted
B6 gene 1 also has a significantly elevated binding affinity for
this ligand [21,22]. It is thus noteworthy that thiazole is a
male-specific ligand, and that the 18,893 Da protein is nor-
mally detected only in male urine; we now suggest that these
peripheral MUPs may have evolved in tandem to facilitate
thiazole transfer in a sexually dimorphic manner. The 18,893
mass is undetected in the urine of a minority of male wild
mice [21], although it remains to be seen whether this results
from the loss of this Mup gene, amino acid substitutions that
affect mass but not functionality, or cryptic regulatory
changes (see below). Finally, if our prediction is correct, one
may expect that thiazole transfer is compromised in S5 and
BALB/c mice, given that these strains lack the 18,893 mass
peak; this possibility has yet to be investigated. At present we
do not propose a function for the urinary MUP encoded by B6
gene 18 (Figure 6), although it should be recalled that male
urine contains ligands other than thiazole, most notably brev-
icomin [14,15].
Certain Mup genes appear non-transcribed
The S5 protein profile lacks mass 18,893 Da (Figure 4), con-
trary to our predictions based on the S7 genomic sequence,
and this mass is also absent in BALB/c. Additionally, there
are three intact CDSs within the B6 central array that match
mass peaks previously observed solely in wild-caught mice
[46] (B6 genes 5, 10 and 13; Figure 7). Four MUPs thus appear
polymorphic at the phenotypic level in a manner that is not
coupled to polymorphism at the genomic level in an obvious
way. However, genic polymorphism is not limited to the CDS.
Mup gene regulation is complex, and trans-acting factors
known to modulate Mup loci (or the equivalent rat loci)
include growth hormone [60], thyroid hormone [61], gluco-
corticoids [62] and androgens [63]. Certain genes lacking
protein support may contain cryptic promoter or binding site
mutations that impede transcription, and we have identified
an intriguing difference in a putative functional element
unique to the functional B6 gene 17 (Figure 5). It is also note-
worthy that evidence exists indicating Mup genes are subject
to methylation, albeit in a manner that is currently not under-
stood [64-66].
Conclusion
Our combination of genome sequencing, annotation and
experimental analysis provides a valuable resource for future
studies into both the functionality and evolution of the gene
family; attempts, in short, to trace the path from Mup geno-
type to MUP phenotype, and ultimately to mouse behavior.
We predict that differing modes of evolution within the cen-
tral and peripheral regions of the cluster reflect functional
divergence, with the ongoing occurrence of recombination
within the central cluster generating a rapid turnover of poly-
morphic gene variants, whilst the peripheral loci acquire spe-
cialized functions by divergent evolution. These propositions
will be tested by the future generation of genomic sequence
from other M. m. domesticus mice, mice of other species/sub-
species, and perhaps other rodents. However, even consider-
ing the urinary MUPs alone, it is clear that the link between
genotype and phenotype is not straightforward. We predict
that the differing MUP profiles of wild mice result from a
combination of the set of Mup loci a particular genome con-
tains coupled with variation in gene expression patterns.
Future progress in genotype/phenotype correlation is thus
likely to coincide with an increase in our understanding of
Mup gene regulation.
Materials and methods
Animals and sampling
S5 (129/SvEvBrd) mice were housed at the Wellcome Trust
Sanger Institute under standard conditions. Urine from male
and female adult mice was collected by bladder massage.
BALB/c and B6 mice were housed in the Faculty of Veterinary
Science at the University of Liverpool under equivalent con-
ditions, with urine obtained by M Thom in the same manner.
Genome Biology 2008, Volume 9, Issue 5, Article R91 Mudge et al. R91.13
Genome Biology 2008, 9:R91
Clone selection from C57BL/6J and 129S7 libraries
Candidate B6 BACs were selected from the FPC clone library
in line with standard procedures [29]. A tiling path of candi-
date BAC clones from the S7 library was selected from Mouse
Ensembl [32] to cover the region of interest in the B6 assem-
bly (NCBI m34) using the BAC end sequence alignment track
[37]. Candidate BAC clones were analyzed using HindIII
restriction fingerprinting and assembled into contigs in FPC
[29] to allow selection of a minimal tiling path. Both the
repetitive nature of the region and the remaining gaps in the
B6 tiling path prevented contiguous coverage from the S7
library (see Results).
Sequencing of C57BL/6J and 129S7 clones
Previous sequencing of the Mup region of B6 revealed a high
level of repeat within the clones. Therefore, each selected S7
BAC clone had 2 pUC19 subclone libraries prepared with
insert sizes of 4-6 kb and 6-9 kb, this combination of insert
sizes having proved expedient for manual finishing of B6
clones. Of the seven clones finished, two utilized this combi-
nation of sequence data from both subclone libraries. Both lie
in the central region, which contains an elevated repeat
content (see Results). All pUC subclones utilized were
sequenced with AB Big Dye Terminator Mix v3.1™ and the
data analyzed on AB 3730 automated sequencing instru-
ments at Hinxton, UK. The data were assembled and sub-
jected to automated primer walking, prior to re-assembly
using PHRAP (P Green) and then passed into directed man-
ual finishing for completion to phase 3. The sequences of all
BACs generated in this study have been deposited in GenBank
[42].
Annotation and phylogenetic analysis of genomic
sequence
Genomic sequence from both strains was analyzed as part of
the VEGA project [33]. This involves fully manual gene anno-
tation based on transcriptional evidence; full criteria are
detailed on the website. Manual annotation is desirable over
automated gene building methodologies when describing
homogenous gene clusters. Prior to this analysis the Ensembl
gene build contained numerous chimeric Mup loci that erro-
neously spliced together exons from adjacent genes; the
Ensembl and Vega gene builds have since been merged [67].
Annotation and dot-plot analyses were performed using in-
house software (J Gilbert). Molecular weights of predicted
proteins (minus signal peptides) were calculated using the
Compute Pi/Mw tool on the ExPASy server [68]. MUPs con-
tain a disulphide bridge between a pair of cysteine residues
conserved in all proteins; 2 Da was deducted from each pre-
dicted mass to take this modification into account [69].
Repeats were identified using RepeatMasker [70], and fur-
ther characterized as appropriate using the RepBase
resources [71]. For phylogenetic analysis the sequence of
intron 2 of each locus for which this sequence was available
was excised and aligned using ClustalW [72] followed by
manual re-alignment where required. Further analysis was
performed using the Phylip software suite [73], using the
neighbor-joining methodology with the Kimura-2-parameter
model, alongside 1,000 bootstrap replicates.
MUP preparation
MUPs were purified from urine by spun-column gel permea-
tion chromatography. Columns (5 ml) were packed with pre-
swollen Sephadex-G25 that was subsequently equilibrated in
deionized water. Excess water was removed from the columns
with a 200 g spin for 2 minutes. An aliquot (200 μl) of urine
was then loaded onto each column, which was spun for a
further 2 minutes at 200 g. The eluent from the column was
captured in 1.5 ml polypropylene test tubes and either sub-
mitted immediately for analysis or stored at -20°C. Desalted,
unfractionated MUPs were diluted 1:500 with 50% (v/v) ace-
tonitrile/0.1% (v/v) formic acid, and desalted ion-exchange
fractions were diluted 1:100 with the same diluent prior to
mass spectrometry.
Electrospray ionization mass spectrometry
ESI-MS and tandem mass spectrometry (ESI-MSMS) were
performed on a Micromass Q-ToF Micro instrument, fitted
with a nanospray source at Liverpool, UK. The electrospray
was created from a silver coated glass capillary with a 10 μm
orifice (New Objective, Woburn, MA, USA), held at a poten-
tial of +2,000 V relative to the sample cone. For measurement
of the mass of intact MUPs from B6, BALB/c and S5 mouse
urine, a desalted sample was diluted 1:500 with a solution of
50% (v/v) acetonitrile/0.1% (v/v) formic acid and introduced
into the mass spectrometer by syringe pump infusion (Har-
vard Instruments Ltd, Edenbridge, UK) at a rate of 0.5 μl/
minute. In this case, the instrument was operated in TOF only
mode, with the quadrupole analyzer operating in Rf only
mode to allow transmission of all ions. Raw data were gath-
ered between 700 and 1,400 Th at a scan/interscan speed of
2.4/0.1 s. These raw data were subsequently de-convoluted
and transformed to a true mass scale using the MaxEnt 1
module contained within the MassLynx 4.0 software, pub-
lished by the Waters Corporation, Milford, MA, USA. To
create the MaxEnt damage model, peak width and resolution
parameters of 0.75 Da and 1 Da/channel were used, respec-
tively, and data were processed over the mass range 18,400-
19,000 Da. For replicate analysis, true mass spectra were nor-
malized to the most abundant protein and aligned using
SpecAlign [74]. The average spectrum was calculated for each
strain and sex, together with the mean ± standard error of the
mean relative peak height for each mass.
Native PAGE
Native PAGE was performed essentially as described by UK
Laemmli [75]. However, no SDS or reducing agents were
included in any of the gel, running or sample buffers. Pooled
urine samples were mixed 1:1 with sample buffer before load-
ing. The gel acrylamide concentration was 20%. Electro-
phoresis was performed at a constant 200 V for 2 h. Protein
bands were visualized with Coomassie brilliant blue. Loading
Genome Biology 2008, 9:R91
Genome Biology 2008, Volume 9, Issue 5, Article R91 Mudge et al. R91.14
increasing volumes of urine does not change the MUP protein
banding pattern at the qualitative level (Additional data file
6).
Deglycosylation
B6 male MUPs were subjected to N-linked oligosaccharide
digestion according to the denaturing protocol for the enzy-
matic deglycosylation kit (Glyko ProZyme, San Leandro, CA,
USA). Briefly, 20 μg of protein was diluted in 30 μl of water,
10 μl of 5× incubation buffer, and 2.5 μl of denaturation solu-
tion; heated for 5 minutes at 100°C; and cooled to room
temperature. Then, 2.5 μl of the detergent solution was added
to the sample, which was then digested with 1 μl of N-glyca-
nase for 3 h at 37°C. Protein band mass shifts due to oligosac-
charide cleavage were monitored using SDS-PAGE.
In-gel enzyme digestion
Plugs were removed from protein bands on the native PAGE
gel using a thin glass pipette and placed into microcentrifuge
tubes. Each gel plug was destained using 100 μl of 50 mM
ammonium bicarbonate, 50% (v/v) acetonitrile (trypsin) or
100 μl 25 mM Tris HCl pH 8.5, 50% (v/v) acetonitrile (lys C),
and was incubated at 37°C for 30 minutes. This step was
repeated until no stain was visible. The plugs were then
washed twice in 100 μl 50 mM ammonium bicarbonate
(trypsin) or 100 μl 25 mM Tris HCl pH 8.5 (lys C), which was
then discarded. The plugs were then incubated with 50 μl of a
10 mM dithiothreitol stock solution. After 30 minutes at 37°C
the dithiothreitol was discarded and 50 μl of a 55 mM iodoa-
cetamide stock solution was added to each tube and incu-
bated for 1 h at room temperature in the dark. The
iodoacetamide was discarded and the plugs washed twice as
above. The plugs were dehydrated in 100% acetonitrile. The
plug was rehydrated in 19 μl of 25 mM Tris/HCl, 1 mM EDTA,
pH 8.5 (lys C), or 50 mM ammonium bicarbonate (trypsin).
Sequencing grade endoproteinase lys-C or trypsin (1 μl, 0.1
μg/μl, Roche, Basel, Switzerland) was added and the digest
was incubated overnight at 37°C. The reaction was stopped
with 1 μl formic acid.
Peptide mass fingerprinting
The peptides were analyzed on a matrix-assisted laser des-
orption ionization time of flight mass spectrometer (MALDI-
TOF/MS) (Micromass) operated in reflectron mode with pos-
itive ion detection. External mass calibration was determined
using a mixture of des-Arg bradykinin, neurotenin, ACTH,
and insulin b chain (50 mM each in 50% acetonittrile, 0.1%
trifluroactic acid). Samples were mixed 1:1 (v/v) with a satu-
rated solution of α cyano-4-hydroxycinnamic acid in ace-
tonitrile:water:trifluroacetic acid (50:49:1, v/v/v). Peptide
mass fingerprints were searched against the MSDB database
(release 20063108) using the MASCOT search engine [76].
Peptide mass fingerprint search parameters were set to toler-
ate a maximum of one missed enzyme cleavage with carbami-
domethyl cysteine as a fixed modification and methionine
oxidation as a variable modification; peptide mass tolerance
was ±250 ppm.
Tandem MS/MS
In-gel trypsin digests were analyzed using a LTQ ion trap
mass spectrometer (Thermo Electron, Hemel Hempstead,
UK) coupled online to a L3000 nanoflow HPLC (Dionex, Sun-
nyvale, CA, USA) equipped with a LC packings PepMap 100
C18 reverse phase column (75 μm internal diameter × 15 cm
length, 3 μm particle size, 100 Å pore size). Tandem MS spec-
tra were submitted to MASCOT to search MSDB [75]. MS/MS
ion search parameters were set to tolerate a maximum of one
missed enzyme cleavage with carbamidomethyl cysteine as a
fixed modification, methionine oxidation as a variable modi-
fication; peptide mass tolerance was ±1.2 Da, and fragment
mass tolerance was ±0.6 Da.
Abbreviations
B6, C57BL/6J; BAC, bacterial artificial chromosome; brevi-
comin, 3,4-dehydro-exo-brevicomin; CDS, coding sequence;
ERV, endogenous retrovirus; ESI, electrospray ionization;
FPC, FingerPrinted Contig; MS, mass spectrometry; MUP,
major urinary protein; Mya, million years ago; NAHR, non-
allelic homologous recombination; S5, 129S5; S7, 129S7; thi-
azole, 2-sec-butyl-4,5-dihydrothiazole.
Authors' contributions
JMM carried out the genomic and phylogenetic analyses and
wrote the manuscript. KM and CN coordinated the sequenc-
ing efforts. SDA and DHR performed the protein characteri-
zation. RJB and JLH directed the phenotype analyses,
analyzed the phenotype data and co-wrote the manuscript.
LGW and JLH provided guidance and support in the concep-
tion of the genomic analyses. All authors read and approved
the final manuscript.
Additional data files
The following additional data are available. Additional data
file 1 is an alignment of the B6 and S7 MUPs. Additional data
file 2 is a dot-plot self comparison of genomic sequence
between B6 gene 4 and pseudogene B, with the point of align-
ment inversion seen to correspond to the location of a murine
ERV. Additional data file 3 is a dot-plot comparison of the
mass 18,893-associated duplication from the B6 genome.
Additional data file 4 details the absence of MUP isoforms in
the upper mass range of ESI-MS spectra of inbred mouse
urine samples. Additional data file 5 details individual varia-
tion in ESI-MS mass spectra of MUP isoforms in urine. Addi-
tional data file 6 shows that increasing the volume of urine
loaded onto a native PAGE gel does not change the banding
pattern observed once the essential banding pattern has
become visible.
Additional data file 1Alignment of the B6 and S7 MUPsAlignment of the B6 and S7 MUPs.Click here for fileAdditional data file 2Dot-plot self comparison of genomic sequence between B6 gene 4 and pseudogene BThe point of alignment inversion is seen to correspond to the loca-tion of a murine ERV.Click here for fileAdditional data file 3Dot-plot comparison of the mass 18,893-associated duplication from the B6 genomeDot-plot comparison of the mass 18,893-associated duplication from the B6 genome.Click here for fileAdditional data file 4Details of the absence of MUP isoforms in the upper mass range of ESI-MS spectra of inbred mouse urine samplesDetails of the absence of MUP isoforms in the upper mass range of ESI-MS spectra of inbred mouse urine samples.Click here for fileAdditional data file 5Individual variation in ESI-MS mass spectra of MUP isoforms in urineIndividual variation in ESI-MS mass spectra of MUP isoforms in urine.Click here for fileAdditional data file 6Increasing the volume of urine loaded onto a native PAGE gel does not change the banding pattern observed once the essential band-ing pattern has become visibleIncreasing the volume of urine loaded onto a native PAGE gel does not change the banding pattern observed once the essential band-ing pattern has become visible.Click here for file
Genome Biology 2008, Volume 9, Issue 5, Article R91 Mudge et al. R91.15
Genome Biology 2008, 9:R91
Acknowledgements
The authors would like to thank JG Gilbert and M Larbaoui for computa-
tional support, MD Thom and AJ Davidson for practical help and DJ Adams
for helpful discussions. We would like to acknowledge the contribution of
both the Production and Finishing Groups at the Wellcome Trust Sanger
Institute. In particular, thanks go to C Clee and K Oliver for production of
the sequence data and A Tracey, K Auger, N Barker, C Henderson, P How-
den, and D Wright for finishing the clone data. This work was supported by
grants awarded by the Wellcome Trust in the case of genome sequencing
and analysis, and from the BBSRC in the case of protein biochemistry.
References
1. Brennan PA, Kendrick KM: Mammalian social odours: attraction
and individual recognition. Philos Trans R Soc Lond B Biol Sci 2006,
361:2061-2078.
2. Cavaggioni A, Mucignat-Caretta C: Major urinary proteins,
alpha(2U)-globulins and aphrodisin. Biochim Biophys Acta 2000,
1482:218-228.
3. Beynon RJ, Hurst JL: Urinary proteins and the modulation of
chemical scents in mice and rats. Peptides 2004, 25:1553-1563.
4. Chamero P, Marton TF, Logan DW, Flanagan K, Cruz JR, Saghatelian
A, Cravatt BF, Stowers L: Identification of protein pheromones
that promote aggressive behaviour. Nature 2007, 450:899-902.
5. Brennan PA, Peele P: Towards an understanding of the preg-
nancy-blocking urinary chemosignals of mice. Biochem Soc
Trans 2003, 31:152-155.
6. Cheetham SA, Thom MD, Jury F, Ollier WE, Beynon RJ, Hurst JL: The
genetic basis of individual-recognition signals in the mouse.
Curr Biol 2007, 17:1771-1777.
7. Cotton S: Individual recognition: mice, MUPs and the MHC.
Curr Biol 2007, 17:R971-R973.
8. Drickamer LC: Estrus female house mice discriminate domi-
nant from subdominant males and sons of subordinate males
by odor cues. Anim Behav 1992, 43:868-870.
9. Hurst JL, Payne CE, Nevison CM, Marie AD, Humphries RE, Robert-
son DH, Cavaggioni A, Beynon RJ: Individual recognition in mice
mediated by major urinary proteins. Nature 2001, 414:631-634.
10. Hurst JL, Rich TJ: Scent marks as competitive signals of mate
quality. Anim Behav 1999, 56:727-725.
11. Novotny MV, Ma W, Wiesler D, Zídek L: Positive identification of
the puberty-accelerating pheromone of the house mouse:
the volatile ligands associating with the major urinary
protein. Proc Biol Sci 1999, 266:2017-2022.
12. Sherborne AL, Thom MD, Paterson S, Jury F, Ollier WE, Stockley P,
Beynon RJ, Hurst JL: The genetic basis of inbreeding avoidance
in house mice. Curr Biol 2007, 17:2061-2066.
13. Thom MD, Stockley P, Jury F, Ollier WE, Beynon RJ, Hurst JL: The
direct assessment of genetic heterozygosity through scent in
the mouse. Curr Biol 2008, 18:619-623.
14. Bacchini A, Gaetani E, Cavaggioni A: Pheromone binding proteins
of the mouse, Mus musculus. Experientia 1992, 48:419-421.
15. Böcskei Z, Findlay JB, North AC, Phillips SE, Somers WS, Wright CE,
Lionetti C, Tirindelli R, Cavaggioni A: Crystallization of and pre-
liminary X-ray data for the mouse major urinary protein and
rat alpha-2u globulin. J Mol Biol 1991, 218:699-701.
16. Robertson DH, Cox KA, Gaskell SJ, Evershed RP, Beynon RJ: Molec-
ular heterogeneity in the major urinary proteins of the house
mouse Mus musculus. Biochem J 1996, 316:265-272.
17. Hurst JL, Robertson DHL, Tolladay U, Beynon RJ: Proteins in urine
scent marks of male house mice extend the longevity of
olfactory signals. Anim Behav 1998, 55:1289-1297.
18. Beynon RJ, Hurst JL: Multiple roles of major urinary proteins in
the house mouse, Mus domesticus. Biochem Soc Trans 2003,
31:142-146.
19. Hurst JL, Thom MD, Nevison CM, Humphries RE, Beynon RJ: MHC
odours are not required or sufficient for recognition of indi-
vidual scent owners. Proc Biol Sci 2005, 272:715-724.
20. Finlayson JS, Potter M, Runner CR: Electrophoretic variation and
sex dimorphism of the major urinary protein complex in
inbred mice: a new genetic marker. J Natl Cancer Inst 1963,
31:91-107.
21. Armstrong SD, Robertson DH, Cheetham SA, Hurst JL, Beynon RJ:
Structural and functional differences in isoforms of mouse
major urinary proteins: a male-specific protein that prefer-
entially binds a male pheromone. Biochem J 2005, 391:343-350.
22. Sharrow SD, Vaughn JL, Zídek L, Novotny MV, Stone MJ: Pherom-
one binding by polymorphic mouse major urinary proteins.
Protein Sci 2002, 11:2247-2256.
23. Shahan K, Denaro M, Gilmartin M, Shi Y, Derman E: Expression of
six mouse major urinary protein genes in the mammary,
parotid, sublingual, submaxillary, and lachrymal glands and
in the liver. Mol Cell Biol 1987, 7:1947-1954.
24. Shahan K, Gilmartin M, Derman E: Nucleotide sequences of liver,
lachrymal, and submaxillary gland mouse major urinary pro-
tein mRNAs: mosaic structure and construction of panels of
gene-specific synthetic oligonucleotide probes. Mol Cell Biol
1987, 7:1938-1946.
25. Beck JA, Lloyd S, Hafezparast M, Lennon-Pierce M, Eppig JT, Festing
MF, Fisher EM: Genealogies of mouse inbred strains. Nat Genet
2000, 24:23-25.
26. Bishop JO, Selman GG, Hickman J, Black L, Saunders RD, Clark AJ:
The 45-kb unit of major urinary protein gene organization is
a gigantic imperfect palindrome. Mol Cell Biol 1985,
5:1591-1600.
27. Clark AJ, Hickman J, Bishop J: A 45-kb DNA domain with two
divergently orientated genes is the unit of organisation of the
murine major urinary protein genes. EMBO J 1984,
3:2055-2064.
28. Shi Y, Son HJ, Shahan K, Rodriguez M, Costantini F, Derman E: Silent
genes in the mouse major urinary protein gene family. Proc
Natl Acad Sci USA 1989, 86:4584-4588.
29. Soderlund C, Humphray S, Dunham A, French L: Contigs built with
fingerprints, markers, and FPC V4.7. Genome Res 2000,
10:1772-1787.
30. Taudien S, Galgoczy P, Huse K, Reichwald K, Schilhabel M, Szafranski
K, Shimizu A, Asakawa S, Frankish A, Loncarevic IF, Shimizu N, Sid-
diqui R, Platzer M: Polymorphic segmental duplications at
8p23.1 challenge the determination of individual defensin
gene repertoires and the assembly of a contiguous human
reference sequence. BMC Genomics 2004, 5:92.
31. Zhou S, Bechner MC, Place M, Churas CP, Pape L, Leong SA, Run-
nheim R, Forrest DK, Goldstein S, Livny M, Schwartz DC: Validation
of rice genome sequence by optical mapping. BMC Genomics
2007, 8:278.
32.
The Ensembl Genome Browser []
33. Ashurst JL, Chen CK, Gilbert JG, Jekosch K, Keenan S, Meidl P, Searle
SM, Stalker J, Storey R, Trevanion S, Wilming L, Hubbard T: The
Vertebrate Genome Annotation (Vega) database. Nucleic
Acids Res 2005, 33(Database issue):D459-D465.
34. Hegde RS, Bernstein HD: The surprising complexity of signal
sequences. Trends Biochem Sci 2006, 31:563-571.
35. Gibbs RA, Weinstock GM, Metzker ML, Muzny DM, Sodergren EJ,
Scherer S, Scott G, Steffen D, Worley KC, Burch PE, Okwuonu G,
Hines S, Lewis L, DeRamo C, Delgado O, Dugan-Rocha S, Miner G,
Morgan M, Hawes A, Gill R, Celera , Holt RA, Adams MD, Amanati-
des PG, Baden-Tillson H, Barnstead M, Chin S, Evans CA, Ferriera S,
Folser C, et al.: Genome sequence of the Brown Norway rat
yields insights into mammalian evolution. Nature 2004,
428:493-521.
36. Sun C, Skaletsky H, Rozen S, Gromoll J, Nieschlag E, Oates R, Page
DC: Deletion of azoospermia factor a (AZFa) region of
human Y chromosome caused by recombination between
HERV15 proviruses. Hum Mol Genet 2000, 9:2291-2296.
37. Adams DJ, Quail MA, Cox T, Weyden L van der, Gorick BD, Su Q,
Chan WI, Davies R, Bonfield JK, Law F, Humphray S, Plumb B, Liu P,
Rogers J, Bradley A: A genome-wide, end-sequenced 129Sv
BAC library resource for targeting vector construction.
Genomics 2005, 86:753-758.
38. Wade CM, Daly MJ: Genetic variation in laboratory mice. Nat
Genet 2005, 37:1175-1180.
39. Wade CM, Kulbokas EJ 3rd, Kirby AW, Zody MC, Mullikin JC, Lander
ES, Lindblad-Toh K, Daly MJ: The mosaic structure of variation
in the laboratory mouse genome. Nature 2002, 420:574-578.
40. Egan CM, Sridhar S, Wigler M, Hall IM: Recurrent DNA copy
number variation in the laboratory mouse. Nat Genet 2007,
39:1384-1389.
41. Taft RA, Davisson M, Wiles MV: Know thy mouse. Trends Genet
2006, 22:649-653.
42. Benson DA, Karsch-Mizrachi I, Lipman DJ, Ostell J, Wheeler DL:
GenBank.
Nucleic Acids Res 2008, 36(Database issue):D25-D30.
43. Mouse Genome Sequencing Consortium, Waterston RH, Lindblad-
Toh K, Birney E, Rogers J, Abril JF, Agarwal P, Agarwala R, Ainscough
R, Alexandersson M, An P, Antonarakis SE, Attwood J, Baertsch R,
Genome Biology 2008, 9:R91
Genome Biology 2008, Volume 9, Issue 5, Article R91 Mudge et al. R91.16
Bailey J, Barlow K, Beck S, Berry E, Birren B, Bloom T, Bork P, Botch-
erby M, Bray N, Brent MR, Brown DG, Brown SD, Bult C, Burton J,
Bultler J, Campbell RD, Carninci P, et al.: Initial sequencing and
comparative analysis of the mouse genome. Nature 2002,
420:520-562.
44. Van Dijck P, De Vos P, Winderickx J, Verhoeven G: Multiple bind-
ing sites for nuclear factors in the 5'-upstream region of two
alpha 2u-globulin genes: implications for hormone-regulated
and tissue-specific control. J Steroid Biochem Mol Biol 1993,
45:353-366.
45. Winderickx J, van Dijck P, Dirckx L, Volckaert G, Rombauts W,
Heyns W, Verhoeven G: Comparison of the 5' upstream puta-
tive regulatory sequences of three members of the alpha 2u-
globulin gene family. Eur J Biochem 1987, 165:521-529.
46. Robertson DH, Hurst JL, Searle JB, Gündüz I, Beynon RJ: Character-
ization and comparison of major urinary proteins from the
house mouse, Mus musculus domesticus, and the aboriginal
mouse, Mus macedonicus. J Chem Ecol 2007, 33:613-630.
47. Emes RD, Beatson SA, Ponting CP, Goodstadt L: Evolution and
comparative genomics of odorant- and pheromone-associ-
ated genes in rodents. Genome Res 2004, 14:591-602.
48. Brown DD, Wensink PC, Jordan E: A comparison of the ribos-
omal DNA's of Xenopus laevis and Xenopus mulleri: the evolu-
tion of tandem genes. J Mol Biol 1972, 63:57-73.
49. Hurles ME, Willey D, Matthews L, Hussain SS: Origins of chromo-
somal rearrangement hotspots in the human genome: evi-
dence from the AZFa deletion hotspots. Genome Biol 2004,
5:R55.
50. Giordano M, Marchetti C, Chiorboli E, Bona G, Momigliano Richiardi
P: Evidence for gene conversion in the generation of exten-
sive polymorphism in the promoter of the growth hormone
gene. Hum Genet 1997, 100:249-255.
51. Hurles M: Are 100,000 "SNPs" useless? Science 2002, 298:1509.
52. Graubert TA, Cahan P, Edwin D, Selzer RR, Richmond TA, Eis PS,
Shannon WD, Li X, McLeod HL, Cheverud JM, Ley TJ: A high-reso-
lution map of segmental DNA copy number variation in the
mouse genome. PLoS Genet 2007, 3:e3.
53. Nei M, Rooney AP: Concerted and birth-and-death evolution
of multigene families. Annu Rev Genet 2005, 39:121-152.
54. Boursot P, Auffray J-C, Britton-Davidian J, Bonhomme F: The evolu-
tion of house mice. Ann Rev Ecol System 1993, 24:119-152.
55. Suzuki H, Shimada T, Terashima M, Tsuchiya K, Aplin K: Temporal,
spatial, and ecological modes of evolution of Eurasian Mus
based on mitochondrial and nuclear gene sequences. Mol Phy-
logenet Evol 2004, 33:626-646.
56. Cucchi T, Vigne J-D, Auffray J-C: First occurrence of the house
mouse (Mus musculus domesticus Schwarz & Schwarz, 1943)
in the Western Mediterranean: a zooarchaeological revision
of subfossil occurrences. Biol J Linnean Soc 2005, 84:429-445.
57. Beynon RH, Hurst JL, Turton MJ, Robertson DHL, Armstrong SD,
Cheetham SA, Simpson D, MacNicoll A, Humphries RE: Urinary
lipocalins in Rodenta. Is there a generic model? In Chemical Sig-
nals in Vertebrate 11. Edited by Hurst JL, Beynon RJ, Roberts SC,
Wyatt T. New York: Springer; 2008:37-49.
58. Nei M, Hughes AL: Balanced Polymorphism and Evolution by the Birth-
and-death Process in the MHC Loci. Oxford: Oxford University Press;
1992.
59. Pelosi P: Odorant-binding proteins. Crit Rev Biochem Mol Biol
1994, 29:199-228.
60. al-Shawi R, Wallace H, Harrison S, Jones C, Johnson D, Bishop JO:
Sexual dimorphism and growth hormone regulation of a
hybrid gene in transgenic mice. Mol Endocrinol 1992, 6:181-190.
61. Kurtz DT, Sippel AE, Feigelson P: Effect of thyroid hormones on
the level of the hepatic mRNA for alpha2u globulin. Biochem-
istry 1976, 15:1031-1036.
62. Van Dijck P, Lemaigre FP, Winderickx J, Rousseau GG, Verhoeven G:
Glucocorticoid receptor binding to defined regions of alpha
2u-globulin genes. Biochem Biophys Res Commun 1987,
149:1099-1105.
63. Szoka PR, Paigen K: Regulation of mouse major urinary protein
production by the Mup-A gene. Genetics 1978, 90:597-612.
64. Reik W, Römer I, Barton SC, Surani MA, Howlett SK, Klose J: Adult
phenotype in the mouse can be affected by epigenetic events
in the early embryo. Development 1993, 119:933-942.
65. Roemer I, Reik W, Dean W, Klose J: Epigenetic inheritance in the
mouse. Curr Biol 1997, 7:277-280.
66. Sanford JP, Clark HJ, Chapman VM, Rossant J: Differences in DNA
methylation during oogenesis and spermatogenesis and
their persistence during early embryogenesis in the mouse.
Genes Dev 1987, 1:1039-1046.
67. Hubbard TJ, Aken BL, Beal K, Ballester B, Caccamo M, Chen Y, Clarke
L, Coates G, Cunningham F, Cutts T, Down T, Dyer SC, Fitzgerald S,
Fernandez-Banet J, Graf S, Haider S, Hammond M, Herrero J, Holland
R, Howe K, Johnson N, Kahari A, Keefe D, Kokocinski F, Kulesha E,
Lawson D, Longden I, Melsopp C, Megy K, Meidl P, et al.: Ensembl
2007. Nucleic Acids Res 2007, 35(Database issue):D610-D617.
68. The ExPASy Proteomics Server []
69. Szoka PR, Gallagher JF, Held WA: In vitro synthesis and charac-
terisation of precursors to the mouse major urinary
proteins. J Biol Chem 1980, 255:1367-1373.
70. RepeatMasker Open-3.0 []
71. Jurka J: Repbase update: a database and an electronic journal
of repetitive elements. Trends Genet 2000, 16:418-420.
72. Higgins DG: CLUSTAL V: multiple alignment of DNA and
protein sequences. Methods Mol Biol 1994, 25:307-318.
73. Felsenstein J: PHYLIP - Phylogeny Inference Package (Version
3.2).
Cladistics 1989, 5:164-166.
74. SpecAlign [ />75. Laemmli UK: Cleavage of structural proteins during the
assembly of the head of bacteriophage T4. Nature 1970,
227:680-685.
76. Perkins DN, Pappin DJ, Creasy DM, Cottrell JS: Probability-based
protein identification by searching sequence databases using
mass spectrometry data. Electrophoresis 1999, 20:3551-3567.