beginning excel what if data analysis tool phần 7 doc
Bạn đang xem bản rút gọn của tài liệu. Xem và tải ngay bản đầy đủ của tài liệu tại đây (448.72 KB, 19 trang )
To use Solver to minimize the associated shipping costs while meeting warehouse
demands, do the following:
1. Click Tools
➤ Solver.
2. Click Reset All, and then click OK to clear Solver’s existing settings.
3. Click the Set Target Cell box, and then click cell B20 (Total Shipping).
4. Click Min.
5. Click the By Changing Cells box, and then select cells C8 through G10 (Number to Ship
from Plants to Warehouses).
6. Click Add.
7. Click the Cell Reference box, and then select cells B8 through B10 (Total Shipped from
Plants).
8. Click the Constraint box, and then select cells B16 through B18 (Total Supply).
9. Click Add. This constraint ensures that you will not ship more units than you have in
your inventory.
10. Click the Cell Reference box, and then select cells C12 through G12 (Total Shipped to
Warehouses).
11. In the operator list, click >=.
12. Click the Constraint box, and then select cells C14 through G14 (Total Demands by
Warehouse).
13. Click Add. This constraint ensures that you will not ship more units to warehouses
than you have demands by your warehouses.
CHAPTER 4 ■ SOLVER 93
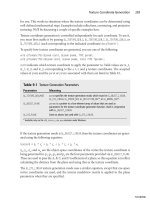
Figure 4-36. The Shipping Routes Solver sample worksheet with its default values
5912_c04_final.qxd 10/27/05 10:17 PM Page 93
14. Click the Cell Reference box, and then select cells C8 through G10 (Number to Ship
from Plants to Warehouses).
15. In the operator list, click >=.
16. Click the Constraint box, and then type the number 0.
17. Click OK. This constraint ensures that you will not ship negative units to warehouses.
18. Click Options.
19. Select the Assume Linear Model check box, and then click OK. You can select this
option because the model is linear.
20. Click Solve.
Compare your results to Figure 4-37.
Staff Scheduling
The fourth worksheet, labeled Staff Scheduling and partially shown in Figure 4-38, is a model
that describes personnel scheduling for an amusement park. The goal for this model is to sched-
ule employees working five consecutive days with two days off in such a way to meet demand
from attendance levels while minimizing payroll costs. In this example, all employees are paid at
the same rate, so by minimizing the number of employees working each day, you also minimize
costs. Each employee works five consecutive days, followed by two days off.
CHAPTER 4 ■ SOLVER94
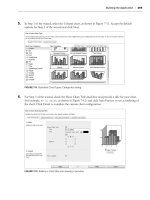
Figure 4-37. The Shipping Routes Solver sample worksheet after using Solver to forecast
minimized shipping costs while meeting warehouse demands, given several constraints
5912_c04_final.qxd 10/27/05 10:17 PM Page 94
To use Solver to schedule employees to meet demand from attendance levels while mini-
mizing payroll costs, do the following:
1. Click Tools
➤ Solver.
2. Click Reset All, and then click OK to clear Solver’s existing settings.
3. Click the Set Target Cell box, and then click cell D20 (Payroll Per Week).
4. Click Min.
5. Click the By Changing Cells box, and then select cells D7 through D13 (Total Number
of Employees).
6. Click Add.
7. Click the Cell Reference box, and then select cells D7 through D13 (Total Number of
Employees).
8. In the operator list, select Int.
9. Click Add. This constraint ensures that you will allocate only whole numbers for
employees.
10. Click the Cell Reference box, and then select cells D7 through D13 (Total Number of
Employees).
11. In the operator box, select >=.
12. Click the Constraint box, and then type the number 1.
13. Click Add. This constraint ensures that you will schedule at least one employee per day.
14. Click the Cell Reference box, and then select cells F15 through L15 (Schedule Totals).
CHAPTER 4 ■ SOLVER 95
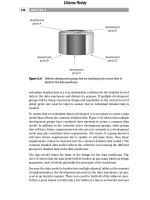
Figure 4-38. The Staff Scheduling Solver sample worksheet with its default values
5912_c04_final.qxd 10/27/05 10:17 PM Page 95
15. In the operator box, select >=.
16. Click the Constraint box, and then select cells F17 through L17 (Total Demand).
17. Click OK. This constraint ensures that you will have enough employees scheduled each
day to cover the schedule demands.
18. Click Options.
19. Check the Assume Linear Model check box, and then click OK. You can select this
option because the model is linear.
20. Click Solve.
Compare your results to Figure 4-39.
Maximizing Income
The fifth worksheet, labeled Maximizing Income and partially shown in Figure 4-40, is a
model that describes how to invest excess cash in one-month, three-month, and six-month
certificate of deposits (CDs). You can use Solver to forecast maximized interest income while
meeting company cash requirements, plus a safety margin.
CHAPTER 4 ■ SOLVER96
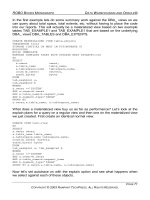
Figure 4-39. The Staff Scheduling Solver sample worksheet after using Solver to forecast schedule
demands from attendance levels while minimizing payroll costs, given several constraints
5912_c04_final.qxd 10/27/05 10:17 PM Page 96
In this example, you must trade off the higher interest rates available from longer-term
investments against the flexibility provided by keeping funds in short-term investments. This
model calculates ending cash based on initial cash from the previous month, inflows from
maturing CDs, outflows for new CDs, and cash needed for company operations for each month.
In this model, you have a total of nine decisions to make:
• The amounts to invest in one-month CDs in months 1 through 6
• The amounts to invest in three-month CDs in months 1 and 4
• The amount to invest in six-month CDs in month 1
To use Solver to forecast maximized interest income while meeting company cash
requirements, do the following:
1. Click Tools
➤ Solver.
2. Click Reset All, and then click OK to clear Solver’s existing settings.
3. Click the Set Target Cell box, and then click cell H8 (Total Interest Earned).
4. Click Max.
5. Click the By Changing Cells box. Then select cells B14 through G14, press and hold
down the Ctrl key, and click cells B15, E15, and B16 (CD Investments for One-Month
CDs in Months 1 Through 6, Three-Month CDs in Months 1 and 4, and Six-Month CDs
in Month 1).
6. Click Add.
7. Click the Cell Reference box, and then select cells B14 through G14 (CD Investments
for One-Month CDs in Months 1 Through 6).
8. In the operator list, select >=.
CHAPTER 4 ■ SOLVER 97
Figure 4-40. The Maximizing Income Solver sample worksheet with its default values
5912_c04_final.qxd 10/27/05 10:17 PM Page 97
9. Click the Constraint box, and then type the number 0.
10. Click Add. This constraint ensures that you will invest a nonzero amount for these CDs.
11. Click the Cell Reference box, and then select cells B15 and B16 (CD Investments for
Three-Month CDs and Six-Month CDs in Month 1).
12. In the operator list, select >=.
13. Click the Constraint box, and then type the number 1.
14. Click Add. This constraint ensures that you will invest a nonzero amount for these CDs.
15. Click the Cell Reference box, and then select cells B18 through H18 (Total End Cash).
16. In the operator list, select >=.
17. Click the Constraint box, and then type 100000.
18. Click Add. This constraint ensures that you will forecast at least $100,000 in ending cash.
19. Click the Cell Reference box, and then select cell E15 (CD Investment for Three-Month CD
in Month 4).
20. In the operator list, select >=.
21. Click the Constraint box, and then type the number 1.
22. Click OK. This constraint ensures that you will invest a nonzero amount for this CD.
23. Click Options.
24. Check the Assume Linear Model check box, and then click OK.
25. Click Solve.
Compare your results to Figure 4-41.
CHAPTER 4 ■ SOLVER98
Figure 4-41. The Maximizing Income Solver sample worksheet after using Solver to forecast
maximized interest income while meeting company cash requirements, given several
constraints
5912_c04_final.qxd 10/27/05 10:17 PM Page 98
Portfolio of Securities
The sixth worksheet, labeled Portfolio of Securities and partially shown in Figure 4-42, is a
model that describes an efficient securities portfolio. You can use Solver to find the allocation
of funds to stocks that minimizes the portfolio risk for a given rate of return, or that maximizes
the rate of return for a given level of risk.
To use Solver to maximize the rate of return, do the following:
1. Click Tools
➤ Solver.
2. Click Reset All, and then click OK to clear Solver’s existing settings.
3. Click the Set Target Cell box, and then click cell E18 (Total Rate of Return).
4. Click Max.
5. Click the By Changing Cells box, and then select cells E10 through E14 (Weight of
Each Stock).
6. Click Add.
7. Click the Cell Reference box, and then select cells E10 through E14 (Weight of
Each Stock).
8. In the operator list, select >=.
9. Click the Constraint box, and type the number 0.
10. Click Add. This constraint ensures that you will invest a nonzero weight for at least one
stock.
11. Click the Cell Reference box, and then select cell E16 (Total Stock Weight).
12. In the operator list, select =.
CHAPTER 4 ■ SOLVER 99
Figure 4-42. The Portfolio of Securities Solver sample worksheet with its default values
5912_c04_final.qxd 10/27/05 10:17 PM Page 99
13. Click the Constraint box, and then type the number 1.
14. Click Add. This constraint ensures that you will allocate total stock weights so that they
all add up to 100%.
15. Click the Cell Reference box, and then select cells G18 (Total Variance).
16. Click the Constraint box, and then type 0.071.
17. Click OK. This constraint ensures that you will have a total variance of equal to or less
than 7.1%.
18. Click Options.
19. Clear the Assume Linear Model check box, and then click OK. You need to do this
because the model is nonlinear.
20. Click Solve.
Compare your results to Figure 4-43.
Engineering Design
The seventh worksheet, labeled Engineering Design and partially shown in Figure 4-44, is a
model that describes how to find the value of a resistor in an electrical circuit that will dissi-
pate the charge to 1% of its original value within 1/20 second after the switch is closed. This
model depicts an electrical circuit containing a battery, switch, capacitor, resistor, and an
inductor. With the switch in the left position, the battery charges the capacitor. When the switch
is in the right position, the capacitor discharges through the inductor and the resistor, both of
which dissipate electrical energy. You can use Solver to pick an appropriate value for the resis-
tor, given values for the inductor and the capacitor.
CHAPTER 4 ■ SOLVER100
Figure 4-43. The Portfolio of Securities Solver sample worksheet after using Solver to maximize
the rate of return, given several constraints
5912_c04_final.qxd 10/27/05 10:17 PM Page 100
To use Solver to pick the appropriate value for the resistor, do the following:
1. Click Tools
➤ Solver.
2. Click Reset All, and then click OK to clear Solver’s existing settings.
3. Click the Set Target Cell box, and then click cell G15 (Total Charge at Given Time).
4. Click Value Of. Then type 0.09 in the Value Of box.
5. Click the By Changing Cells box, and then select cell G12 (Resistor).
6. Click Options.
7. Clear the Assume Linear Model check box, and click OK. (This model is nonlinear.)
8. Click Solve.
Compare your results to Figure 4-45.
CHAPTER 4 ■ SOLVER 101
Figure 4-44. The Engineering Design Solver sample worksheet with its default values
5912_c04_final.qxd 10/27/05 10:17 PM Page 101
Troubleshooting Solver
The following are the main scenarios in which Solver won’t run, stops before it finds a solu-
tion, or reaches a solution that doesn’t seem correct to you:
• You cannot run Solver because of a problem when you choose Tools
➤ Solver.
• You cannot have Solver begin finding a solution because there is a problem with a
specific Solver dialog box setting.
• Once you start Solver, it cannot find a solution because it has reached some predefined
limit in the model, or there is simply no possible solution to the problem.
• Solver finds a solution that you discover is incorrect, because you defined the problem
incorrectly.
This section describes how to troubleshoot these main scenarios.
General Excel Error Messages
The following are the most common error messages that Solver can display after you click
Tools
➤ Solver:
Active Document Is Not a Worksheet or Is Protected: This message is displayed when a pro-
tected worksheet is active when you click Tools
➤ Solver. To solve this problem, unprotect
the worksheet.
Cannot Do This Command in Group Edit Mode: This message is displayed if multiple work-
sheets are selected when you click Tools
➤ Solver. To Solve this problem, select only one
worksheet.
CHAPTER 4 ■ SOLVER102
Figure 4-45. The Engineering Design Solver sample worksheet after using Solver to forecast the
appropriate value for the resistor
5912_c04_final.qxd 10/27/05 10:17 PM Page 102
Cannot Do This Command in Data Entry Mode: This message is displayed if Excel is in
data entry mode at the time you select the Solver menu choice. To solve this problem,
exit data entry mode.
Solver Dialog Box Error Messages
Solver dialog box error messages usually appear because you attempt to define a particular set-
ting for a model, and that setting is not allowed in a Solver dialog box. However, even after you
define all of your settings and start Solver, it may stop running for several reasons. The error
messages you may see in each of Solver’s dialog boxes and how to address them are described
in the following sections.
Solver Parameters Dialog Box
The Solver Parameters dialog box’s most common error messages include the following:
Set Target Cell Contents Must Be a Formula: This message appears because the contents
of the Set Target Cell box refer to a cell that doesn’t contain a formula. To correct this
problem, make sure that the Solver Parameter’s dialog box’s Set Target Cell box contains
a reference to a cell that contains a formula.
Problem to Solve Not Specified: This message appears if you click the Solve button and you
have not specified any adjustable cells in the By Changing Cells box, or if you have not
specified a cell reference in the Set Target Cell box nor any constraints. To correct this
problem, make sure that you have set, as a minimum, a cell reference in the Set Target
Cell and By Changing Cells boxes.
By Changing Cells Must Be on the Active Sheet: This message appears if any of the cells
referenced in the By Changing Cells box are not within the active worksheet. To correct
this problem, redesign your model so that all the changing cells are all located on the
active worksheet, and try running Solver again.
Cannot Guess By Changing Cells Without a Set Cell: This message appears if you click the
Guess button without first referencing a cell in the Set Target Cell box. To correct this prob-
lem, click the Set Target Cell box and type or click the problem’s target cell.
Cell Reference Box Is Empty or Contents Are Not Valid: This message appears in the Add/
Change Constraint dialog box if you click OK and the Cell Reference box is empty or con-
tains something other than a valid cell reference. To solve this problem, correct the contents
of the Cell Reference box to contain a valid cell reference, and then click OK again.
Constraint Must Be a Number,Simple Reference, or Formula with a Numeric Value: This mes-
sage appears in the Add/Change Constraint dialog box if you click OK and the Constraint
box is empty or doesn’t contain a reference to a number, a cell reference, or a formula with
a numeric value. To solve this problem, correct the contents of the Constraint box to refer-
ence a number, a cell reference, or a formula with a numeric value, and then click OK again.
Integer Constraint Cell Reference Must Include Only By Changing Cells: This message appears
in the Add/Change Constraint dialog box if you click Int in the operator box, but the cells ref-
erenced in the Cell Reference box are not changing cells. To correct this problem, correct the
contents of the Cell Reference box to reference changing cells.
CHAPTER 4 ■ SOLVER 103
5912_c04_final.qxd 10/27/05 10:17 PM Page 103
Set Target Cell Must Be a Single Cell on the Active Sheet: This message appears if the refer-
ence in the Set Target Cell box contains something other than a single cell. To address this
problem, correct the contents of the Set Target Cell box to reference a single cell on the
active worksheet.
Set Target Cell Contents Must Be a Formula: This message appears if the cell referenced in
the Set Target Cell box contains something other than a formula on the active worksheet.
To address this problem, correct the contents of the Set Target Cell box to reference a cell
on the active worksheet containing a formula that depends on changing cells on the active
worksheet.
Set Target Cell Must Have Precedents Containing Numbers on the Active Sheet: This mes-
sage appears if the cell referenced in the Set Target Cell box contains something other than
a formula that depends on cells on the active sheet, some of which must be changing cells
as referenced in the By Changing Cells box. To address this problem, correct the contents
of the Set Target Cell box to reference a single cell on the active worksheet containing a
formula that depends on changing cells on the active worksheet.
Too Many Adjustable Cells: This message appears if the number of cells referenced in the
By Changing Cells box exceeds Solver’s limits. To correct this problem, reduce the number
of cells referenced in the By Changing Cells box.
Too Many Constraints: This message appears in the Add/Change Constraint dialog box if
the number of cells in the Cell Reference edit box exceeds Solver’s limits. To correct this
problem, reduce the number of cells referenced in the Cell Reference box.
The Problem Is Too Large for Solver to Handle: This message appears when the total number
of cells referenced in all constraints in the Subject to the Constraints list exceeds Solver’s
limits. To correct this problem, reduce the total number of cells referenced in the Subject
to the Constraints list.
Unequal Number of Cells in Cell Reference and Constraint: This message appears in the
Add/Change Constraint dialog box if the number of cells referenced in the Cell Reference box
is not equal to the number of cells referenced in the Constraint box. To correct this problem,
change the contents of the Cell Reference box or the Constraint box so that the number of
cells in the Cell Reference box equals the number of cells referenced in the Constraint box.
Solver Options Dialog Box
The Solver Options dialog box’s most common error messages include the following:
Max Time Must Be a Positive Number: This error message appears because the Max Time
box’s value is less than 1. To correct this problem, type a value of 1 or greater in the Max
Time box.
Iterations Must Be a Positive Number: This error message appears because the Iterations
box’s value is less than 1. To correct this problem, type a whole number value of 1 or greater
in the Iterations box.
Precision Must Be a Small Positive Number: This error message appears because the Preci-
sion box’s value is less than or equal to 0 or greater than or equal to 1. To correct this
problem, type a fractional number between 0 and 1 in the Precision box.
CHAPTER 4 ■ SOLVER104
5912_c04_final.qxd 10/27/05 10:17 PM Page 104
Integer Tolerance Must Be a Number Between 0 and 100: This error message appears because
the Tolerance box’s value is less than 0 or greater than 100. To correct this problem, type a
value equal to or between 0 and 100 in the Tolerance box.
Convergence Must Be a Small Positive Number: This error message appears because the
Convergence box’s value is less than or equal to 0 or greater than or equal to 1. To correct
this problem, type a fractional number between 0 and 1 in the Convergence box.
Solver Results Dialog Box
When Solver stops, regardless or whether it finds a solution, the Solver Results dialog box appears
and displays a message. If this message is something other than that Solver found a solution, you
can use the following troubleshooting tips based on the type of message displayed:
Solver Cannot Improve the Current Solution. All Constraints Are Satisfied: This message is
displayed when Solver finds an approximate solution but cannot find a better set of val-
ues than those displayed. This is either because further accuracy is simply not achievable
or the Precision setting is too low. To try to improve the current solution, try increasing
the Solver Options dialog box’s Precision setting to a larger number, and then running the
problem again.
Stop Chosen When the Maximum Time Limit Was Reached: This message is displayed when
Solver reaches the maximum amount of time specified without finding a satisfactory solu-
tion. To save the values that Solver found so far, as well as save future recalculation time,
click either the Keep Solver Solution button or the Save Scenario button.
Stop Chosen When the Maximum Iteration Limit Was Reached: This message is displayed
when Solver reaches the maximum number of iterations specified without finding a satis-
factory solution. To save the values that Solver found and reduce future recalculation time,
click the Keep Solver Solution button or the Save Scenario button. Increasing the number
of iterations in the Solver Options dialog box’s Iterations box might help Solver find a solu-
tion, but you should also consider examining the final values for insight into the problem.
The Set Target Cell Values Do Not Converge: This message is displayed when Solver cannot
reach an upper or lower bound for the target cell, even though Solver may have met all of
the model’s constraints. This message usually appears because you may have omitted one
or more constraints when you set up the model. To address this problem, check the cur-
rent worksheet values to see how the solution is diverging, recheck the constraints, and
then run Solver again.
Solver Could Not Find a Feasible Solution: This message is displayed when Solver cannot
find a proposed solution that satisfies all of the model’s constraints while still achieving
the Solver Options dialog box’s Precision setting. This message usually appears due to
inconsistent constraints. To address this problem, examine the worksheet for a possible
mistake in the constraints’ formulas or in the choice of constraints.
Solver Stopped at User’s Request: This message is displayed when you click the Show Trial
Solution dialog box’s Stop button, either when stepping through trial solutions or after
pressing the Esc key to interrupt the solution process.
CHAPTER 4 ■ SOLVER 105
5912_c04_final.qxd 10/27/05 10:17 PM Page 105
The Conditions for Assume Linear Model Are Not Satisfied: This message is displayed when
the Solver Options dialog box’s Assume Linear Model check box is selected, but Solver
proposed values do not agree with a linear type of model. To check whether a problem is
nonlinear, select the Solver Options dialog box’s Use Automatic Scaling check box, and
then run Solver again. If the same message reappears, clear the Assume Linear Model
check box, and then run Solver again.
The Problem Is Too Large for Solver to Handle: This message is displayed when Solver deter-
mines that your model has too many decision variables or constraints. You will usually see
this message only after you see a Too Many Adjustable Cells or Too Many Constraints mes-
sage in the Solver Parameters dialog box. Solver can also display this message when there
is an error in one of the cells on the right-hand side of a constraint. For example, if you have
a constraint A1:A2 >= B1:B2, and B2 contains a #VALUE value, this message may appear.
Solver Encountered an Error Value in a Target or Constraint Cell: This message is displayed
when Solver discovers an error value after its latest calculation. To address this message,
find the target cell or constraint cell that contains the error, and do one of the following:
• Change the constraint cell’s formula to return an appropriate numeric value.
• Make sure the constraints’ names and formulas are valid in the Add Constraint
dialog box for each constraint.
• Make sure you did not type Integer, Int, Binary, or Bin in any of the constraints’
Add Constraint dialog boxes’ Constraint boxes. Recall that to constrain a value to
an integer, you just need to click Int in the operator list. Click Bin in the operator
list to set a binary constraint.
There Is Not Enough Memory Available to Solve the Problem: This message is displayed
when Excel cannot allocate enough computer memory to Solver. To address this message,
close some files or programs, and then run Solver again.
Another Excel Instance Is Using SOLVER.DLL: This message is displayed when more than
one Excel instance is running, and one of those Excel instances is already using Solver.
Only one Excel instance can use Solver at a time. To address this message, stop Solver if
it is running in any open Excel instance, or close all Excel instances that you are not cur-
rently using, and run Solver again.
Show Trial Solution Dialog Box
The Show Trial Solution dialog box’s most common error message is the following:
The Scenario Manager Changing Cells Do Not Include All The Solver Changing Cells. Only
The Scenario Manager Cell Values Will Be Saved: This message is displayed when you try
to save the current changing cells’ values as a scenario by clicking the Scenario button
(this button is also available in the Solver Results dialog box), and you have previously
used the Scenario Manager dialog box to define scenarios where the changing cells do
not include all of the current changing cells. To solve this problem, modify the Scenario
Manager dialog box’s changing cells (by clicking Tools
➤ Scenarios), and then run Solver
again.
CHAPTER 4 ■ SOLVER106
5912_c04_final.qxd 10/27/05 10:17 PM Page 106
General Troubleshooting Tips
If Solver does display a recommended solution, but you think that the solution is incorrect for
some reason, try one or more of the following troubleshooting tips:
• Return to your model and check whether the selected target cell and the selected
changing cells are relevant in the context of your problem.
• Examine the target cell’s function definition and any constraints’ function definitions
for possible logic errors.
• Examine all of your constraints’ definitions for possible logic errors.
• Make sure that all of your changing cells are somehow related to the target cell.
• Make sure that you have not omitted any important constraints from your model.
• Examine the Solver Options dialog box for any possible incorrect settings.
• Look for patterns in both the changing and nonchanging cells’ data and form your own
predictions about how what an optimal solution might look like. Then vary your cells’
data and attempt to confirm your predictions on subsequent Solver runs.
• Look for named cell ranges that reference a worksheet that is not the current one.
Although the reference is allowed, the actual cell value that is used is of the corres-
ponding cell on the active sheet and not the one to which the reference is pointing.
Summary
In this chapter, you learned how to use Solver to help you find the desired exact value, minimum
possible value, or maximum possible value for a single worksheet cell formula. You learned how
to instruct Solver to use constraints to apply restrictions to the cell values that Solver can use to
find your desired value, how to set Solver options, and how to generate and interpret Solver
reports. To practice working with Solver, you completed three basic Try It exercises, as well as
seven more involved exercises. Finally, you learned how to troubleshoot common problems
with using Solver.
CHAPTER 4 ■ SOLVER 107
5912_c04_final.qxd 10/27/05 10:17 PM Page 107
5912_c04_final.qxd 10/27/05 10:17 PM Page 108
Case Study: Using Excel
What-If Tools
The preceding chapters have introduced four Excel what-if data analysis tools: Goal Seek,
data tables, scenarios, and Solver. This chapter presents a case study demonstrating how a
fictional running club, called the Ridge Running Cooperative, might use each of these what-if
tools to produce reports and tools to assist runners. In the exercises in this chapter, you will
use Goal Seek to forecast membership dues, data tables to forecast race paces, scenarios to
forecast race-day cash flow, and Solver to forecast race-day finish times as well as pair up race
relay teams.
About the Ridge Running Cooperative
Four years ago, residents of Red Hills Ridge, a city in the western part of the United States,
formed a local running club named the Ridge Running Cooperative. Members of this not-
for-profit cooperative volunteer their time at local running events in exchange for receiving
special discounts on running apparel and nutritional supplements at several local athletic
supply retail stores. Some of the club’s members also serve as board members to oversee the
cooperative’s activities. At the end of every year after the club’s operating expenses are paid,
the board members distribute any remaining profits to track and field organizations in the
local public school systems.
At the board’s annual meeting toward the end of this year, board members have tradition-
ally provided the following reports to all attending club members:
• A forecast of next year’s annual membership dues income
• A forecast of next year’s incoming cash flow from registrants for the annual Red Hills
Ridge Labor Day race event
In addition, club members have asked the board’s activities director to supply some spe-
cial computer-based tools to assist runners. They would like tools to do the following:
• Forecast race paces
• Forecast race-day finish times
• Pair up relay race teams
109
CHAPTER 5
■ ■ ■
5912_c05_final.qxd 10/27/05 11:39 PM Page 109
The board’s activities director has committed to producing these tools on compact disc
(CD), which will be distributed to attending club members at the annual meeting.
The board’s treasurer and activities director have decided to use the Excel what-if tools
to produce these reports and tools. The following sections present a series of exercises to allow
you to practice producing these reports and tools.
Use Goal Seek to Forecast Membership Dues
In this section, you will use Goal Seek to forecast next year’s total club membership dues.
This section’s exercises are available in the Excel workbook named Ridge Running
Exercises.xls, which is available for download from the Source Code area of the Apress web
site (). These exercises’ data is on the workbook’s Membership Dues
worksheet, as shown in Figure 5-1.
This worksheet contains the following information:
• New individual membership dues at a rate of $30.00 per year (cell B1, defined name
NIMAD)
• Renewing individual membership dues at a rate of $25.00 per year (cell B2, defined
name RIMAD)
• New individual lifetime membership dues at a one-time rate of $275.00 (cell B3,
defined name NIMLM)
• New family membership dues at a rate of $55.00 per year (cell B4, defined name NFAD)
• Renewing family membership dues at a rate of $45.00 per year (cell B5, defined name
RFAD)
CHAPTER 5 ■ CASE STUDY: USING EXCEL WHAT-IF TOOLS110
Figure 5-1. The Membership Dues worksheet
5912_c05_final.qxd 10/27/05 11:39 PM Page 110
• New family lifetime membership dues at a one-time rate of $400.00 (cell B6, defined
name NFLM)
• The number of new annual individual memberships (cell B8, defined name NIAM)
• The number of renewing annual individual memberships (cell B9, defined name RIAM)
• The number of new individual lifetime memberships (cell B10, defined name NLIM)
• The number of new annual family memberships (cell B11, defined name NAF)
• The number of renewing annual family memberships (cell B12, defined name RAF)
• The number of new family lifetime memberships (cell B13, defined name NLM)
• The products of each dues level multiplied by the number of memberships at that level
(cells C8 through C13)
• The total number of memberships (cell B15)
• The total membership dues (cell C15)
New Lifetime Family Club Membership Dues
Use Goal Seek to forecast how many new lifetime family club memberships are needed to
achieve an overall club membership dues total of $30,000, assuming that all other club mem-
bership levels are constant.
1. Type the following values in the following cells:
B8: 95
B9: 135
B10: 35
B11: 40
B12: 65
2. Click Tools
➤ Goal Seek.
3. Click the Set Cell box, and then click or type cell C15.
4. Click the To Value box, and then type 30000.
5. Click the By Changing Cell box, and then click or type cell B13.
6. Click OK, and then click OK again.
Compare your results to Figure 5-2. Note that the values are approximate due to the for-
matting and subsequent rounding of member and financial totals.
CHAPTER 5 ■ CASE STUDY: USING EXCEL WHAT-IF TOOLS 111
5912_c05_final.qxd 10/27/05 11:39 PM Page 111