Candlestick and pivot point trading triggers setups for stock forex and futures markets 2007 phần 9 doc
Bạn đang xem bản rút gọn của tài liệu. Xem và tải ngay bản đầy đủ của tài liệu tại đây (4.27 MB, 37 trang )
downs for long periods, then it is most likely a poor system for an average
investor to trade. When you are designing your system, ask yourself what
you want this system to do. The obvious answer is to make money; but you
also want to know how long and how deep the drawdown periods are or
whether there are consistently more winners than losers. As a trader you
need to evaluate new techniques, especially ones that increase your prof-
itability while reducing your risk and exposure in the market. Systems need
to be developed with the idea of triggering a turning point in the market ear-
lier than other indicators and other traders do. Considering that most indi-
cators are lagging, you need a signal that identifies turning points as they
occur, and you need to use indicators to confirm that the position is valid.
Pivot point analysis does just that, especially when combining support and
resistance levels and by implementing a moving average approach
One of the best features or benefits to using mechanical trading sys-
tems is that they alert a trader to initiate a trade or to act on a signal as it oc-
curs, rather than on a hunch or on the two main destructive emotional
elements, fear and greed. Based on a system that is tested, you have statis-
tical evidence to validate the entry; and that should help eliminate trading
on a hunch, a rumor, or a feeling, which is what drives most trading deci-
sions from inexperienced traders. As this book has demonstrated, it is not
my intention to portray the ability to buy the exact low or sell the exact
high. In most cases, I am looking for a definitive trend or price reversal to
occur; and then I act on that signal and carry a position until the market
demonstrates a loss in momentum, the time to exit the trade. The keys to
winning are the ability to practice patience and wait for the setup to de-
velop and the discipline to act on the trigger. Mostly, it is the ability to exit
a losing trade as the signals dictate, not to hang onto the loser. So when
using a system, you will know and understand that the mechanics are never
100 percent right and that you will have a certain number of trades that do
not work out. Once you come to grips with that fact, it will be easier to em-
brace your losses rather than become emotionally wrangled when they
occur. Hopefully, you can learn from a trader with long-term positive ex-
periences. Good advice will get you ahead more quickly than if you have to
learn everything on your own, and it will help you avoid costly mistakes.
Take my advice: Learn a system, back-test it to see the strengths and weak-
ness of the method, and then trade on these testable signals.
SEASONAL STOCK SYSTEM
Jeff Hirsch and his father, Yale, who publish Stock Trader’s Almanac
(Wiley, 2004, 2005), reveal many top-notch statistical studies based on past
282
CANDLESTICK AND PIVOT POINT TRADING TRIGGERS
c11.qxd 9/25/06 8:43 AM Page 282
historic price action. Many of their strategies are based on seasonal factors
that help stock pickers time the markets. One of the methods they promote
is using a simple MACD developed by Gerald Appel to better time entries
and exits during the best six-month period for stocks, which starts in Oc-
tober. Once a market bottoms out and develops in an uptrend, the MACD
indicator triggers confirmation that a price reversal is underway. The
MACD signals help traders time their entries. However, as we uncovered in
prior chapters, it is a lagging indicator. With that said, I believe what can
make that buying program or system more effective is to add and apply a
weekly and/or monthly pivot point study. This may give a trader an edge by
adding another dimensional element that combines the seasonal factor for
timing with targeting a price level from pivot points. Using this approach
can help light the path to a trading system that a trader can back-test on his
or her own through software such as Genesis.
HISTORY LESSONS
I want to combine the lessons on how to choose the right pivot point sup-
port and resistance numbers with how those values relate to the market di-
rection number. This can help you determine if the market has departed
too far from the mean or too far from what I call the “fair value” of the mar-
ket. Start by examining the past price history. Once you see where the mar-
ket was and how far the market has moved in a given length of time (pace
of price change), you can possibly determine the realm of reality of where
a target level of support may be located. You can use this information to de-
termine if a market is significantly overbought or, as we will show in this
example, oversold and ripe for a buying opportunity. When a market is sig-
nificantly oversold, the conditions exist for a consolidation phase and a re-
versal of trend, especially when we have a seasonal condition. This
concept applies in commodities, stocks, and foreign exchange (forex) mar-
kets as well.
Let’s take a look at how the bottom formed in the stock market in Oc-
tober 2005 as we review and expand on the Stock Trader’s Almanac MACD
signal. Figure 11.1 is my sheet from the week ending October 14. We use
this sheet as a quick reference so I can see what the past week’s high, low,
and close were. The pivot point is displayed in the far right column. We see
that in the prior week, the high in Standard & Poor’s (S&P) was 1239. The
pivot point is 1208, and the pivot point moving average is 1220.58 (round
down to 1220.50). The indication is that the market is bearish, so we would
look at the Bearish Target column and see 1155. Here is where back-testing
software may help you determine what the largest price range is in a given
The Sample Analysis 283
c11.qxd 9/25/06 8:43 AM Page 283
284
FIGURE 11.1
Used with permission of www.nationalfutures.com.
c11.qxd 9/25/06 8:43 AM Page 284
week in the S&P on a historic basis. Why is that relevant? Because I want
to know if 1155 is an unrealstic number to hit if the market was at 1239 and
the standard range was 40 points. From the prior week’s high to the pro-
jected bearish S-2 target low, that would be an 84.00-point price decline.
Not unheard of but not realistic, at least not in one week’s trading period.
At the very least, we need to see how the market reacts at the S-1 target sup-
port number, 1177.50, labeled as the Target Key Number, which is the S-1
pivot number.
On further examination, we see the market closed the week ending
10/07/2005 at 1200. So sometime in the following week, I want to heighten
my awareness or program a system to alert me to when or if the market
reaches that level and if a buy signal exists at or near 1177.50, such as if a
hammer or doji is present within five points above or below that level. After
all, we have a decent sample of statistics that reveal that these two candle
patterns form at or near the lows in e-mini–S&Ps a high percentage of the
time on an intraday 15-minute period.
The low was made on 10/13/2005 at 1172; it closed that day back above
the pivot support at 1178.25. The next session formed a high close doji
(HCD). Using the HCD pattern and trading by the rules, you would have
bought at 1189.75; and your risk was a stop on a close below the doji low,
which was at 1172. The most pressure you took on a futures position trade
was from your entry price to the lowest low on a pull-back was when it
retested the low at 1174, which is 16 points. The stop-close-only order was
the correct risk mechanism for this position trade. Using a seasonal factor
combined with pivot point analysis helped traders pinpoint both the time
and the price of a particular market; and in using historical seasonal infor-
mation, traders would possibly want to employ a longer-term risk-and-
reward strategy. Even if you are a one-day or swing trader, seasonal factors
can help identify the side of the market to be on, like in a bullish environ-
ment to look to buy breaks. My point is that if you are a position trader,
your risks and reward objectives should be greater than those of a day
trader. Here we have a trading opportunity based on several factors. All we
need to do now is select a strategy.
WHICH STRATEGY TO SELECT?
If buying the futures markets seemed too risky, you at least have a situation
where you can explore longer-term low-risk/high-reward options strate-
gies such as S&P call options. That was my recommendation in my weekly
newsletter. You could apply this analysis to buy Standard & Poor’s De-
positary Receipts (SPDRs), Diamonds, Nasdaq QQQs, or options on those
The Sample Analysis 285
c11.qxd 9/25/06 8:43 AM Page 285
exchange traded funds. That is one reason why I spent time going over
those products in Chapter 1. Seriously, if you are just a day trader in fu-
tures or forex or simply a stock trader, diversification is a trader’s best
friend. Anyone who is after profits and making money can apply these
techniques. To any investment vehicle, a trading system can be pro-
grammed to alert you when dojis form near pivots support or resistance
levels. Moving average crossover features using various parameter settings
can also be applied. This form of market analysis is adaptable and very ver-
satile for integrating in a trading system.
WHAT ABOUT THE MACD?
Pivot point analysis enhances what Stock Trader’s Almanac reveals. Look-
ing at the chart again in Figure 11.2, you see how the MACD indicator gave
a buy signal triggered by the zero-line crossover and a moving average
crossover on October 24. This was generated on the close at 1202.25. Not
286
CANDLESTICK AND PIVOT POINT TRADING TRIGGERS
FIGURE 11.2
Used with permission of esignal.com.
c11.qxd 9/25/06 8:43 AM Page 286
knowing the risk you want to take with the MACD seasonal buy signal, if
you bought at that price at that time, the most pressure you took on the
trade was 22 points, slightly more than the high close doji trigger signal.
Also the MACD signal came a bit later. This is why all traders can use pivot
point support and resistance analysis to help time trades better with both
elements, time and price.
I went over how to use the pivot point as a moving average in Chapter
6. In Figure 11.3, I took the liberty of highlighting the pivot point to illustrate
the slope (or direction) of the moving average. Once the market hits the
pivot support, the market moves in a consolidation phase; but the pivot
point average is sloping higher, indicating a bullish bias. Granted, you al-
ways want to see immediate results as a trader; but using the seasonal fac-
tors identified by Stock Trader’s Almanac combined with pivot point
support targets and a pivot point moving average component gives you a
much better timed entry and method to identify a trend reversal.
One more advantage of incorporating the pivot point average is that as
the market finally blasts off, the moving average component generates a
sell signal and the histogram makes a negative zero-line cross. However,
The Sample Analysis 287
FIGURE 11.3
Used with permission of esignal.com.
Pivot point moving average
slopes higher.
Pivot point moving average
slopes higher.
c11.qxd 9/25/06 8:43 AM Page 287
that is the opposite of what prices are showing from the candle patterns, as
we do not see a succession of lower closing lows. In addition, the pivot
point moving average is sloping higher, once again indicating a bullish bias.
From a systems programmer looking for a defined set of rules, when you
develop your own system, it is important to make sure that your set of cri-
teria or the series of conditions that exist all need to be in sync, such as all
must be generating sell signals, before making your entry or exit triggers.
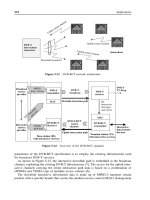
In Figure 11.4, the Genesis Software has my algorithms programmed
with variations of what was covered in this book to show you how you
can develop your own personal “black box” system. As this illustrates,
for my day trading program, I use both the 5-minute and the 15-minute
periods with the e-mini–S&P, the Chicago Board of Trade (CBOT)
mini-Dow, 30-year Treasury bonds, euro currency, and the spot forex
British pound. Except for in this figure, the one chart that is second from
the right is a 5-minute chart on bonds; and under it is a 15-minute chart on
the euro currency.
I use this system to help confirm buy and sell signals, as indicated with
the arrows. When we are at the projected support targets, which the soft-
ware indicates by green support lines, arrows appear, indicating to go long.
The chart on the left is the e-mini–S&P; the 5-minute is on top and the 15-
minute is beneath it. See how arrows point up simultaneously, which indi-
cates a buy signal, especially as the market is near support. The chart
second from the left is the mini-Dow with the 5-minute on top and the 15-
minute beneath it. The 5-minute time period generates a buy signal against
the pivot point support targets simultaneously with the e-mini–S&P. This
corroborates the buy signal, as it has developed in both markets. It is also
confirmed in the 15-minute chart beneath it.
WHAT IS THE BEST DAY TRADING CONFIRMATION
TRIGGER TO PROGRAM?
The most reliable trading signal is when the 5-minute time period triggers
a buy when the 15-minute time period is also in a buy mode; in other words,
the best signals are when the 5-minute period is in sync with the 15-minute
time period in a pivot point moving average crossover system. We see this
occur as it applies to day trading the spot forex British pound as the chart
in Figure 11.4 shows. Look on the right-hand side of the chart; in the upper
right-hand corner is the 5-minute period, and directly below it is the 15-
minute chart. See how the 5-minute generates the sell signal first, as it is
against the projected pivot point resistance targets; and the 15-minute chart
beneath it confirms that sell signal. This is exactly what we want to see—a
288
CANDLESTICK AND PIVOT POINT TRADING TRIGGERS
c11.qxd 9/25/06 8:43 AM Page 288
289
FIGURE 11.4
Used with permission of www.GenesisFT.com.
c11.qxd 9/25/06 8:43 AM Page 289
sell signal triggered against resistance; and the higher time period, such as
the 15-minute component to the 5-minute sell signal, confirming that action.
SHOW ME THE PROOF
As a systems trader, once you have set your variables or your best selected
set of rules or criteria and have defined the parameters such as time peri-
ods, then you can go and back-test the method. I want to show you that any
system worth following needs to show sizable profits with reasonable risks.
No system is 100 percent accurate, at least none that I know of in reality. If
one existed, I would believe through the laws of probabilities that it was
due for a breakdown. There are several categories on which you want to
focus that will enlighten you as to the true validity of the methods. In
essence, back-testing allows you to closely examine your system’s ineffi-
ciencies so you can correct the flaws. Looking at the back-test results will
also help you understand when to increase position sizes, when to avoid
trading, and how to facilitate improvements.
You want to see if the reasons you make decisions to execute a trade
consistently generate more profits when you are right than losses when the
system or trade fails. If less than 70 percent of trades result in winning
trades, you want the winners to outgain the losses. It makes no sense to
have a 70 percent winning system that generates more losses than winners
and longer holding periods. Imagine what that will do to your psyche, not to
mention your trading account.
It is important that you understand what elements trigger a trade when
the transaction is entered or exited. This helps in determining another way
to account for slippage. For example, if the system generates buy and sell
signals on the close or on the next open, if this is a day trading program,
then there may be less chance for price gaps. However, if the system exe-
cutes based on the closing price or on the next open, such as what we have
disclosed in the high close doji pattern or the low close doji pattern, then on
overnight positions you may experience poor entry or exits. With that
knowledge, you can change your program to include the next available
open, which would include night sessions.
Let me clarify what the night session is for various trading vehicles. As
we know, there is no official close in spot foreign currencies. Therefore,
you need to assign a daily close and then an open. In Chapter 1, I revealed
that I use the New York Bank settlement of 5
P
.
M
. (ET) and use the open as
the next five-minute interval. As for futures, different exchanges on which
various markets trade have specific official closes and reopens for their
after-hours trading markets. The Chicago Mercantile Exchange (CME) has
290
CANDLESTICK AND PIVOT POINT TRADING TRIGGERS
c11.qxd 9/25/06 8:43 AM Page 290
GLOBEX, the CBOT has the e-CBOT, and the New Mercantile Exchange
(NYMEX) started using the CME’s electronic trading platform in June 2006.
The partnership between the CME and the NYMEX begins a 10-year deal
that allows the NYMEX to use the CME’s GLOBEX platform to electroni-
cally trade both energy and metal futures and options. This promises to give
better access to traders worldwide for those specific markets.
If you are reading this book, I assume that you already know the vari-
ous market hours; but if not, visit www.nationalfutures.com, where they
are listed under Trading Tools, which has the current margin requirements,
contract specifications, and trading hours listed. In Table 11.1, I have a de-
scription of the categories that are important in helping to determine a sys-
tem’s validity.
In Table 11.2, we have results from a pivot point moving average
system I developed with the help of Pete Kilman at Genesis. It is what I
call the “Defcon” day traders’ program system. As I stated before, this is
not 100 percent accurate. I do not know of any system that is; but it is a
The Sample Analysis 291
TABLE 11.1 Determining a System’s Validity
Total net profit This number tells you how much the system made
after slippage, commissions, fees, and losses.
Payout ratio This tells you based on a profit/loss the percent that
winners outpace losers.
Avgerage number of This category shows what the average time period was
bars for winners before the trade was offset in order to establish a
profit.
Win percent This figure shows how many winners versus losers
were generated.
Kelly ratio A math calculation used to derive the number of
contracts to trade in relation to the ratio of winning
trades to losing trades.
Largest win This figure shows the largest single winning trade. We
look at this number to see if profits on a single trade
are larger than 20 percent of the overall net profit. If it
is, it indicates the trade signals may be invalid.
Largest loss This category helps traders identify if single losses are
bigger than winners so they can implement a better
risk management approach.
Average win trade This shows what to expect on the average-size
winning trade.
Average losing trade This shows what the average-size loss is.
Return percent This is the percent of profit on the initial size starting
account.
c11.qxd 9/25/06 8:43 AM Page 291
fairly reliable and robust system with a 63.6 percent overall win ratio in
the e-mini–S&P 500 futures. The sample testing period was conducted
during open outcry session only, from 9:30
A
.
M
. (ET) until 4:15
P
.
M
. (ET).
There were no stops or loss parameters; this was simply a reversal system,
which means we were always in the market and out on the close of busi-
ness. The trades were all done on just one single contract; so we did not
have a money management position scale-up program designed, which
means we did not increase lot size as profits accrued. This system is based
on pivot point analysis and the principles outlined in this book; the trading
signals were based on a 15-minute time period, and the testing period was
three years.
All trade signals were taken from 01/08/2003 to 01/10/2006. This time
period was one of the most active trading times in recent decates, so I feel
this was a good sample period to back-test. A starting account was set up
with $10,000, taking one contract per signal. A $50 commission and slippage
were assigned per trade. Generally, the electronic commission rates are as
low as 3.50 and as high as 25, depending on which brokerage firm was used;
so again this was an adequate figure to use. With those variables, the system
generated close to a 500 percent return. As we examine the system closer,
we see it generated 258 trades, of which only 164 were winners. That means
we must have bigger winners than losers, and we do. The average win is
$469, compared to $398 per loss on average. The neat feature in this system
292
CANDLESTICK AND PIVOT POINT TRADING TRIGGERS
TABLE 11.2 E-mini–S&P All Trades, from 01/08/2003 to 01/10/2006
Total net profit: $39,538 Profit factor ($wins/$losses): 2.06
Total trades: 258 Winning percentage: 63.6%
Average trade: $153 Payout ratio (average win/loss): 1.18
Average # of bars in trade: 78.89 Z–score (W/L predictability): 0.8
Average # of trades per year: 85.7 Percent in the market: 74.4%
Max closed-out drawdown: –$4,063 Maximum intraday drawdown: –$4,350
Account size required: $7,913 Return percent: 499.7%
Open equity: $100 Kelly ratio: 0.3266
Total winners: 164 Total losers: 94
Gross profit: $76,963 Gross loss: –$37,425
Average win: $469 Average loss: –$398
Largest win: $2,100 Largest loss: –$1,825
Largest drawdown in win: –$1,663 Largest peak in loss: $1,938
Average drawdown in win: –$271 Average peak in loss: $276
Average run-up in win: $708 Average run-up in loss: $276
Average run-down in win: –$271 Average run-down in loss: –$716
Most consecutive wins: 9 Most consecutive losses: 7
Average number of Average number of
consecutive wins: 2.60 consecutive losses: 1.49
Average number of bars in wins: 76.68 Average number of bars in losses: 82.73
c11.qxd 9/25/06 8:43 AM Page 292
or with this sample back-test model is that the largest drawdown in wins is
1,663. This is the kind of information that will give you a statistical edge in
trading. You now know that you have a system that generates buy and sell
signals with a 64 percent win ratio. This information should help you stay
emotionally grounded by achieving two things: (1) not getting too upset
when losses occur; (2) not overpositioning yourself in trades if and when
you have a win streak with more than eight or nine consecutive trades.
Most people lose big as they see their systems or methods generate huge
profits many times in a row. They get this feeling that their trading is invin-
cible or impervious to losers. And then, wham, that’s when a drawdown pe-
riod occurs! Generally, it is at this point that a trader goes from trading 10
contracts to 50 contracts. All it takes is one bad trade, and you have wiped
away your trading profits or, worse, your entire trading account.
MONEY MANAGEMENT IS THE KEY TO SUCCESS
Using the Defcon trading system, we started with a trading account balance
of $10,000. The overnight initial speculative margin for the CME’s e-
mini–S&P, as of 2/15/2006 was $3,938 per contract. Therefore, with trading
just one contract, we had committed 39 percent of our trading capital at any
one time. Since our account starts with $10,000 and the system only gener-
ates less than two trades per week, we need to define when it is apropriate
to increase our lot sizes. Aha! This is a novel idea and is what truly helps
traders get wealthy—knowing when to fold, hold, or add on.
If you look at Figure 11.5, you see a chart with an equity curve showing
some pretty good gains with an occasional bump in the road. Recoverable
as it is, a drawdown in profits occurs. Using system analysis can help you
determine most consecutive wins and losses and what the largest loss is.
Armed with that information, you can now go on to trading like a true
megastar professional fund manager—or simply a downright happy
camper. Why? Because that information will help you determine the next
level of profits you have to build in order to increase your lot size. If you do
not manage your money properly and double or quadruple your position
size before doubling your account size, you could be in for a rude awaken-
ing. As you can see, the maximum drawdown experienced is –4,062.50 on
11/10/2004. If that was the day you decided to mistakenly increase your lot
size, it may have potentially wiped your account out.
In Table 11.2, observe that the largest loss is $1,825. By increasing your
lot size prematurely or or by having an imbalance to largest loss in rela-
tionship to account balance, such as having four or more contracts on at
any one time, you could wipe out not only your gains but also the majority
of your account. Using statistics and mathematical formulas is what will
The Sample Analysis 293
c11.qxd 9/25/06 8:43 AM Page 293
give you an edge in the markets, from both a business stance and an emo-
tional stance. You will be better prepared, and that should help make you a
better trader.
In conclusion, one of the greatest values of data derived from back-test-
ing a system is that it will reveal hidden intricacies about the system. Sim-
ply having a rudimentary knowledge of placing stop-loss orders is not the
definition of knowing sound money management techniques. You must ex-
pand your knowledge in managing your money properly by either under- or
overleveraging your trading capital. We went over a seasonal trading strat-
egy that Stock Trader’s Almanac uses in the equity markets using the
MACD indicator. I showed you how you can optimize that method by in-
troducing the use of pivot point analysis. With the ability of back-testing a
strategy, we can back-test this theory on our own; and more important, we
can learn if our system or trading method has a seasonal factor that per-
forms best or worst at certain times of the year. Then, you can also deter-
mine, based on your equity size, the number of positions you should have
on while maintaining a proper risk/reward ratio.
294
CANDLESTICK AND PIVOT POINT TRADING TRIGGERS
FIGURE 11.5
Used with permission of www.GenesisFT.com.
c11.qxd 9/25/06 8:43 AM Page 294
WHEN IS THE BEST TIME TO TRADE?
Remember I stated in Chapter 1 that traders need to ask more questions?
Well, the more you learn, the more you know what to ask. As a systems
trader, asking how a system performs during different times of the year is
a novel idea, especially as seasonal forces can impact a market. Ask ques-
tions such as, “When is the best or the worst time to trade?” From a simple
yet elegant standpoint, the answer for day traders in equities is lunchtime.
This is substantiated by volume levels generally declining during that time
frame. Forex traders note that trading activity is light from 10
P
.
M
. (ET)
until 1:30
A
.
M
. (ET), as we discussed in Chapter 1. What about on a weekly
or monthly basis? When does our system perform best?
By tracking trading performance, as shown in Table 11.3, from a his-
torical perspective, we can form an opinion of when the system is at peak
performance or when the market we are trading is in sync with seasonal
factors. There is never a guarantee that past performance is indicative of fu-
ture results, but we can and do benefit from studying history. Without a
doubt, I do not want to go on a major tangent here; but we are trading in a
new frontier environment. The new age of technology has more people
trading online, and more people are more computer savvy. We have an in-
tricate globalization of our economy. Trading partners with China and even
India is not like what we had just five years ago. So with that perspective,
my opinion is that looking at seasonal tendencies of a market starting from
2000 up through 2005 would not be a huge statistical event, but it would be
more relevant than a testing period in 1990 through 1995. With that in mind,
we ran a test, as the results show in Figure 11.6, to see which months per-
form best with the “Defcon III model.”
Using the Genesis Software product and asking the right questions
(e.g., When is the best time to trade?), I can get a reasonable answer. In fact,
I wanted to know which months are the best and which months are the
worst in which to trade. Using the Genesis Software, I can run back tests to
see what the performance from a seasonal perspective with the Defcon
system looks like on a monthly performance basis. Using a test period over
the past three years, I am able to conclude that April is a month to avoid
trading! Based on a three-year average, this is the month that consistently
delivers drawdowns. With that statistical information, I have a slight edge
in the market, as it relates with my system. I can make a decision either to
lower my contract sizes or to avoid trading entirely. Figure 11.7 shows the
yearly breakdown of the compiled results.
The more statistics I have, the better prepared I am; and with that
knowledge, I have stacked the odds in my favor. This is the ultimate in trad-
ing tools and system designs: being able to identify opportunity and dis-
cover the weakest link in my chain of trading system. Table 11.4 dissects
The Sample Analysis 295
c11.qxd 9/25/06 8:43 AM Page 295
296
TABLE 11.3 By Month Report
Jan 28, 2006 21:25:39
Name: John Person Defcon III
Symbol: ES1-067
Statistic to chart Profit, Position selection, All trades, From date 01/08/2003, To date 01/10/2006.
Win Win Loss Run Run Average Max Average
Month Trades Pct Avg Avg Up Down P/L P/F Trade C/L Loss Profit Bars
January 27 66.67% $488 –$369 $734 –$635 1.32 2.64 $202 1 –$1,175 $5,450 65.70
February 22 68.18% $408 –$273 $597 –$754 1.49 3.20 $191 2 –$650 $4,213 68.00
March 21 66.67% $690 –$732 $1,075 –$1,113 0.94 1.89 $216 2 –$1,475 $4,538 87.95
April 19 57.89% $414 –$609 $656 –$922 0.68 0.93 –$17 2 –$1,825 –$325 91.37
May 19 78.95% $418 –$256 $649 –$619 1.63 6.11 $276 1 –$500 $5,238 87.79
June 21 66.67% $371 –$393 $575 –$946 0.95 1.89 $117 4 –$1,413 $2,450 86.38
July 23 65.22% $453 –$117 $697 –$309 3.86 7.24 $254 2 –$338 $5,850 70.22
August 19 63.16% $502 –$516 $720 –$782 0.97 1.67 $127 2 –$1,325 $2,413 100.21
September 21 47.62% $376 –$267 $630 –$545 1.41 1.28 $39 6 –$1,375 $825 90.29
October 20 65.00% $476 –$554 $669 –$946 0.86 1.60 $116 3 –$1,750 $2,313 62.45
November 23 47.83% $508 –$413 $733 –$647 1.23 1.13 $28 3 –$1,313 $638 75.39
December 23 69.57% $502 –$300 $736 –$536 1.67 3.83 $258 2 –$650 $5,938 70.43
c11.qxd 9/25/06 8:43 AM Page 296
FIGURE 11.6
Used with permission of www.GenesisFT.com.
The Sample Analysis 297
FIGURE 11.7
Used with permission of www.GenesisFT.com.
c11.qxd 9/25/06 8:43 AM Page 297
298
TABLE 11.4 Monthly History Report
Used with permission of www.GenesisFT.com.
c11.qxd 9/25/06 8:43 AM Page 298
The Sample Analysis 299
each month’s performance from the three-year test period that really shows
the poor seasonal performance made in the month of April for those years
back-tested.
DOES THIS WORK FOR FOREX?
Since currency trading is a large component of my trading, I wanted to op-
timize a system for forex. The Defcon model was tested to stand up against
a noncorrelated investment vehicle to the equity markets. I chose the euro
currency market to run a performance test. As we discussed in Chapter 7,
due to the computers’ inability to test the forex markets’ data because there
is no centralized market and prices are quoted in bid/ask form, we ran the
test using the euro currency futures, which trades parallel to forex markets.
The test period was conducted using 15-minute intervals during the U.S.
open outcry trading session from 8:20
A
.
M
. (ET) until 3
P
.
M
. (ET).
The winning percentages were not as great as in the S&P; but, boy, the
bottom-line results showed a healthier profit! Table 11.5 shows the rate of
return with 365 percent, but it was based off a recommended starting bal-
ance of $16,770. The overall gross profit was $61,275, based on a test period
that went back three years. We had 310 trades—the system generated
slightly more trades here than in the S&P. This may indicate that the mar-
TABLE 11.5 Euro Currency—All Trades from 01/03/2003 to 01/09/2006
Total net profit: $61,2758 Profit factor ($wins/$losses): 1.49
Total trades: 310 Winning percentage: 60.3%
Average trade: $198 Payout ratio (average win/loss): 0.98
Average # of bars in trade: 64.24 Z–score (W/L predictability): –0.9
Average # of trades per year: 102.7 Percent in the market: 74.0%
Max closed-out drawdown: –$13,163 Maximum intraday drawdown: –$14,475
Account size required: $16,770 Return percent: 365.4%
Open equity: $825 Kelly ratio: 0.1981
Total winners: 187 Total losers: 123
Gross profit: $186,625 Gross loss: –$125,350
Average win: $998 Average loss: –$1,019
Largest win: $6,038 Largest loss: –$4,313
Largest drawdown in win: –$2,713 Largest peak in loss: $2,113
Average drawdown in win: –$405 Average peak in loss: $397
Average run-up in win: $1,450 Average run-up in loss: $397
Average run-down in win: –$405 Average run-down in loss: –$1,630
Most consecutive wins: 10 Most consecutive losses: 7
Average number of Average number of
consecutive wins: 2.63 consecutive losses: 1.76
Average number of bars in wins: 59.78 Average number of bars in losses: 71.03
c11.qxd 9/25/06 8:43 AM Page 299
ket is more volatile, not less, as some people believe. As for the test period,
I believe this was a good time frame because it represents a great sampling
of various market conditions, considering that we had several market con-
ditions exist: bull trend, to a consolidation phase, and then a trend reversal
or downtrend.
In January 2003, the euro was valued at 1.0500 to the U.S. dollar. It
went as high as 1.3660 in December 2004; and as of February 2006, the euro
was back at 119.00. During that time, the market conditions changed from
bullish to bearish and went into a consolidation phase as well. We want to
see how a trading system performs in various market conditions. Notice the
three market conditions as indicated by the trend lines drawn in the weekly
euro currency chart in Figure 11.8. According to the test results, the system
fared pretty well.
Let’s examine both the volatility and the margin requirements. As of
February 15, 2006, the daily initial margin requirement to trade one euro
currency with a 125,000 contract value (margin requirements are set by the
exchanges and are subject to change without notice) was $2,835.00. As you
can see, we are trading a highly leveraged market that has an average daily
300
CANDLESTICK AND PIVOT POINT TRADING TRIGGERS
FIGURE 11.8
Used with permission of esignal.com.
c11.qxd 9/25/06 8:43 AM Page 300
The Sample Analysis 301
range of approximately 86 PIPs (percentage in points) per day. In the fu-
tures, each PIP is $12.50. That computes to a daily trading range of $1,075
per day. In using strict money management guidelines, we are using only 28
percent of our investment capital. So in the spirit of being a great trader, I
want to ask why I would trade only one contract with a starting account of
$10,000. The answer is clear, and another great example of why it is impor-
tant to know what you are doing before you do it. By back-testing a system,
I can determine what the worst to expect is. Granted, we did not implement
any means for risk management. The Defcon system solely generates a
trade triggered by the pivot point moving average approach. You will see
that by going back and validating the methodology, we had a single loss in
the amount of $4,313. That is the bad news; and more than likely, as with
any severe and sudden market loss, it was generated by a shocking news
event. The monthly unemployment report on August 6, 2004, was one such
event where the euro currency moved almost 260 points in a single day.
This was a good definition of a news-driven price shock. As the data in
Table 11.3 shows, the profits were bigger in the euro than they were in the
e-mini–S&P; but so were the risks. So we have a bigger profit; but along
with that greater profit came greater risks. How many times have you heard
that before? The bigger the risk, the bigger the rewards. I have heard that a
bunch of times, but it is great to see it put in front of me based on a defined
set of rules. So if I get the feeling one day to go “all in” like a poker player
and use 100 percent of my margin, in the euro currency I could easily do
three contracts. In one bad day, not only would I wipe my account, but I
could be deficit, meaning I could actually lose every penny in my account
and owe money.
Using the back-tested results of a system allows me to see my pro-
gram’s strengths and weaknesses. That is the edge I have against the mar-
ket—knowing when to raise my positions and when not to. Besides
learning that my system can make money, I also found out that I need to
double my account if I want to double my positions. Using a computer
product like Genesis allows me to identify and validate the methods em-
ployed. As we look at the equity curve in Figure 11.9, we can see a solid per-
formance; and that should help maintain your confidence to stick with
trades generated by the signals. Figure 11.9 also highlights a negative
$13,162.50 maximum drawdown from peak profits. Imagine increasting
your lot or contract size prematurely during that negative phase. It would
certainly ruin your trading day, year, or even career!
In the stacked bar graph in Figure 11.10, we see the results of peak per-
formance; and more important, we see the kink in our armor, the weakest
point in our system from a seasonal perspective. By back-testing the sys-
tem, our diagnosis shows a seasonal weakness in the markets that occurs
in January and February and continues into March. We know from the table
c11.qxd 9/25/06 8:43 AM Page 301
302 CANDLESTICK AND PIVOT POINT TRADING TRIGGERS
FIGURE 11.9
Used with permission of www.GenesisFT.com.
FIGURE 11.10
Used with permission of www.GenesisFT.com.
Profit
By Month
by Profit
c11.qxd 9/25/06 8:43 AM Page 302
The Sample Analysis 303
in Figure 11.1 that we have a string of winners that last on average 10 in a
row. Therefore, if at the end of October I have 10 winners in a row, I think
I will be more selective in my trade signals in November! As you can see,
the statistics show small drawdowns in November. According to the three-
year test period, April through August is the most profitable trading time
period (Table 11.6). We can enhance our performance by not trading in
April, though, as that was one of the worst-performing months as indicated
in Figure 11.6 on page 297.
As you break down the numbers by the statistical results, it is by that
data that you can determine the validity of your methods (Figures 11.11 and
Table 11.7). When we look at a month-to-month breakdown of the euro
currency, we see January 2004 was a whale of a disaster, as shown in Fig-
ure 11.11! With this information, we can determine if the cause of the dis-
aster was the system, the methods, or one heck of a wild trading period.
The answer should not surprise you: It was the last. There were only two
days that had daily trading ranges over 250 points. On January 16, 2004, the
market dropped like a hot sack of potatoes, with a high of 1.2610 and a low
of 1.2351, for a range of 259 points. Then two days later, it reversed higher,
with a low of 1.2345 and a high of 1.2599, for a 254-point range. The market
gained back what it lost; but overall, it was simply a very violent trading pe-
riod, as Figure 11.12 shows. Without some type of intraday risk manage-
ment method, such as a trailing stop, all traders at some point will be
FIGURE 11.11
Used with permission of www.GenesisFT.com.
c11.qxd 9/25/06 8:43 AM Page 303
304
TABLE 11.6 By Month Report
Jan 28, 2006 21:34:14
Name: John Person Defcon III euro
Symbol: EU-067
Statistic to chart Profit, Position selection All trades, From date 01/03/2003, To date 01/09/2006.
Win Win Loss Run- Run- Average Max Average
Month Trades Pct Avg Avg Up Down P/L P/F Trade C/L Loss Profit Bars
January 22 59.09 % $601 –$1,481 $1,054 –$2,383 0.41 0.59 –$251 4 –$3,350 –$5,513 71.45
February 19 57.89 % $1,048 –$1,791 $1,547 –$2,486 0.59 0.80 –$147 3 –$3,800 –$2,800 81.37
March 28 42.86 % $1,033 –$1,245 $1,460 –$1,899 0.83 0.62 –$269 4 –$3,375 –$7,525 65.36
April 24 66.67 % $1,053 –$858 $1,502 –$1,597 1.23 2.46 $416 2 –$1,975 $9,988 63.25
May 26 53.85 % $1,702 –$798 $2,339 –$1,451 2.13 2.49 $548 5 –$3,288 $14,250 66.62
June 31 64.52 % $747 –$520 $1,240 –$883 1.44 2.61 $297 7 –$2,550 $9,213 52.06
July 29 72.41 % $698 –$1,030 $1,007 –$1,795 0.68 1.78 $221 2 –$2,838 $6,413 58.07
August 34 73.53 % $977 –$958 $1,294 –$1,347 1.02 2.83 $464 4 –$3,138 $15,788 50.35
September 30 56.67 % $1,038 –$809 $1,557 –$1,297 1.28 1.68 $238 4 –$4,313 $7,138 57.10
October 19 57.89 % $808 –$941 $1,478 –$1,584 0.86 1.18 $72 3 –$1,838 $1,363 83.95
November 18 50.00 % $1,082 –$1,242 $1,790 –$1,931 0.87 0.87 –$80 2 –$3,763 –$1,438 84.00
December 30 60.00 % $1,330 –$795 $1,617 –$1,294 1.67 2.51 $480 3 –$2,738 $14,400 62.90
c11.qxd 9/25/06 8:43 AM Page 304
305
TABLE 11.7 Monthly History Report
Used with permission of www.GenesisFT.com.
c11.qxd 9/25/06 8:43 AM Page 305
subjected to news-driven price-shock market environments. No one is im-
mune to them. The good news is that they do not occur frequently, as this
data shows.
To summarize, the essence of back-testing is validating your methods
and showing the strengths and the weaknesses of your system. Moreover,
it will help you define your goals and expectations for performance. There-
fore, it can help you achieve the highest trading profits with the lowest
risks in most trading market conditions. I want to elaborate that by study-
ing a system, in all market conditions, you at least will be better prepared
and less shocked when an eventual negative situation develops in your
trading career. The main goal in trading is consistency and staying in the
game. Statistics show this!
306
CANDLESTICK AND PIVOT POINT TRADING TRIGGERS
FIGURE 11.12
Used with permission of esignal.com.
c11.qxd 9/25/06 8:43 AM Page 306