Effective Project Management Traditional, Adaptive, Extreme phần 9 pdf
Bạn đang xem bản rút gọn của tài liệu. Xem và tải ngay bản đầy đủ của tài liệu tại đây (556.39 KB, 51 trang )
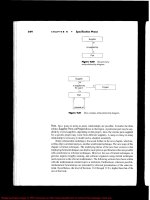
Figure 20.6 Criteria weighting.
Figure 20.6 shows a sample calculation for one of the proposed projects for the
portfolio. The first column lists the criteria against which all proposed projects
for this portfolio will be evaluated. The second column lists the weight of
that criterion (higher weight indicates more importance to the scoring algo-
rithm). The third through the seventh columns list the evaluation of the project
against the given criteria. Note that the evaluation can be given to more than
one level. The only restriction is that the evaluation must be totally spread
across the levels. Note that each criteria level adds to one. The eighth column is
the sum of the levels multiplied by the score for that level. This process is totally
adaptable to the nature of the portfolio. The criteria and criteria weight
columns can be defined to address the needs of the portfolio. All other columns
are fixed. The last two columns are calculated based on the values in columns
2 through 7.
Paired Comparisons Model
The next scoring model is called the Paired Comparisons Model. In this model,
every pair of projects is compared. The evaluator chooses which project in the
pair is the higher priority. The matrix in Figure 20.7 is the commonly used
method for conducting and recording the results of a paired comparisons
exercise.
10
10
10
8 1.0
0.6 0.4
6
4
10
10
8.0
6.0
4.0
2.0
6.4
5.0
1.2
7.4
80.0
60.0
40.0
16.0
38.4
20.0
12.0
74.0
340.4
1.0
0.2
0.2
0.7
0.6 0.2
1.0
0.8
0.5 0.5
0.3
Criteria
Fit to Mission
Criteria
Weight
Fit to Objectives
Fit to Strategy
Contribute to Goal A
Contribute to Goal B
Contribute to Goal C
Uses Strengths
Uses Weaknesses
Expected
Level Weight
Expected
Weighted Score
Very Good (8)
Good (6)
Fair (4)
Poor (2)
Very Poor (0)
Project Portfolio Management
369
24 432210 Ch20.qxd 7/2/03 9:34 AM Page 369
Figure 20.7 An example of a paired comparisons.
First note that all 10 projects are defined across the 10 columns and down the
10 rows. For 10 projects, there are 45 comparisons that you have to make. The
45 cells above the diagonal contain the comparisons you make. First, Project 1
is compared to Project 2. If Project 1 is given a higher priority than Project 2, a
“1” is placed in cell (1, 2) and a “0” is placed in cell (2, 1). If Project 2 had been
given a higher priority than Project 1, you would place a “0” in cell (1, 2) and a
“1” in cell (2, 1). Next, Project 1 is compared to Project 3, and so on, until Proj-
ect 1 has been compared to all other nine projects. Then Project 2 is compared
to Project 3, and so on. Continuing in this fashion, the remaining cells are com-
pleted. The final step is to add all the entries in each of the 10 rows, producing
the rank for each project. The higher the score, the higher the rank. The right-
most column reflects the results of those calculations. Note that Project 7 had
the highest overall priority.
NOTE
This Paired Comparisons Model is a quick and simple method; unfortunately, it
doesn’t scale very well. For example, 100 projects would require 4950 comparisons.
1111011011
10987654321
2110011000
3110010010
4110011111
5010010100
6110000000
7111111111
8110111110
9000000000
10 100010000
RANK
27X
SUM
64X
4X
7X
3X
2X
9X
7X
0X
2X
5
2
7
8
1
2
10
9
Chapter 20
370
24 432210 Ch20.qxd 7/2/03 9:34 AM Page 370
Figure 20.8 Risk/Benefit Matrix.
Risk/Benefit
The final scoring model is the Risk/Benefit Matrix. There are many ways to do
risk analysis, from subjective to very sophisticated mathematical models. The
one we are introducing is a very simple quasi-mathematical model. Risk is
divided into five levels (1, 2, 5). Level 1 is a very low risk (or high probability
of success), and level 5 is a very high risk (or very low probability of success).
Actually, any number of levels will do the job. Defining three levels is also quite
common. In this model we are going to assess two risks: the risk of technical
success and the risk of business success. These are arranged in Figure 20.8.
Each project is assessed in terms of the probability of technical success and
the probability of business success. The probability of project success is estimated
as the product of the two separate probabilities. To simplify the calculation, the
graph shows the results of the computation by placing the project in one of
three areas:
1
1
3
Probability of Business Success
Probability of Technical Success
2
3
4
5
25
1 = high, 5 = low
4
Project Portfolio Management
371
24 432210 Ch20.qxd 7/2/03 9:34 AM Page 371
■■ Fund projects that fall in the lightly shaded cells.
■■ Consider projects that fall in the cells with no shading.
■■ Refer projects in the darkly shaded cells back to the proposing agency
unless there is some compelling reason to fund them.
If there are a large number of projects, you will need to prioritize those that fall
in the lightly shaded cells. A good start on that would be to prioritize the cells
starting in the upper left corner and working toward the center of the matrix.
Selecting a Balanced Portfolio Using the
Prioritized Projects
You might think that because you have a prioritized list in each funding cate-
gory and you know the resources available for those projects, the selection
process would be simple and straightforward, but it isn’t. Selection is a very
challenging task for any portfolio management team. The problem stems from
the apparent conflict between the results of evaluation, the ranking of projects
from most valuable to least valuable, and the need to balance the portfolio
with respect to one or more variables. These two notions are often in conflict.
As a further complication, should partial funding of projects be allowed? You
will see that conflict more clearly later in the section “Balancing the Portfolio.”
There are several approaches to picking the project portfolio. As you have
already seen, in this chapter we chose to deal with five portfolio strategies and
six prioritization approaches. Those gave us 30 possible combinations for
selection approaches, and there are many more that we could have discussed.
From among the 30 that we could examine, we have picked three to focus on:
■■ Strategic Alignment Model and Weighted Criteria
■■ Project Distribution Matrix and Forced Ranking
■■ Graham-Englund Selection Model with the Project Investment Categories
and the Risk/Benefit Matrix
This section shows the results of combining the previous sections into an
approach for selecting projects for the portfolio. By choosing the BCG Prod-
ucts/Services Matrix, Strategic Alignment Model, Project Distribution Matrix,
Growth versus Survival Model, or the Project Investment Category Model,
you make a statement about how your resources will be allocated. Each one of
these models generates some number of “buckets” into which resources are
distributed. Those buckets with more resources are valued more than those
with fewer resources. These buckets represent the supply of resources avail-
able to the projects that are demanding those resources. It would be foolish to
Chapter 20
372
24 432210 Ch20.qxd 7/2/03 9:34 AM Page 372
expect there to be a balance between the supply of resources and the demand
for them. Some buckets will have more resources than have been requested,
while others will not have enough resources to meet demand. This section
explains how to resolve those differences to build a balanced portfolio.
Balancing the Portfolio
Unfortunately, there isn’t a perfect or best way to build a balanced portfolio.
There are basically two approaches and neither one ensures an optimal solution:
■■ The first approach is to make one master list of prioritized projects. How-
ever, if you simply use that prioritized list of projects using any of the
models presented so far, you may end up with less than satisfactory
results. For example, you could end up funding a number of short-term,
low-risk projects with low organizational value. Alternatively, you could
end up funding all long-term, high-risk projects with high organizational
value. In either case the resulting portfolio would not be representative
of the organization’s strategy. In other words, you could end up with a
portfolio that was not at all in line with the corporate strategy.
■■ The second approach, and the one that we have taken here, is to separate
projects into buckets and prioritize the projects that have been placed in
each bucket and do this for every bucket. While this certainly gives us a
balanced portfolio, it may not give us the best portfolio. Why is that?
Some buckets may have been very popular choices for proposed projects,
and a very good project may not have reached high enough on the prior-
ity list to be funded. Yet that project may be a much better alternative than
some project in another bucket that did receive funding. It’s basically the
luck of the draw.
So which approach should you take? We recommend the second, and there are
two reasons for our recommendation:
■■ Prioritizing a single list, which may be long, is far more difficult than work-
ing with several shorter lists. The work can be divided among several per-
sons or groups in the second case, but not in the first case. Furthermore,
when you first align projects with funding categories and then prioritize
within funding categories, you are not only working with a smaller number
of projects but with a group of projects that are more homogeneous.
■■ Once the projects have been aligned within funding categories, the portfo-
lio manager may then allocate the resources across the funding categories.
That avoids the situation where there could otherwise be a wide variance
between the resources that are being requested and those that are being
Project Portfolio Management
373
24 432210 Ch20.qxd 7/2/03 9:34 AM Page 373
offered in each category. The caution here is that the portfolio manager
may try to honor the requests and abandon any portfolio strategy. You
can’t have it both ways.
The examples given in the sections that follow illustrate some of these ideas.
These are but a few of the many examples we could give, but they are suffi-
cient to illustrate some of the ways to mitigate against such outcomes and
ensure a balanced portfolio that reflects the organization’s investment strategy.
Strategic Alignment Model and Weighted Criteria
In this section we use the Strategic Alignment Model to select projects for the
portfolio. Figure 20.9 shows one variation that we might use.
Figure 20.9 Achieving balance with the Strategic Alignment Model.
P#1 $2M 0.6
$1.2M
0.8
$0.3M
0.3
$0.6M
0.4
$1.6M
0.3
$0.3M
P#2 $2M
P#3 $4M
P#4 $1M
P#5 $3M
P#6 $4M
P#7 $3M
P#8 $3M
P#9 $1M
P#10 $2M
AwardScore
0.2
$0.4M
0.2
0.6
$2.4M
0.2
$0.2M
0.2
0.7
0.8
$2.4M
Budget
Proposed
0.5
$0.5M
0.8
$2.4M
0.3
$0.3M
0.
$0.6M
0.2
$0.2M
0.4
$0.8M
0.1
$0.2M
0.3
$0.9M
0.2
$0.2M
0.140
0.150
0.220
0.240
0.260
0.160
0.300
0.130
0.200
0.120
0.7
$2.1M
0.4
$0.4M
0.4
$0.8M
0.2
$0.6M
$2.0M
$1.6M
$4.0M
$1.0M
$3.0M
$0.3M
$3.0M
$3.0M
$0.8M
$0.7M
Value/Mission
Goal BGoal A
Objective 1
0.1
Objective 2
0.3
Objective 3
0.2
Objective 4
0.3
Objective 5
0.1
$4M $5M $3M $4M $4M
Goal C
Chapter 20
374
24 432210 Ch20.qxd 7/2/03 9:34 AM Page 374
Each objective is weighted with a number between 0 and 1. Note that the sum of
the weights is 1. These weights show the relative importance of each objective
compared against the others. Below each objective is the budget allocated to that
objective. The total budget is $20M. Ten projects are being considered for this
portfolio. The proposed budget for each is shown with the project number. The
total request is for $25M. In this example, a project may be associated with more
than one objective. We can do that by assigning to each project objective pair a
weight that measures that strength of the relationship of that project to that
objective. This weight was the result of evaluating the alignment of the projects
to the objectives. The sum of the weights for any project is 1.0. To establish the
priority order of the 10 projects, multiply the objective weight by the project
weight and add the numbers. The result of that calculation is shown in the Score
column for all 10 projects in the example we are using. The higher the project’s
score, the higher the project should be on your list of projects to fund. So Project
7 is the top-priority project with a score of .300. Project 10 is the tenth priority
with a score of .120.
The awards to the projects are made by starting with the highest-priority proj-
ect, which in the example is Project 7. The request is for $3M. Of that amount,
80 percent will come from the budget for Strategy 2 and 20 percent will come
from Strategy 4. That reduces the budget for Strategy 2 from $5M to $2.6M and
for Strategy 4 from $4M to $3.4M. The process continues with the next-highest-
priority project and continues until the budget for each strategy is allocated or
there are no more requests for resources. There may be cases where a project
receives only partial funding from a funding category. For example, Project 10
should have received $1.6M from Strategy 1 but when it came up for funding,
there was only $0.3M left in that budget. Following the example to completion
results in the allocations shown in Figure 20.9. The requests totaled $25M, the
budget totaled $20M, and the allocations totaled $19.4M. The remaining $0.6M
should not be redistributed to those projects that did not receive their
requested support. These resources are held pending performance of the port-
folio and the possible need to reallocate resources at some later date.
This section gives you but one example of applying an adaptation of criteria
weighting to the Strategic Alignment Model to produce a portfolio selection
approach. This model is probably the best of those discussed in this chapter
because it allows the portfolio manager to express the enterprise strategy in a
direct and clear fashion through the weights chosen for each objective. It also
shows how the proposed projects relate to that prioritization through the
weighted scores on each objective. The model provides management with a
tool that can easily adapt to changing priorities and that can be shared with the
organization.
Project Portfolio Management
375
24 432210 Ch20.qxd 7/2/03 9:34 AM Page 375
Project Distribution Matrix and Forced Ranking Model
To further illustrate the process of creating a portfolio selection approach, next
we combine the Project Distribution Matrix and the Forced Ranking Model.
First, assume that the total dollars available for Major IT Projects is $20M and
that the dollars have been allocated as shown in Figure 20.10. We’ll use the
same 10 projects from the previous section with the same funding requests. The
projects are listed in the order of their ranking within each funding category.
The first thing to note in this example is that the investment decisions do not line
up very well with the funding requests from the 10 projects. There is a total of
$9M in four funding categories with no projects aligned in those categories. Your
priorities as portfolio manager were expressed by your allocation of funds to the
various funding categories. However, the project proposals do not line up with
that strategy. Are you willing to make any budget changes to better accommo-
date the requests? You should, but with the stipulation that you do not compro-
mise your investment strategy. Legitimate changes would be to move resources
to the left but in the same row or up but in the same column. If you agree that
that is acceptable, then you end up with Figure 20.11. $3M was moved from the
Strategic/Maintained category to the Strategic/Enhanced category, and $1M
was moved from the Operational/New category to the Tactical/New category.
Any other movement of monies would compromise the investment strategy.
Figure 20.10 Project Distribution Matrix with budget and funding requests.
Project Focus
Strategic
New Enhancement Maintenance
Budget $3M Budget $3M
P#2
P#10
P#6
$2M
$2M
$4M
P#8 $3M
Budget $3M
Tactical
Operational
P#7
P#5
$3M
$3M
Budget $3M Budget $2M
P#1
P#4
P#9
$2M
$1M
$1M
Budget $1M
Budget $1M Budget $2M Budget $2M
P#3 $4M
Chapter 20
376
24 432210 Ch20.qxd 7/2/03 9:34 AM Page 376
Figure 20.11 Project Distribution Matrix with adjusted budget and funding requests.
After the allocations have been made, you are left with Figure 20.12. The bal-
ances remaining are also shown in Figure 20.12. These monies are to be held
pending changes to project status as project work is undertaken.
Graham-Englund Selection Model and the Risk/Benefit Matrix
So far in the examples the only resource we have been working with is money.
However, one of the most important resources, at least for information technol-
ogy projects, is people. Staff resources are composed of professionals of varying
skills and experiences. As you consider the portfolio of projects, you need to
take into account the ability of the staff to deliver that portfolio. For example, if
the portfolio were largely new or enhanced strategic applications, you would
draw heavily on your most experienced and skilled professionals. What would
you do with those who were lesser skilled or experienced? That is an important
consideration, and the Graham-Englund Selection Model is one model that
approaches project selection with that concern in mind. Basically it will work
from a prioritized list of selected projects and staff them until certain sets of
skilled and/or experienced professionals have been fully allocated. In other
words, people, not money, become the constraint on the project portfolio. Sev-
eral related problems arise as a result. We will briefly discuss some of the issues
and staffing concerns that this approach raises.
Project Focus
Strategic
New Enhancement Maintenance
Budget $3M Budget $6M
P#2
P#10
P#6
$2M
$2M
$4M
P#8 $3M
Tactical
Operational
P#7
P#5
$3M
$3M
Budget $4M Budget $2M
P#1
P#4
P#9
$2M
$1M
$1M
Budget $1M
Budget $2M Budget $2M
P#3 $4M
Project Portfolio Management
377
24 432210 Ch20.qxd 7/2/03 9:34 AM Page 377
Figure 20.12 Project Distribution Matrix with budget balances and funding decisions.
The Graham-Englund Selection Model is a close parallel to those previously
discussed, but it has some interesting differences. We put it in here because of
its simplicity and the fact that it has received some attention in practice. Figure
20.13 is an adaptation of the portfolio project life cycle to the Graham-Englund
Selection Model.
What Should We Do?
The answer to this question is equivalent to establishing the portfolio strategy.
In the case of the Graham-Englund Selection Model, we are referring to the IT
strategy of the organization. The answer can be found in the organization’s
values, mission, and objectives, and it is the general direction in which they
should be headed consistent with who they are and what they want to be. It is
IT’s role to support those goals and values. IT will do that by crafting a portfo-
lio of projects consistent with those goals and values. Think of answering
“What should we do?” as the demand side of the equation. You will use the
project investment categories (infrastructure, maintenance, new products, and
research) to identify the projects you should do. These categories loosely align
with the skill sets of the technical staff and will give you a basis for assigning
resources to projects. In fact, any categorization that allows a mapping of skills
to projects will do the job. We have kept it simple for that sake of the example,
but this approach can get very complex.
Project Focus
Strategic
New Enhancement Maintenance
Budget $3M
P#2
P#10
P#6
$2M
$2M
$2M
P#8 $2M
Tactical
Operational
P#7
P#5
$2M
0
Budget $2M
P#1
P#4
P#9
$2M
$1M
$1M
P#3 $1M
Chapter 20
378
24 432210 Ch20.qxd 7/2/03 9:34 AM Page 378
Figure 20.13 An adaptation of the Graham-Englund Selection Model.
Figure 20.14 Project staffing requirements.
Senior Project
Manager
#
Available
P#1
I
X
2
P#2
I
P#3
M
P#4
M
P#5
M
P#6
N
P#7
N
P#8
N
P#9
R
P#10
R
X
X
Project Manager
Associate Project
Manager
Systems Architect
Database Architect
Senior Programmer
Programmer
Associate
Programmer
Test Technician
3
2
4
4
2
3
2
5
X
X
XXXXX
XXXXX
X
X
X
XXX
XXXX
X
XX
X
XXX
XXXX
XXX
XXX
What should
we do?
What can
we do?
What will
we do?
How will we
do it?
Project Portfolio Management
379
24 432210 Ch20.qxd 7/2/03 9:34 AM Page 379
Figure 20.14 is a list of the 10 projects and the skilled positions needed to staff
them. The second column gives the number of staff in each position that is
available for these 10 projects. Again, we have kept the data simple for the sake
of the example.
What Can We Do?
The answer to this question is found by comparing project requirements with
the organization’s resource capacity. Current commitments come into play
here, as the organization must look at available capacity rather than just total
capacity.
NOTE
Dealing with the issue of what your organization can do raises the important issue
of having a good human resource-staffing model in place, one that considers future
growth of the enterprise, current and projected skills inventories, training programs,
career development programs, recruiting and hiring policies and plans, turnover,
retirements, and so on.
Think of answering “What can we do?” as the supply side of the equation.
Figure 20.14 lists the projects that can be done with the staff resources avail-
able. Under each project number is the type of project (I = infrastructure, M =
maintenance, N = new product, and R = research). However, it does not say
which projects will be done. Not all of them can be done simultaneously with
the available staff resources, so the question as to which ones will be done is a
fair question.
What Will We Do?
The list of projects given in Figure 20.14 is longer than the list of projects you
will do. The creation of the “will-do” list implies that some prioritization has
taken place. Various criteria such as return on investment, break-even analysis,
internal rate of return, and cost/benefit analysis might be done to create this
prioritized list. In this example we will use the list that results from the
Risk/Benefit Matrix, as shown in Figure 20.15.
The priority ordering of the projects based on the probabilities of success is
P#1, P#4, P#5, P#2, P#7, P#3, P#6, P#8, P#9, and P#10. If you staff the projects in
that order, you will be able to staff Projects 1, 4, 5, 2, and 7. At that point you
will have assigned all resources except one senior project manager. Projects 3,
6, and 8 did fall in the acceptable risk categories, but there are no resources left
to staff them.
Chapter 20
380
24 432210 Ch20.qxd 7/2/03 9:34 AM Page 380
Figure 20.15 Projects prioritized using the Risk/Benefit Matrix.
However, the example is oversimplified. You have assumed that a person is
staffed 100 percent to the project. That is unlikely. In reality, a scarce resource
would be scheduled to work on projects concurrently so as to allow more
projects to be active. In reality, you would sequence the projects rather than
start them all at the same time. Projects have differing durations, and this
difference frees up resources to be reassigned. In any case, the example has
shown you how the process works.
How Will We Do It?
Answering this question is roughly equivalent to the selection phase in the
portfolio project life cycle. In the case of resource management, “How will we
do it?” is just a big staffing and scheduling problem. By scheduling scarce
resources across the prioritized list, you are placing more projects on active
status; that is, they will be placed in the portfolio. Detailed project plans are
put in place, and the scheduling of scarce resources across the projects is coor-
dinated. Performance against those plans is carefully monitored because the
resource schedule has created a dependency between the projects. The critical
1
1
3
Probability of Business Success
Probability of Technical Success
2
3
4
5
25
1 = high, 5 = low
4
P#4
P#5
P#2
P#7
P#6 P#9
P#1
P#3 P#8 P#10
Project Portfolio Management
381
24 432210 Ch20.qxd 7/2/03 9:34 AM Page 381
chain approach to project management offers considerable detail on schedul-
ing scarce resources across multiple projects. The interested reader should
referred back to Chapter 12 of this book, where we discuss critical chain
project management in more detail, as well as the book Critical Chain Project
Management by Lawrence Leach.
Balancing Using Partial Funding or Staffing of Projects
Earlier in the chapter we asked the question about whether partial funding
would be allowed. The tentative answer to the question of partial funding or
partial staffing is yes, because it yields a couple of key benefits. The most obvi-
ous benefits are that it puts more projects into active status and gives us a
chance to better control the risk in the portfolio. If one of those partially funded
projects doesn’t meet muster, it can be postponed or cancelled and the remain-
ing resources reallocated to other partially funded projects that are meeting
muster. There is one major drawback that the portfolio manager must contend
with: The delivery date of the partially funded projects will be extended into
the next budget cycle. That may mean a delay in getting products or services
into the market and hence delay the revenue stream. That has obvious busi-
ness implications that must be taken into account.
Managing the Active Projects
In this last phase, you continuously compare the performance of the projects in
the portfolio against your plan. Projects can be in one of three statuses: On Plan,
Off Plan, or In Trouble. You will see how that status is determined and what
action can be taken as a result. Here, the challenge is to find performance mea-
sures that can be applied equitably across all the projects. Two come to mind:
■■ Cost schedule control
■■ Milestone trend charts
The detailed discussion of these is given later in this section.
To bring closure to the final phase, projects can be postponed, cancelled, or,
believe it or not, completed, and you will see exactly how these endings affect
the portfolio going forward.
So, the project is underway. Regardless of the effort that was expended to put
a very precise and complete plan in place, something will happen to thwart
those efforts. In the 35 years that we have been managing projects, not a single
project went according to plan. That wasn’t due to any shortcomings on our
Chapter 20
382
24 432210 Ch20.qxd 7/2/03 9:34 AM Page 382
part. It is simply a fact of life that things will happen that could never have
been foreseen, and the project will be impacted. Corrective actions will have to
be taken. In this module you will see two reporting tools that allow an apples-
to-apples comparison of the status of projects in the portfolio. The first tool is
applied at the portfolio management level, while the second tool is applied at
the project level.
Project Status
As mentioned, there are three categories for the status of active projects: On
Plan, Off Plan, or In Trouble. The next sections take a look at each of these
states and how that status might be determined.
On Plan
Even the best of plans will not result in a project that stays exactly on schedule.
A certain amount of variance from the plan is expected and is not indicative of
a project in jeopardy. The threshold between On Plan and Off Plan is a subjec-
tive call. We offer some guidelines for this variance later in the chapter, in the
section titled SPI and CPI Trend Charts.
Off Plan
Once a project crosses that threshold value, it moves from On Plan to Off Plan.
For a project to be Off Plan is not unexpected. But what is expected is to get
back On Plan. If the project manager cannot show the corrective action that
will be taken to get the project back On Plan and when that event is likely to
occur, there is a problem and the project has now moved to In Trouble. The
project can also move to In Trouble if it passes a second threshold value that
separates Off Plan from In Trouble.
In Trouble
No matter in what way the project reaches the In Trouble condition, the impli-
cations are very serious. To be In Trouble means that there is not much chance
that the project can be restored. Serious intervention is required because the
problem is out of control and out of the range of the project manager’s abilities
to correct. However, just because a project is In Trouble doesn’t necessarily
mean that the project manager is at fault. There may be cases where freak
occurrences and random acts of nature have put the project in this category.
The project manager is unable to put a get-well plan in place and is asking for
help that goes beyond his or her range of authority. The portfolio manager is
Project Portfolio Management
383
24 432210 Ch20.qxd 7/2/03 9:34 AM Page 383
considering canceling the project unless there is some compelling reason why
that action should not be taken. So a new project manager will not necessarily
rectify the problem.
The Role of the Project Manager
Obviously, one of the project manager’s key responsibilities is the status of the
project. While there are many reasons that a project may drift out of plan, it is the
responsibility of the project manager to institute corrective measures to restore
the project to an On Plan status. The extent to which the project manager meets
that responsibility will be obvious from the future status of an Off Plan project.
The project manager can also be a cause of an Off Plan status. That can happen
in a number of ways. In our experience, one of the major contributing factors is
the failure of the project manager to have a good system of cross-checking and
validating the integrity of the task status being reported by the team. If the proj-
ect manager does not have a visible process for validating task status, that is a
good indication that scheduling problems are sure to occur. The second behav-
ioral problem that we see is the failure of the project manager to establish a
repeatable and effective communications process. The first place to look for that
is in constant questioning from the team members about some aspect of the
project that impacts their work for which they have little or no knowledge.
There should be full disclosure by the project manager to the team. That process
begins at planning time and extends through to the closure of the project.
Reporting Portfolio Performance
Two well-known reporting tools can be used to compare the projects across a
portfolio and likewise the general performance of the portfolio as a whole:
cost/schedule control (C/SC) and milestone trend charts. Both of these were
discussed in detail in Chapter 10, and that discussion is not repeated here.
What we will do is take those two reporting tools and show how they can be
applied to measuring the performance of the portfolio.
Schedule Performance Index and Cost Performance Index
From C/SC we take the schedule performance index (SPI) and cost perfor-
mance index (CPI).
Schedule performance index. The schedule performance index (SPI) is a mea-
sure of how close the project is to performing work as it was actually sched-
uled. If the project is ahead of schedule, its SPI will be greater than 1, and if
it is behind schedule its SPI will be less than 1, which would indicate that
the work performed was less than the work scheduled.
Chapter 20
384
24 432210 Ch20.qxd 7/2/03 9:34 AM Page 384
Cost performance index. The cost performance index (CPI) is a measure of how
close the project is to spending on the work performed to what was planned
to have been spent. If you are spending less on the work performed than
was budgeted, the CPI will be greater than 1. If not, and you are spending
more than was budgeted for the work performed, then the CPI will be less
than 1.
These two indices are intuitive and are good yardsticks to compare the projects
in a portfolio. Any value less than 1 is undesirable; any value over 1 is good.
These indices are displayed graphically as trends compared against the base-
line value of 1.
SPI and CPI Trend Charts
The milestone trend charts that we introduced in Chapter 10 are adapted here
to fit the SPI and CPI trends. We will track the SPI and CPI over time using the
criteria established in Chapter 10.
Some examples will help. Take a look at a milestone trend chart for a hypo-
thetical project (see Figure 20.16). The trend chart plots the SPI and CPI for a
single project at weekly reporting intervals. The heavy horizontal line has the
value 1. That is the boundary value for each index. Values above 1 indicate an
ahead-of-schedule or under-budget situation for that reporting period. Values
below 1 indicate a behind-schedule or over-budget situation for that reporting
period. Over time these indices tell us an interesting story of how the project is
progressing or not progressing.
For example, Figure 20.16 shows that beginning with Week 5 the schedule for
Project ALPHA began to slip. The slight improvement in the budget may be
explained by work not being done, and hence the cost of that work that was
scheduled but not done was not logged to the project. This type of relationship
between schedule and cost is not unusual.
Spotting Out-of-Control Situations
Certain patterns signal an out-of-control situation. Some examples of these
sorts of situations are shown in Figures 20.17 through 20.20 and are described
in this section.
Figure 20.17 depicts a project schedule is slowly slipping out of control. Each
report period shows additional slippage since the last report period. Four such
successive occurrences, however minor they may seem, require special correc-
tive action on the part of the project manager.
Project Portfolio Management
385
24 432210 Ch20.qxd 7/2/03 9:34 AM Page 385
Figure 20.16 Example SPI and CPI trend chart.
Figure 20.17 A run up or down of four or more successive SPI or CPI values.
1.6
Project: ALPHA
Project Week
S
C
S
S
C
S
C
C
S
C
S
C
S
C
S
C
Under budget
Ahead of schedule
Over budget
Behind schedule
1.4
1.2
1.0
0.8
0.6
0.4
123456789
1.6
Project: ALPHA
Project Week
S
C
S
S
C
S
C
C
S
C
S
C
Under budget
Ahead of schedule
Over budget
Behind schedule
1.4
1.2
1.0
0.8
0.6
0.4
123456789
Chapter 20
386
24 432210 Ch20.qxd 7/2/03 9:34 AM Page 386
Figure 20.18 Seven or more successive SPI or CPI values above or below 1.
Figure 20.18, shows a minor over-budget situation. While this may not be sig-
nificant by itself, that situation has persisted for the last seven report periods.
The portfolio manager can fairly ask the project manager why he or she hasn’t
corrected the situation. The situation isn’t serious, but it should have been
fixed by now. There may be extenuating circumstances that occurred in the
first few weeks of the project that have persisted without any possibility of cor-
rection. It is true that the CPI and SPI are fairly stable despite their negative
performance.
Figure 20.19 shows both the SPI and CPI trending in the same direction. The
fact that the trend is negative is very serious. Not only is the schedule slipping,
but also there are consistent cost overruns at the same time. If the situation
were reversed and the trend were positive, you would obviously have a much
better situation. In that case not only would the project be ahead of schedule,
but it would also be running under budget. Figure 20.20 illustrates that point.
1.6
Project: ALPHA
Project Week
S
C
S
S
C
S
C
C
S
C
S
C
S
C
Under budget
Ahead of schedule
Over budget
Behind schedule
1.4
1.2
1.0
0.8
0.6
0.4
123456789
Project Portfolio Management
387
24 432210 Ch20.qxd 7/2/03 9:34 AM Page 387
Figure 20.19 SPI and CPI trending in the same direction.
Figure 20.20 SPI and CPI trending in the same direction.
1.6
Project: ALPHA
Project Week
S
C
S
S
C
S
C
S
C
S
S
S
C
C
C
C
Under budget
Ahead of schedule
Over budget
Behind schedule
1.4
1.2
1.0
0.8
0.6
0.4
123456789
1.6
Project: ALPHA
Project Week
S
C
S
S
C
S
C
C
S
C
S
C
S
C
Under budget
Ahead of schedule
Over budget
Behind schedule
1.4
1.2
1.0
0.8
0.6
0.4
123456789
Chapter 20
388
24 432210 Ch20.qxd 7/2/03 9:34 AM Page 388
NOTE
Don’t be too quick to congratulate the project manager, because it may not be his or
her heroic efforts that created that situation. If the duration estimates were too gener-
ous and the labor needed to complete the activities was not what was estimated, then
the project may be ahead of schedule and under budget through no special efforts of
anyone on the team. Still, give the project manager some room here; he or she may
have been heroic.
In either case, whether trending to the good or trending to the bad, a good
portfolio manager investigates and finds out what has happened.
These same data plots can be used to show how the portfolio is performing
both with respect to schedule and cost. Figure 20.21 is the hypothetical data for
the BETA Program Portfolio. It consists of five projects that all began at the
same time. The solid lines are the SPI values for the five projects over the
seven-week report period. The heavy dotted line is the portfolio average.
While the portfolio has been behind schedule for the entire seven weeks, it is
trending upward and has nearly reached an on-schedule situation. The same
type of plot can show budget performance for the portfolio as well.
Figure 20.21 SPI values for a hypothetical portfolio.
1.6
Portfolio: BETA Program
Project Week
Portfolio average
Ahead of schedule
Behind schedule
1.4
1.2
1.0
0.8
0.6
0.4
123456789
Project Portfolio Management
389
24 432210 Ch20.qxd 7/2/03 9:34 AM Page 389
Closing Projects in the Portfolio
Best practices include acceptance criteria, agreed upon by the client and the proj-
ect manager during project planning, that clearly state when the project is con-
sidered finished. This acceptance criteria usually takes the form of a checklist of
scope items or requirements. When all items on the checklist have been checked
off as completed, the project is deemed finished. The work of the project, how-
ever, is not yet complete. What remains is what we call a post-implementation
audit. The topic of this section is to examine the activities and contents of a post-
implementation audit and discuss why it is so important that one be done.
Attainment of Explicit Business Value
Each project was proposed based on the value it would return to the enterprise
if it were funded and completed successfully. Was that value achieved? This is
a question that may not be answerable until some time after the project is com-
plete, but it is a question that deserves an answer. This proposed value was the
basis for the business justification for the project and was a major factor in
placing the project in the portfolio in the first place.
Lessons Learned
Following are several questions that might be asked about a project just
completed:
■■ Was the project goal/objectives achieved?
■■ Was the project work done on time?
■■ Was the client satisfied with the project results?
■■ Was the explicit business value realized? (Check success criteria.)
■■ What modules were learned about your project management methodol-
ogy? What worked? What didn’t work?
■■ How well did the team follow the methodology?
All of these questions are important and should be answered. In some cases
the particular nature of the project may render some questions more important
than others, but that does not excuse the project team from answers to all of
them. Some of the most important information about the project management
process can come from these answers, so the answers should be shared with all
other project teams.
Chapter 20
390
24 432210 Ch20.qxd 7/2/03 9:34 AM Page 390
Preparing Your Project for Submission to the Portfolio
Management Process
Now that you understand the portfolio management process, you should have
a pretty good idea of what you need to do to prepare your project proposal for
submission and consideration to be part of a portfolio. In the absence of your
having to follow a prescribed procedure for proposing your project, we can
suggest three ways to prepare your project proposal:
■■ First, you might adapt the POS, which was discussed in detail in Chapter 3.
The POS will work quite well but may need some additional information,
like cost and time estimates, that are traditionally not part of the POS.
■■ Second, you might try a two-step approach. Submit the POS first to deter-
mine the alignment of your project, and then prepare a detailed project
plan in order to submit time and cost data to the prioritization and selec-
tion phases.
■■ Finally, you might develop an entirely new submission process based on
the five-phase portfolio management process.
The next three sections spend a few paragraphs on each one of these options.
A Revised Project Overview Statement
Chapter 3 already discusses the POS in great detail, so we won’t repeat that
discussion here. Recall that the POS is a short document (ideally one page) that
concisely states what is to be done in the project, why it is to be done, and what
value it will provide to the organization when completed.
When it is used in the portfolio management process, the main purpose of the
POS is to have the portfolio committee evaluate the project and determine that
it is in alignment with the corporate strategy. Later it will be reviewed by the
managers who are responsible for setting priorities and deciding what projects
to support in the portfolio. For this reason, the POS cannot contain any techni-
cal jargon that generally would not be used across the enterprise. Once
approved, the POS becomes the foundation for future planning and execution
of the project. It becomes the reference document for questions or conflicts
regarding project scope and purpose.
Parts of the POS
The POS has five component parts:
Project Portfolio Management
391
24 432210 Ch20.qxd 7/2/03 9:34 AM Page 391
■■ Problem/opportunity statement
■■ Project goal
■■ Project objectives
■■ Success criteria
■■ Assumptions, risks, and obstacles
Recall that its structure is designed to lead the reader from a statement of fact
(problem/opportunity) to a statement of what this project will address (project
goal). Given that senior management is interested in the project goal and that it
addresses a concern of sufficiently high priority, they will read more detail on
exactly what the project includes (project objectives). The organizational value
is expressed as quantitative outcomes (success criteria). Finally, a summary of
conditions that may hinder project success are identified (assumptions, risks,
obstacles). The following list looks at each of these sections more closely as they
apply to the project portfolio process:
Problem/opportunity statement. The first part of the POS is a statement of
the strategic objective(s) that the project is addressing. If appropriate, the
statement should come directly from the company’s strategic plan or be
based on the portfolio strategy. This is critical because it provides a basis
for the rest of the document. It also sets the priority with which the portfo-
lio manager will view what follows. If you are addressing a high-priority
area or high-value area, your idea will get more attention and the reader
will read on.
Project goal. The second section of the POS states the goal of the project—
what you intend to do to address the strategic objective(s) identified in the
previous section. The purpose of the goal statement is to get senior man-
agement to value the idea enough to read on. In other words, they should
think enough of your approach to the corporate strategy to conclude that it
warrants further attention and consideration. Several other proposals will
pertain to the same objective(s). Because yours will not be the only one
submitted, you want it to stand out among the crowd.
The goal statement must not contain any language or terminology that
might not be understandable to anyone having occasion to read it. In other
words, no techie talk allowed. It is written in the language of the organiza-
tion so that anyone who reads it will understand it without further expla-
nation from the proposer. Under all circumstances, avoid jargon.
The goal statement is short and to the point. Keep in mind that the more you
write, the more you increase the risk that someone will find fault with some-
thing you have said. The goal statement does not include any information
that might commit the project to dates or deliverables that are not practical.
Remember, you do not have much detail about the project at this point.
Chapter 20
392
24 432210 Ch20.qxd 7/2/03 9:34 AM Page 392
Project objectives. The third section of the POS is the project objectives.
Here is your chance to show more breadth to your project and bind it even
tighter to one or more of the strategic objectives.
Success criteria. The fourth section of the POS answers the question,
“Why do we want to do this project?” It is the measurable explicit business
outcome that will result from doing this project. It sells the project to the
portfolio manager. This may be the most important part of the POS. The
portfolio manager is trying to maximize the value that can be generated
from the portfolio. Every project has to contribute to that value.
The question that you have to answer is this: What business value will result
from successfully completing the project? The answer to this question will be
a statement of the explicit business outcome to be realized. It is essential that the
criteria be quantifiable and measurable, and if possible, expressed in terms
of business value. Remember that you are trying to sell your idea to the port-
folio manager.
As an added value statement, consider quantifiable statements about the
impact your project will have on efficiency and effectiveness, error rates,
reduced turnaround time to service a customer request, reduced cost of
providing service, quality, or improved customer satisfaction. Management
deals in deliverables, so always try to express success criteria in quantita-
tive terms. By doing this you avoid any possibility of disagreement as to
whether the success criteria were met and the project was successful. The
portfolio manager will look at your success criteria and assign organiza-
tional value to your project. In the absence of other criteria, this success
criteria will be the basis for his or her decision whether or not to place the
project in the portfolio.
Assumptions, risks, and obstacles. The fifth section of the POS identifies
any factors that can affect the outcome of the project and that you want to
bring to the attention of the portfolio manager. These factors can affect
deliverables, the realization of the success criteria, the ability of the project
team to complete the project as planned, or any other environmental or
organizational conditions that are relevant to the project. You want to
record anything that can go wrong. Be careful, however, to put in the POS
only those items that you want senior management to know about and in
which they will be interested.
The project manager uses the assumptions, risks, and obstacles section to
alert the portfolio manager to any factors that may interfere with the project
work or compromise the contribution that the project can make to the orga-
nization. Do not assume that everyone knows what the risks and perils to
the project will be. Document them and discuss them.
Project Portfolio Management
393
24 432210 Ch20.qxd 7/2/03 9:34 AM Page 393