Essentials of Neuroimaging for Clinical Practice - part 9 pdf
Bạn đang xem bản rút gọn của tài liệu. Xem và tải ngay bản đầy đủ của tài liệu tại đây (454.3 KB, 17 trang )
118 ESSENTIALS OF NEUROIMAGING FOR CLINICAL PRACTICE
volts, and its frequency ranges to 40 Hertz (Hz) or
more. Figure 6–1 shows a standard placement of elec-
trodes over the scalp.
The EEG signal does not arise from individual ac-
tion potentials; rather, it derives from the extracellular
current flow that is associated with excitatory postsyn-
aptic potentials (EPSPs) and inhibitory postsynaptic
potentials (IPSPs). These current flows are of much
lower voltage than action potentials. They are, how-
ever, distributed across a large surface area of mem-
brane and are of longer durations than action poten-
tials, allowing summation. Even with summation,
however, the fields produced by individual neurons
are much too weak to be detected by the EEG at the sur-
face of the scalp. In order to generate externally detect-
able signals, the neurons within a volume of tissue
must be aligned, and their synaptic current flows must
be correlated in time. Of all the neurons in the human
brain, the cortical pyramidal cells are particularly well
suited to generate externally observable electric fields.
This is because of their elongated apical dendrites,
which are systematically aligned in a columnar fash-
ion, perpendicular to the cortical sheet.
Although much of the amplitude of the brain elec-
trical activity derives from cortical neurons underlying
the scalp electrodes, the synchronicity of the recorded
activity is largely regulated by subcortical sites. For
example, pacemaker neurons within the thalamus nor-
mally oscillate synchronously, producing an alpha
rhythm that characterizes the EEG of an awake healthy
person at rest. Such synchrony is reduced by arousal.
Desynchronization of electrical activity is thought to
be mediated by afferent projections from the reticular
formation and basal forebrain. These effects may be
modulated by noradrenergic, cholinergic, and γ-ami-
nobutyric acid (GABA)ergic neuronal systems. Brain
electrical frequencies are generally reported in the delta
(0–4 Hz), theta (4–8 Hz), alpha (8–13 Hz), and beta (>13
Hz) bands. Figure 6–2 shows examples of alpha and
beta activity.
Quantitative Electroencephalography
EEGs have traditionally been evaluated by visual in-
spection of paper tracings. To quantify measurements
of the frequency content of the EEG, the digitized sig-
nal can be recorded on magnetic or optical media. The
quantitative EEG (qEEG) provides information that
cannot reliably be extracted from visual inspection of
the EEG. It has been argued that such qEEG estimates
improve intra- and interrater reliability and yield re-
producible estimates that can be compared over time
in single individuals. Once digital data are recorded,
they can be transformed through use of the Fourier
transformation algorithm from the domain of “ampli-
tude versus frequency” to a domain of “power versus
frequency.” The qEEG gives rise to a number of differ-
ent measures. For example, absolute power is a measure
of the intensity of energy measured in microvolts
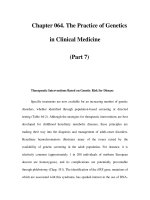
Figure 6–1. Standard placement of EEG record-
ing electrodes at the top and sides of the head.
Abbreviations for electrode placements: A = auricle;
C = central; Cz=vertex; F=frontal; Fp=frontal pole;
O = occipital; P=parietal; T=temporal. The multiple
electrode placements overlying a given area (e.g.,
temporal) are indicated by numerical subscripts.
Placement C
4
overlies the region of the central sulcus.
Source. Reprinted from Kandel ER, Schwartz JH, Jessell TM
(eds.): Principles of Neural Science, 3rd Edition. New York,
McGraw-Hill, 1991, p. 779. Copyright 1991, The McGraw-Hill
Companies. Used with permission.
Electroencephalography, ERPs, and Magnetoencephalography 119
squared and calculated in a series of frequency bands
(the power spectrum) for approximately 25 seconds. An-
other important measure is coherence—a measure of the
phase consistency of two signals (i.e., the extent to which
EEG signals from different brain regions have fre-
quency components that are time-locked to each
other). Coherence varies between 0 and 1 and is analo-
gous to a correlation coefficient of the signal between
two brain areas. It is thought to reflect the degree of
functional connectivity between brain regions, al-
though its functional physiological significance re-
mains unclear.
Clinical Use in Psychiatric Practice
When electroencephalography was first introduced by
Hans Berger in 1929, the hope was that it would di-
rectly aid the diagnosis of the major mental disor-
ders—schizophrenia, depression, and anxiety. This
hope has long since been abandoned. Nonetheless, the
EEG remains a valuable part of psychiatric clinical
practice. It is mainly helpful in the diagnosis of neuro-
logical disorders—such as delirium, dementia, and ep-
ilepsy—that must often be ruled out in the differential
diagnosis of many “nonorganic” psychiatric disorders.
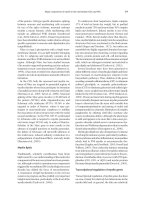
Figure 6–2. Electroencephalogram (EEG) recorded in a human subject at rest from the scalp surface at various
points over the left and right hemispheres.
Three pairs of EEG electrodes are positioned so as to overlie the frontal, temporal, and occipital lobes. Beta
activity—the EEG activity with the highest frequency and lowest amplitude—is recorded over the frontal lobes.
Alpha activity—a signature of a brain in a relaxed and wakeful state—is recorded in the occipital and temporal
lobes. The presence of alpha activity in the occipital lobe suggests that the subject’s eyes were closed.
Source. Reprinted from Kandel ER, Schwartz JH, Jessell TM (eds.): Principles of Neural Science, 3rd Edition. New York, McGraw-
Hill, 1991, p. 778. Copyright 1991, The McGraw-Hill Companies. Used with permission.
120 ESSENTIALS OF NEUROIMAGING FOR CLINICAL PRACTICE
Although the EEG does not play a direct role in the
diagnosis of psychiatric disorders, the EEGs in such
disorders often do show abnormal (although nonspe-
cific) features. In the following sections, I summarize
some characteristic features of the EEG in dementia,
delirium, schizophrenia, and other psychiatric disor-
ders.
Dementias
In general, the EEG in patients with dementia is char-
acterized by relatively low-frequency rhythms with an
increase in the amount of delta and theta waves and a
relative decrease in the amount of high-frequency beta
activity. In addition, the alpha rhythm is slowed, and in
some individuals its normal suppression to eye open-
ing is not observed. These features may be particularly
helpful in distinguishing dementia from depression in
elderly persons.
It is thought that at least half of the individuals with
minimal impairment on the Mini-Mental State Exami-
nation show some EEG abnormalities. It has therefore
been suggested that the EEG may aid the diagnosis of
dementia at an early stage in the disease course. More-
over, increased slow activity is correlated with cogni-
tive impairment and measures of clinical severity in
Alzheimer’s disease. qEEG studies in dementia are
consistent with conventional EEG findings, confirming
increased delta and/or theta power.
Although the etiology of dementia cannot be deter-
mined by use of the EEG alone, certain types of demen-
tia are characterized by particular EEG features. For ex-
ample, focal EEG abnormalities are more common in
vascular dementias (although not in diffuse white mat-
ter ischemic disease [Binswanger’s disease]) than in
primary degenerative dementias. In frontotemporal
dementias such as Pick’s disease, the posterior domi-
nant background rhythm is relatively well preserved,
whereas increases in slow waves are less pronounced
and, when they occur, tend to be distributed anteriorly.
In Creutzfeldt-Jakob disease, the EEG is characterized
by frontally distributed triphasic waves and paroxys-
mal epileptiform discharges.
Delirium
The hallmark of the EEG in delirium is a slowing of the
background rhythm. The exception to this is delirium
tremens, in which the EEG is characterized by fast
rhythms. The appearance of generalized slow-wave ac-
tivity during a delirium often parallels the severity and
time course of alternations in consciousness. In addi-
tion to increased slowing, other specific EEG patterns
are associated with particular metabolic encephalopa-
thies. For example, frontal triphasic waves at a fre-
quency of 2 or 3 per second are particularly character-
istic of a hepatic encephalopathy and may also occur in
patients with chronic renal failure.
Schizophrenia
There are no EEG changes that are specific to schizo-
phrenia. Nonetheless, across a large number of studies,
there is some consensus that patients with schizophre-
nia show a high incidence of EEG abnormalities, in-
cluding increased delta and theta rhythms. Evaluation
of the EEG in schizophrenia is complicated by the het-
erogeneity of the disorder itself and by the effects of
medication. Indeed, the incidence of EEG abnormali-
ties may be particularly high in patients taking atypi-
cal antipsychotic drugs such as clozapine and olanza-
pine.
Other Psychiatric Disorders
The incidence of abnormal EEG findings in mood dis-
orders is thought to range from 20%–40%. Small sharp
spikes and paroxysmal events have been described,
and there are numerous reports of abnormal sleep pat-
terns. Several studies have also suggested a high inci-
dence of EEG abnormalities in anxiety disorders, in-
cluding panic disorder and obsessive-compulsive
disorder. There is no marked consistency across stud-
ies, however, in the precise patterns of abnormalities.
Event-Related Potentials
In the following subsections, I consider the issue of
how an ERP component is defined and provide a brief
overview of some of the better known ERP compo-
nents that have been studied in psychiatric disorders.
Generation of Signal:
Selective Averaging of
EEGtoDeriveERPs
Event-related potentials (ERPs) are voltage fluctua-
tions, derived from the ongoing EEG, that are time-
locked to specific sensory, motor, or cognitive events
(Figure 6–3).
Suppose a stimulus is presented to a subject during
EEG recording. Some of the voltage changes may be
specifically related to the brain’s response to that stimu-
lus. In most cases, the voltage changes occurring within
Electroencephalography, ERPs, and Magnetoencephalography 121
a particular epoch (time period) of EEG following an
event are on the order of microvolts and are therefore
too small to be reliably detected. The most common way
of extracting the signal is therefore to record a number
of EEG epochs, each time-locked to repetitions of the
same event (or type of event), and to derive an average
waveform. EEG activity that is not time-locked to the
event will vary randomly across epochs; thus, this back-
ground activity will disappear to zero in the averaging
procedure.
In early research, the term evoked potentials was used
to describe these waveforms, because it was believed
that the waveforms reflected brain activity that was di-
rectly “evoked” by the presentation of stimuli. Many of
these waveforms, however, are now thought to reflect
processes that arise from the cognitive demands of the
situation—hence the use of the more neutral term
event-related potentials.
What Is an ERP “Component”?
Particular regions or temporal windows of the ERP
waveform have been differentiated and labeled ac-
cording to their polarity (positive [P] or negative [N]),
their peak latency, and/or their ordinal position. These
are called ERP components. ERP components have tra-
ditionally been classified as either exogenous (i.e., gen-
erally occurring within 200 msec of stimulus onset and
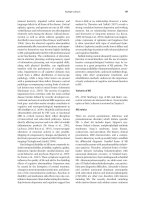
Figure 6–3. Idealized waveform of computer-averaged auditory event-related potential (ERP) elicited to brief
sound.
The ERP is generally too small to be detected in the ongoing electroencephalogram (EEG) (top) and requires
computer averaging over many stimulus presentations to achieve adequate signal-to-noise ratios. The logarith-
mic time display allows visualization of the early brain-stem responses (waves I–VI), the midlatency compo-
nents (N
0
, P
0
, N
a
, P
a
, and N
b
), the “vertex potential” waves (P
1
, N
1
, and P
2
), and the task-related endogenous
components (N
d
, N
2
, P
3
, and slow wave [SW]). S=auditory stimulus; µV=microvolts.
Source. Reprinted from Hillyard SA, Kutas M: “Electrophysiology of Cognitive Processing.” Annual Review of Psychology 34:33–61, 1983.
Copyright 1983, Annual Reviews (www.annualreviews.org). Used with permission from The Annual Review of Psychology, Volume 34.
122 ESSENTIALS OF NEUROIMAGING FOR CLINICAL PRACTICE
determined by the physical nature of the eliciting stim-
ulus) or endogenous (i.e., sensitive to changes in the
state of the subject, the meaning of the stimulus, and/
or the processing demands of the task). The question of
what constitutes a distinct ERP component remains
controversial. Most researchers define components on
the basis of their polarity, their scalp distribution, their
characteristic latency, and their sensitivity to experi-
mental manipulations.
As a rule of thumb, differences in the polarity and/
or scalp distribution are usually interpreted as reflect-
ing the activity of distinct neuronal populations sub-
serving qualitatively different neurocognitive pro-
cesses. This is not necessarily the case, however, be-
cause a waveform observed on the surface of the scalp
may result from the summation of electrical activity
that may be generated by several different sources in
the brain. Thus, an ERP peak may not necessarily re-
flect activity of a single neuronal generator but rather
the combined activity of two (or more) generators max-
imally active before or after that peak, but with fields
that summate to a maximum at the time of the peak.
Because ERPs are time-locked to specific events and
their measurement does not require an overt response
by the subject, they provide important information
about the relative time course of cognitive events. Once
again, however, it is difficult to extrapolate from the
waveform seen at the surface of the scalp to the under-
lying neurocognitive process. For example, is it the tim-
ing of a peak itself that is more informative about cog-
nitive processing, or is the timing of the peak’s onset of
most relevance? Does a peak appear when a particular
cognitive process is complete? Or does it indicate that
enough information has accumulated to cross threshold
and trigger the onset of a cognitive operation?
Abnormalities in Specific ERP
Components in Psychiatric Disorders
In this section, I briefly review four of the ERP compo-
nents studied in psychiatric research—the contingent
negative variation (CNV), the mismatch negativity
(MMN), the P300, and the N400. I first provide a brief
description of the paradigms that elicit each of these
components, and then summarize studies that have ex-
amined these components in different psychiatric pop-
ulations.
The Contingent Negative Variation
The CNV was first described by Walter and colleagues
in 1964. In their original paradigm, a warning click was
presented, followed by a flashing light. The subject
was required to press a button in response to the light.
During the interval between the click and the light, a
slow negative wave was observed that reached its
peak at around the time of the light presentation—the
CNV. The CNV was not evident when the click or the
light was presented alone or when they were paired
without the response requirement. Although it was
originally described as an “expectancy” wave, more
recently the CNV has been linked with the motor or
goal-directed preparatory processes. Several studies
have reported a reduced amplitude of the CNV in pa-
tients with schizophrenia and patients with depres-
sion. These findings have generally been interpreted
fairly nonspecifically as reflecting abnormalities in at-
tentional processes.
The Mismatch Negativity
At about 200 milliseconds (msec) following the pre-
sentation of auditory events that deviate in some way
from the surrounding events, a negative component is
observed—the N200 or N2. The difference waveform
between the improbable events (signals) and the sur-
rounding events (standards) is called the MMN. The
MMN is observed in response to events that are im-
probable with respect to a number of factors, such as
frequency and duration. It is seen in association with
both attended and unattended events.
Several studies have reported that the MMN is re-
duced in patients with schizophrenia, particularly in
response to events that are deviant in duration. A re-
duced MMN has been reported in both medicated and
unmedicated patients as well as in unaffected first-
degree relatives of patients. Functional magnetic reso-
nance imaging (fMRI) findings suggest that patients
with schizophrenia show abnormally reduced activity
of the superior temporal cortex in association with mis-
match events. It has been hypothesized that the re-
duced MMN in patients with schizophrenia reflects a
specific deficit in auditory sensory memory. The speci-
ficity of MMN deficits to schizophrenia remains con-
troversial; some (but not all) studies have also reported
a reduced MMN in association with depression.
The P300
The P300 is probably the best-studied of all ERP com-
ponents, both in healthy volunteers and in psychiatric
populations. The standard paradigm eliciting the P300
is similar to the one described above in relation to the
MMN: a series of events are presented of which one
class is rarer than the other—hence the name oddball
Electroencephalography, ERPs, and Magnetoencephalography 123
task. Subjects are required to respond in some way to
the rarer of the two events. The ERP elicited consists of
a positive deflection that is maximal over the parietal/
central scalp electrodes and has a latency of at least 300
msec and as much as 900 msec. In simple oddball
tasks, the amplitude of the P300 depends on proba-
bility: the rarer the event, the larger the P300. It has
been proposed that the P300 reflects the process by
which contextual information is updated within mem-
ory. Several investigators, however, have noted that
the P300 does not appear to be a unitary component.
Indeed, recent fMRI studies that used oddball para-
digms revealed widespread brain activation, distrib-
uted throughout many cortical and subcortical re-
gions.
There have been numerous investigations of the
P300 in patients with a variety of psychiatric disorders,
particularly schizophrenia. The most robust finding in
schizophrenia patients is of an abnormally reduced
P300 amplitude. In some studies, the P300 latency is
increased. The reduced P300 amplitude is particularly
robust when auditory rather than visual stimuli are
presented. The reduced P300 amplitude has been de-
scribed in patients having their first episode of psycho-
sis and in patients who are not taking medication.
Some studies have suggested that the reduced P300
amplitude is associated with negative symptoms and
with positive thought disorder (disorganized speech).
Moreover, there is some evidence that the P300 ampli-
tude becomes larger as symptoms ameliorate in the
same patients over time, although it does not appear to
normalize completely. These findings suggest that the
reduced P300 may be both a state and a trait marker in
schizophrenia.
A reduced P300 has also been reported in individu-
als who are at risk for developing schizophrenia and in
healthy individuals who have loosening of associa-
tions similar to that observed in schizophrenia patients
with positive thought disorder. Some studies, but not
all, have reported a greater reduction of the P300 am-
plitude on the left than the right side in schizophrenia.
Several studies also have linked structural gray matter
deficits in temporal regions with a reduced P300 in
schizophrenia.
Although an abnormal P300 is a very reliable find-
ing in schizophrenia, it is not specific to schizophrenia.
Studies have also reported abnormalities in the P300
waveform in association with dementia, substance
abuse, depression, anxiety disorders (panic disorder,
obsessive-compulsive disorder, and posttraumatic
stress disorder) and in association with some personal-
ity disorders (schizoid, antisocial, and borderline).
The N400
The N400 ERP component is a negative shift in the ERP
waveform that occurs approximately 400 msec follow-
ing the onset of contextually inappropriate words. The
N400 was first described in association with conceptual
(i.e., semantic and pragmatic) violations in sentences
(e.g., the N400 elicited in response to the word “dog” is
of greater amplitude than the N400 elicited to the word
“milk” when preceded by the sentence fragment, “He
took coffee with sugar and ___“). Subsequent studies
have established that the N400 amplitude is sensitive
to the organization of semantic memory during the
processing of word pairs, whole sentences, and whole
discourse.
The observation that many patients with schizo-
phrenia appear to show abnormalities in processing re-
lationships between concepts provided the impetus for
a large number of studies that have examined the N400
in schizophrenia. Some of these studies report a rela-
tively intact N400 congruity effect in schizophrenia.
Other studies, however, have reported an abnormally
reduced N400 effect in both sentence and word-pair
paradigms. One reason for these contradictory find-
ings may be heterogeneity in the schizophrenia patient
samples studied. Indeed, there is some evidence that
the N400 effect is inversely correlated with severity of
positive thought disorder in schizophrenia. Some in-
vestigators have also reported an increase in the abso-
lute amplitude of the N400 waveform elicited in re-
sponse to contextually appropriate and contextually
inappropriate words, suggesting that schizophrenia
patients have difficulty processing the meaning of
words, regardless of the surrounding context.
Modifications of standard word association and
sentence anomaly paradigms have yielded additional
insights into the nature of conceptual abnormalities
in schizophrenia. In a “mediated semantic priming”
paradigm, an N400 congruity effect to words such as
“stripes” preceded by indirectly related words such as
“lion” (related to “tiger,” which in turn is related to
“stripes”) has been reported in schizophrenia patients
but not healthy control subjects. This finding is consis-
tent with the hypothesis that activity spreads abnor-
mally far across interconnected representations in se-
mantic memory in schizophrenia patients. In a sen-
tence paradigm, an N400 effect was elicited in healthy
volunteers, but not in patients with schizophrenia, in
response to words (e.g., “river”) that were preceded by
a semantically associated homonym (e.g., “bridge”)
when the surrounding context (e.g., “They took out
their cards and started to play ___“) suggested the sec-
124 ESSENTIALS OF NEUROIMAGING FOR CLINICAL PRACTICE
ondary meaning of the homonym. Whereas in control
subjects, the context of the whole sentence overrode
the semantic associative effects of the sentence’s indi-
vidual words, this result did not occur in patients with
schizophrenia.
Probably the most robust abnormality described
across N400 studies in schizophrenia is an increased
N400 latency. This abnormality has been reported in
both word and sentence paradigms and suggests that
the contextual integration of words may be delayed in
schizophrenia.
Extracting Spatial Information:
Source Localization
From Multichannel
Encephalography and
Magnetoencephalography
The high temporal resolution of electrophysiological
techniques is a clear advantage over other functional
neuroimaging techniques—such as fMRI, positron
emission tomography (PET), and single photon emis-
sion computed tomography (SPECT)—that look at
events over the course of seconds. However, the EEG
and ERPs provide very little information about the an-
atomic location of the neural systems that give rise to
scalp-recorded voltage patterns.
In the past few years, there has been some progress
toward improving the spatial resolution of EEG/ERPs
by measuring over multiple channels distributed
across the scalp surface and by using source localiza-
tion methods to locate the underlying neural genera-
tor(s). In parallel, another technique—magnetoenceph-
alography—has evolved from single-channel systems
to multichannel systems that can monitor well over 100
channels simultaneously. The magnetoencephalogram
(MEG) detects a magnetic signal that is derived from
the same electrical currents that produce the EEG. In-
deed, the raw MEG strikingly resembles the EEG, with
alpha, mu, and tau rhythms. Similarly, the same types
of signal averaging as described above that give rise to
distinct ERP components also give rise to analogous
waveforms when similar paradigms are used in the
MEG (Figure 6–4). However, rather than focusing on
the waveform itself, most MEG studies have empha-
sized source localization.
In the following section, I introduce the principles
of source localization. I highlight implications of dif-
ferences in the EEG and MEG signals and emphasize
some caveats in regard to interpreting source locali-
zation data. I then summarize the potential for such
methods to yield new insights into psychiatric disor-
ders.
Source Localization
Multichannel electroencephalography and magne-
toencephalography can be used to generate spatial
maps of the EEG potential and the magnetic field, re-
spectively, over the surface of the scalp at different
points in time. There are important differences in the
types of maps derived from MEG and EEG. These dif-
ferences can be predicted from magnetic and electrical
theory and have important implications for determin-
ing the underlying source that gives rise to the two
types of maps. First, for a source that is oriented radi-
ally with respect to the scalp surface (including sources
near the center of the head), an EEG signal, but not a
MEG signal, can be detected over the scalp. In other
words, the EEG sees both radial and tangential sources,
whereas the MEG sees only tangential sources. Second,
for sources that are oriented tangentially to the scalp
surface, because of the orthogonality between mag-
netic and electrical fields, the MEG map is perpendicu-
lar to the EEG map. Third, the electrical conduction of
currents through the brain and skull leads to smearing,
or low-pass filtering of the voltage pattern in EEG,
whereas the MEG is only minimally affected by surface
smearing. Therefore, the MEG produces a somewhat
“tighter” map than the EEG. For all of these reasons,
MEG and EEG recordings provide different but com-
plementary information about underlying neural
sources and are therefore often collected together.
A mathematical model can then be applied from
maps at the scalp surface to estimate the most likely
source in the brain responsible for this surface field dis-
tribution. For a single focal source (or dipole), this
mathematical model is relatively straightforward and
is called a simple “inverse solution.” This model must
take into account neurophysiological and neuroana-
tomic information. For example, one would not expect
to localize primary sensory sources extracerebrally or
in white matter distant from primary sensory cortex.
One can then apply a “goodness of fit” calculation to
reflect the agreement between the known surface to-
pography that the estimated source would produce as
a function of the ideal mathematical “forward solu-
tion” and the actually measured field pattern.
More complex mathematical models must be ap-
Electroencephalography, ERPs, and Magnetoencephalography 125
plied to more complex maps. For example, longer-
latency endogenous complex potentials such as the
N400 probably arise from multiple anatomic sources. A
given spatiotemporal voltage pattern at the scalp may
arise from more than one configuration of sources and
is determined not only by their sites but also by their
orientations. Thus, even if it is mathematically possible
to calculate the inverse solution in such cases (and
sometimes even to find a relatively high goodness of
fit), it is important to recognize that this solution is not
necessarily correct. Nonetheless, the application of
such complex models has already yielded new insights
into the time course of brain activity during higher-
order cognitive processes such as memory and lan-
guage (Figure 6–5).
One approach that has been employed to improve
Figure 6–4. Time courses of MEG data at selected brain locations.
Waveforms show activity in response to words that are novel or repeated during a word-stem completion task.
Occipital regions are activated early and do not change with repetition, whereas more anterior regions activate later
and show strong replication effects.
Source. Reprinted from Dhond RP, Buckner RL, Dale AM, et al.: “Spatiotemporal Maps of Brain Activity Underlying Word Gen-
eration and Their Modification During Repetition Priming.” Journal of Neuroscience 21(10):3564–3571, 2001. Copyright 2001, The
Society for Neuroscience. Used with permission.
126 ESSENTIALS OF NEUROIMAGING FOR CLINICAL PRACTICE
source modeling is to use fMRI data (collected by using
identical stimulus presentation paradigms in the same
subjects) as a spatial constraint. Important caveats ap-
ply to use of such an approach, however. Whereas the
coupling between electrical activity in the brain and
the EEG and MEG signals measured on the surface of
the scalp follows from fundamental laws of physics
and is relatively well understood, the coupling be-
tween neuronal activity and hemodynamic measures
such as fMRI is not well understood. Thus, the precise
relationships between hemodynamic signals measured
with fMRI and electrical and magnetic signals mea-
sured with EEG and MEG are unclear. In particular,
there are few quantitative data on how the magnitude
of the hemodynamic response varies as a function of
the amplitude and duration of electromagnetic activity.
There is, however, increasing evidence for a strong de-
gree of spatial correlation between various measures
of local electrical activity and local hemodynamic sig-
nals. Some of the most persuasive evidence for such a
correlation comes from a direct comparison of maps
obtained through use of voltage-sensitive dyes, reflect-
ing depolarization of neuronal membranes in super-
ficial cortical layers, and maps derived from intrinsic
optical signals, reflecting changes in light absorption
due to changes in blood volume and oxygenation. Ear-
lier animal studies have also shown strong correlations
among local field potentials, spiking activity, and volt-
age-sensitive dye signals. Moreover, studies using in-
vasive electrical recordings and fMRI to compare local-
ization of functional activity in humans also provide
evidence for a spatial correlation between the local
electrophysiological response and the hemodynamic
response.
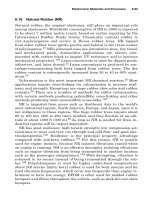
Figure 6–5. Estimated cortical activity patterns at
different latencies after reading word stems, as mea-
sured with magnetoencephalography.
Activation begins with a bilateral visual response in
the posterior occipital cortex (100–125 msec) and sub-
sequently spreads forward into the ventral occipital
cortex (125–145 msec) and lateralizes to the left hemi-
sphere (170–190 msec). It then spreads to both poster-
oventral and lateral temporal areas (205–230 msec)
and progressively extends to the anterior temporal
(235–365 msec) and ventral prefrontal (370–515
msec) cortices, before fading after 515 msec.
Source. Reprinted from Dhond RP, Buckner RL, Dale AM, et
al.: “Spatiotemporal Maps of Brain Activity Underlying Word
Generation and Their Modification During Repetition Prim-
ing.” Journal of Neuroscience 21(10):3564–3571, 2001. Copyright
2001, The Society for Neuroscience. Used with permission.
Electroencephalography, ERPs, and Magnetoencephalography 127
Use of Magnetoencephalography in
Psychiatry
The two current most common clinical uses of magne-
toencephalography are in localization of epileptiform
activity and presurgical mapping of sensory cortex
prior to neurosurgical procedures.
The use of multichannel electroencephalography
and magnetoencephalography in psychiatric research
is in its infancy. Nonetheless, MEG studies have al-
ready contributed to our knowledge of specific compo-
nents such as early auditory field potentials (the N100)
in schizophrenia and somatosensory ERPs in affective
psychoses. As discussed earlier, the development of
more comprehensive models and the integration of
magnetoencephalography with other functional neuro-
imaging techniques will enable study of the sources
that give rise to endogenous ERPs. Such research will
allow us to gain insight into the spatial and temporal
dynamics of neural systems underlying abnormal cog-
nitive function in psychiatric disorders.
Suggested Readings
EEG and qEEG
Hughes JR, John ER: Conventional and quantitative electro-
encephalography in psychiatry. J Neuropsychiatry Clin
Neurosci 11:190–208, 1999
Introduction to ERPs
Rugg MD, Coles MGH: Electrophysiology of Mind: Event-
Related Brain Potentials and Cognition (Oxford Psychol-
ogy Series, No. 25). Oxford, UK, Oxford University Press,
1997
The P300
Donchin E, Coles MGH: Is the P300 component a manifesta-
tion of context updating? Behavioral and Brain Science
11:355–372, 1988
Ford JM: Schizophrenia: the broken P300 and beyond. Psy-
chophysiology 36(6):667–682, 1999
The N400
Kutas M, Van Petten C: Event-related brain potential studies
of language, in Advances in Psychophysiology: A Research
Annual: 1988, Vol 3. Edited by Ackles PK, Jennings JR,
Coles MGH. Greenwich, CT, JAI Press, 1988, pp 129–187
Sitnikova T, Salisbury DF, Kuperberg G, et al: Electrophysio-
logical insights into language processing in schizophre-
nia. Psychophysiology 39:851–860, 2002
MEG and Combined MEG–fMRI Data
Dale AM, Liu AK, Fischl BR, et al: Dynamic statistical para-
metric mapping: combining fMRI and MEG for high-reso-
lution imaging of cortical activity. Neuron 26:55–67, 2000
Hari R, Levanen S, Raij T: Timing of human cortical functions
during cognition: role of MEG. Trends Cogn Sci 4:455–462,
2000
Reite M, Teale P, Rojas DC: Magnetoencephalography: appli-
cations in psychiatry. Biol Psychiatry 45:1553–1563, 1999
This page intentionally left blank
129
7
Neuroimaging in
Psychiatric Practice
What Might the Future Hold?
Scott L. Rauch, M.D.
It is exciting to consider the future of medical science.
In the case of neuroimaging in psychiatry, numerous
ongoing developments suggest that the future of our
field will be most exciting indeed. In this chapter, I dis-
cuss some relevant recent technological advances in
neuroimaging and their implications for clinical psy-
chiatry; moreover, I speculate about additional innova-
tions, emphasizing potential clinical as well as research
applications.
New and Emerging
Neuroimaging Techniques
Throughout this volume, the individual chapters are
replete with descriptions of modern imaging tech-
niques. In several instances, emerging technology has
also been described. In this section, I attempt to pro-
vide an overview of the emerging imaging techniques
and how they might influence the field.
Spiral Computed Tomography
Within the realm of structural neuroimaging, spiral
computed tomography (CT) represents an innovation
that allows high-quality CT images to be obtained with
shorter acquisition times. In conventional CT, slices are
acquired one at a time as the X-ray beam source makes
one full revolution around the body. With spiral CT,
multiple slices are acquired with each revolution of the
X-ray beam source as the body is advanced through the
bore of the gantry. Hence, as the name suggests, the X-
ray beam follows a spiral pattern in relation to the body.
Essentially, innovations in hardware and image analysis
support this new modality by providing high-quality
reconstructions despite more limited sampling. Shorter
acquisition time may be of particular relevance in psy-
chiatry; to the extent that patients with disturbed mental
status (e.g., agitation, psychosis) may have difficulty co-
operating with or remaining still during scanning pro-
cedures, rapid image acquisition is of great benefit. Fur-
thermore, spiral CT enables extension of conventional
CT applications to include CT fluoroscopy. Although
130 ESSENTIALS OF NEUROIMAGING FOR CLINICAL PRACTICE
CT fluoroscopy is not of immediate relevance to psychi-
atry, the trend toward improved temporal resolution
and the potential for functional applications with CT
may herald future psychiatric applications in this do-
main as well. It should be kept in mind that the earliest
functional magnetic resonance imaging (MRI) methods
entailed the use of contrast in conjunction with struc-
tural MRI at sufficient temporal resolution to visualize
correlates of blood flow as an index of brain function.
Diffusion Imaging
Diffusion imaging refers to a family of MRI-based tech-
niques that have the capacity to measure indices re-
flecting the diffusion of water within brain tissue. One
type of diffusion imaging, called either diffusion tensor
imaging (DTI) or diffusion tensor MRI (DT-MRI), ex-
ploits the fact that water molecules diffuse at different
rates and in different directions, depending on the ori-
entation of fiber bundles. More specifically, water dif-
fuses more readily in parallel to the orientation of fiber
bundles and less readily perpendicular to the orienta-
tion of fiber bundles. Consequently, using DT-MRI
methods, researchers are now able to map the orien-
tation of white matter tracts in vivo. Although still in
its infancy, this method promises to be very powerful
for delineating white matter abnormalities in psychiat-
ric and neurological disorders, as well as in neurosur-
gical contexts. DT-MRI is especially promising as a tool
for investigating what might be abnormalities of con-
nectivity among brain regions. For developmental
neuropsychiatric disorders, such techniques may re-
veal abnormalities that provide a substrate for imag-
ing-based diagnostic procedures in psychiatry.
Diffusion-weighted imaging (DWI) can also pro-
vide information that is relevant to the viability of
brain tissue, because certain pathological processes al-
ter the local diffusion constant. DWI has recently been
shown to reveal loci of acute and evolving stroke. This
represents an innovation with tremendous potential
ramifications for clinical neurology and psychiatry. Al-
though conventional MRI and CT have long provided
means for assessing infarcts that are several days old,
DWI now enables clinicians to visualize strokes in evo-
lution or only several hours old.
Magnetoencephalography,
Electroencephalography,
and Functional MRI
Magnetoencephalography (MEG) exploits the mag-
netic influence of electrical transmission within the
brain to measure indices of brain activity at high tem-
poral resolution. MEG has several limitations and at
present is primarily reserved for research applications.
For instance, MEG is sensitive only to brain activity
near the surface. Furthermore, until recently, spatial
localization with MEG was quite poor. However, new
advances combining MEG with functional MRI (fMRI)
have led to a capacity for visualizing surface brain ac-
tivity with excellent temporal resolution (by MEG) and
superior spatial localization (thanks to data from fMRI).
Analogous strategies have also been used to combine
data from electroencephalography (EEG) and fMRI.
Use of such techniques opens the door to an entirely
new brand of functional imaging in which movies,
rather than still pictures, can be produced to illustrate
regional cortical activity in real time. It is the hope of
investigators that these temporo-spatial brain activity
maps will provide unparalleled power for character-
izing cortical brain activity patterns—adding the di-
mension of time to the three dimensions of space. Thus,
MEG (or EEG), together with fMRI, might enable a
much richer data set upon which to base discrimina-
tions among psychiatric, neurological, and medical
conditions. Therefore, these new techniques represent
a very promising potential for future advances in im-
aging-based diagnosis in psychiatry.
Optical Imaging
Optical imaging relies on the physical properties of
light and its interaction with the brain and cerebral
vasculature to create images of brain structure or func-
tion. Among the wide array of new and emerging opti-
cal imaging methods, so-called near-infrared spectros-
copy (NIRS) and diffuse optical tomography (DOT) are
of particular relevance to psychiatry. NIRS and DOT
allow noninvasive in vivo measurement of regional
brain activation by means of transmission of light.
Somewhat analogous to concepts that enabled the ad-
vent of noncontrast fMRI, functional optical imaging
relies on differences in the light-absorbing properties
of oxyhemoglobin and deoxyhemoglobin to character-
ize regional brain activation. In fact, whereas fMRI in-
directly measures changes in deoxyhemoglobin, NIRS
is capable of separately quantifying these two hemo-
globin species. NIRS is comparable in sensitivity to
fMRI and actually has several advantages over other
functional imaging modalities: low cost, potential for
portability, and—given that neither ionizing radiation
nor a high magnetic field environment are required—
minimal risks or contraindications. The principal dis-
advantages of NIRS in comparison with fMRI include
Neuroimaging in Psychiatric Practice 131
shallow penetration depth and absence of a tandem
capacity to characterize brain structure for anatomic
reference. It should be noted that this is a very active
area of research; optical imaging methods may also be
refined to provide techniques for absolute quantifica-
tion of neuronal metabolism as well as hemodynamic
changes. Practically, there is great excitement about op-
tical imaging in psychiatry, because it promises to en-
able in vivo studies of central nervous system activity
in infants and very young children that might other-
wise be impossible. Furthermore, because of optical
imaging’s portability and tolerance of subject move-
ment, in situ studies of plasticity, such as during learn-
ing and/or rehabilitation, and the capturing of events
in their natural settings, such as the tics of Tourette’s
disorder or interventions such as exposure therapy,
will become feasible. Finally, there is interest in devel-
oping these techniques to enable low-cost, portable
brain imaging in the context of space travel and other
special circumstances, such as in emergency response
vehicles.
Summary of New Imaging Techniques
Together, these new techniques offer a revolutionary
array of methods for investigating and characterizing
brain structure and function. Ultimately, it is an empir-
ical matter as to which of these will provide clinically
useful information to aid with diagnosis and/or treat-
ment of psychiatric conditions. Judging from recent
work in the field, it is reasonable to predict that valu-
able contributions to our understanding of psychiatric
disease and its pathophysiology will follow from inte-
grating these various approaches in a complementary
or synergistic manner. In the next section, I shift to con-
sider how currently available imaging methods can be
applied to support future advances in psychiatry.
New Applications of Existing
Imaging Techniques in
Psychiatry
Psychiatric neuroimaging research is still a relatively
new field. Hence, investigators in this arena are still
discovering and refining new strategies for applying
neuroimaging tools. “Translational research” refers to
the body of studies designed to translate more basic
scientific information into a form that can be used in
clinical practice. In the case of psychiatric neuroimag-
ing, there are now several strategies that allow investi-
gators to begin bridging the gap between research and
clinical practice. In this section, I discuss emerging
strategies for applying contemporary imaging tools to
enhance diagnosis and treatment selection in psychiatry.
Enhanced Diagnosis and
Extended Phenotypes
Conventional structural neuroimaging techniques
have long been used in psychiatric practice to rule in or
rule out general medical causes of disturbed mental
status. However, the field continues to await legitimate
and established applications to guide clinical assess-
ment of patients with psychiatric disorders. Here it is
instructive to reflect upon the fundamental purpose of
diagnosis in clinical medicine. In general, diagnostic
schemes are designed to serve an organizing function,
to furnish a basis for explanations, and to provide pre-
dictive information about natural course as well as
response to various treatments. Armed with such in-
formation, patients and their families, along with their
doctors, can be informed about what to expect and can
also obtain guidance with respect to which courses of
action—including selection of treatments—will pro-
duce which outcomes.
One of the great problems in psychiatry, unlike
many other subspecialties of medicine, is that the diag-
nostic scheme currently established in our field is not
well grounded in known pathophysiology, principally
because the pathophysiology of psychiatric disorders
is not yet understood. Consequently, in contrast to the
medical model, psychiatry’s current diagnostic entities
are syndromes (i.e., characteristic constellations of
signs and symptoms) rather than diseases per se (i.e.,
conditions reflecting a specific pathophysiological or
disease process). In fact, one of the important chal-
lenges facing psychiatry today is to refine our diagnos-
tic scheme so that it better reflects underlying patho-
physiology.
The science of developing and improving diagnos-
tic tests in medicine relies on the existence of a “gold
standard” method for determining diagnosis in the
first place. This fact underscores the limitation we face
in psychiatry, where we lack a pathophysiology-based
nosology. For us, the current gold standard of a clinical
diagnosis cannot serve as the basis for judging the ab-
solute quality of diagnostic information from other
sources, such as neuroimaging or genetics, if we sus-
pect that these more direct measures of pathophysiol-
ogy will ultimately constitute the gold standard.
132 ESSENTIALS OF NEUROIMAGING FOR CLINICAL PRACTICE
Predictive validity is one yardstick that can be used
to measure even a gold standard method of diagnosis.
In fact, early diagnosis—before an individual develops
all of the signs and symptoms of a condition—can be of
great clinical value. In Alzheimer’s disease (AD), for in-
stance, there has been great interest in developing a
means for early diagnosis so that treatments designed
to slow the progression of the disease can be initiated as
early as possible. In the case of AD, methods have been
developed for combining data from many sources to
make the diagnosis with high specificity and sensitivity
before the full constellation of clinical signs and symp-
toms have evolved. Some of the most powerful strate-
gies for early diagnosis of AD entail use of data from
functional and structural neuroimaging tests in con-
junction with neuropsychological data. But how do
clinical investigators in this area determine the accu-
racy of such predictive diagnoses? Each patient must be
followed longitudinally 1) to determine how the clinical
signs and symptoms evolve over successive years of life
and 2) to examine the neuropathological profile within
the brain after death. Thus, in the case of AD, whereas
the syndrome as defined by clinical assessment serves
as a short-term gold standard, the fact that this disease
has a defining appearance by neuropathological exam-
ination at autopsy provides an ultimate gold standard.
In the case of primary psychiatric disorders, there
are several areas in which we might envision develop-
ing neuroimaging tests of early diagnosis that could be
of substantial clinical value. For example, it might be
useful at presentation of schizotypal traits to be able to
predict which subjects would progress to schizophre-
nia. Likewise, it would be useful to be able to assess pa-
tients at the time of an initial major depressive episode
to accurately predict which ones were at increased vul-
nerability for future manic episodes (i.e., distinguish-
ing unipolar from bipolar disease). This direction of
psychiatric neuroimaging research may have great po-
tential but has remained largely unexplored to date.
The idea of being able to test children to determine
their vulnerability to development of various disorders
later in life is somewhat more controversial.
In fact, many investigators believe that the best pre-
dictors of natural course in psychiatry will entail the
combination of genetic and neuroimaging information.
After all, it is likely that neuroimaging data provide the
most direct and comprehensive information regarding
the anatomic, chemical, and physiological state of the
human brain in vivo. Moreover, by using various chal-
lenge paradigms (e.g., pharmacological and cognitive
challenges) dynamic aspects of these functions can be
ascertained across various contexts. In a complemen-
tary fashion, an individual’s genotype provides the ul-
timate information regarding his or her intrinsic pro-
grammed vulnerabilities as well as resilience factors.
Interestingly, advances in psychiatric genetics re-
quire refined definitions of phenotypes: “phenotype”
refers to the external appearance, clinical presentation,
or net outward manifestation of the genotype. So-
called extended phenotypes (or endophenotypes) refer
to the concept of using internal anatomic or physiolog-
ical measures (e.g., brain-imaging profiles) to define
the phenotype.
In the future, it is anticipated that use of multimodal
imaging techniques—perhaps in conjunction with
other indices, such as genetic assessments—will lead to
early diagnosis of psychiatric conditions or associated
risk factors. In an iterative manner, identifying specific
brain-imaging profiles that predict the natural course of
illness will facilitate the development of a pathophysi-
ology-based diagnostic scheme in psychiatry. Further-
more, by providing extended phenotypes, brain imag-
ing will help advance psychiatric genetics.
Predictors of Treatment Response
Beyond enhanced diagnosis and predictors of natural
course, brain-imaging profiles can also be used to pre-
dict treatment response. There is already a growing lit-
erature describing results of initial longitudinal studies
that have identified possible predictors of response to
various treatments for psychiatric diseases. The typical
paradigm entails gathering brain-imaging data from a
group of subjects prior to their entry into a treatment
trial. At the end of the treatment trial, once the subjects’
respective outcomes are known, these measures of re-
sponse can be correlated with aspects of the pretreat-
ment brain-imaging profile. Thus, investigators are
able to identify which characteristics within the pre-
treatment brain-imaging profile predict subsequent
good or poor outcome in response to the specific treat-
ment. This application of neuroimaging in psychiatry
is an exciting one, as it promises a means for predict-
ing, for a given patient, the likelihood of a good or poor
response to any of a range of possible treatments. In
this way, we can envision neuroimaging tests to guide
selection among psychiatric treatments. Although such
tests may rarely be cost-effective for choosing between
medications or psychotherapies, one could imagine
them being of great clinical value when considering
treatments of relatively higher risk or higher cost, such
as electroconvulsive therapy or neurosurgery.
Neuroimaging in Psychiatric Practice 133
Neurochemical Methods to
Monitor Treatment
Neurochemical imaging techniques provide methods
for monitoring treatment, especially with regard to psy-
chotropic medications. Already, magnetic resonance
spectroscopy (MRS) has been used to measure the cere-
bral concentration of specific MRS-visible medications,
such as lithium or fluoxetine. It has become clear that
for some patients, relatively low or relatively high brain
concentrations of medication are achieved with stan-
dard dosages. In the future, such tests of chemical con-
centrations within the brain may be helpful in titrating
dosages of psychotropic medications. Furthermore, it
may ultimately become possible to target specific brain
regions for enhanced concentration or activity of medi-
cations—for example, by causing regional changes in
blood–brain barrier permeability or by administering
precursor medications that require activation in situ.
Similarly, receptor characterization studies—consisting
of positron emission tomography (PET) or single pho-
ton emission computed tomography (SPECT) in con-
junction with radioactively labeled tracers—can be
used to characterize receptor affinity, density/number,
and occupancy. Such methods may become clinically
useful in identifying whether a given patient is receiv-
ing a sufficient dosage of a medication.
Summary of New Applications of
Existing Imaging Techniques
New paradigms incorporating existing imaging meth-
ods promise to advance the development of our diag-
nostic scheme in psychiatry. Furthermore, neuroim-
aging methods will progressively be applied to make
early diagnoses and to predict the natural course of
psychiatric disease. Finally, neuroimaging tools may
soon be used in the clinical setting to predict treatment
response as well as monitor treatment to optimize ther-
apy for psychiatric patients.
Development of New
Treatments Guided by
Neuroimaging
New Psychotropic Agents
Though many of the classic psychotropic agents were
serendipitously found to be effective as treatments for
psychiatric disorders, we are now in an age in which
new psychiatric drug development is proceeding more
systematically and rationally. As candidate medica-
tions are synthesized or discovered, several crucial
steps must be taken before progressing to large-scale
studies of efficacy in humans. Following animal stud-
ies of safety, pharmacokinetics, and pharmacological
effects, it is often useful to characterize the pharmaco-
kinetics and pharmacodynamics of these agents in hu-
man subjects. In fact, functional imaging techniques
(e.g., PET) can be used to quantify the distribution of
radiolabeled forms of these compounds throughout
the body. For certain agents that may disproportion-
ately collect in specific organs, drug distribution be-
comes a critically important consideration with respect
to possible toxicities. Also, by using radiolabeled forms
of the candidate compound, investigators are able to
quantify its regional distribution within the brain as
well as its binding profile in situ. Alternatively, investi-
gators sometimes use specific well-characterized radi-
olabeled tracers in conjunction with unlabeled forms of
candidate medications to indirectly measure the effects
of the candidate agent (i.e., by measuring how the can-
didate agent “competes” with the well-understood
compound for binding to receptor sites). This indirect
strategy is used in cases where it might be difficult to
radioactively label the candidate medication or when
there is concern that the labeling process might alter
the pharmacological action of the candidate medica-
tion. Perhaps surprisingly, in vitro studies of binding
properties often yield only poor approximations of
how such candidate medications actually behave in the
brains of living, breathing humans. Hence, these in
vivo brain-imaging methods have become a very im-
portant and valuable part of the drug discovery pro-
cess, particularly for medications that target the central
nervous system.
Advances in Neurosurgical Treatment
and Brain Stimulation
Neurosurgical treatment for psychiatric diseases has a
long and controversial history. Since the 1980s, there
have been important advances in this field, in terms of
both the surgical methods applied and the systematic
manner in which clinical data have been collected. Ex-
tant data now indicate that several of these procedures
have modest efficacy and acceptable risks for the treat-
ment of individuals with severe, otherwise treatment-
refractory obsessive-compulsive disorder (OCD) or
major depression. Currently, the best-studied and best-
134 ESSENTIALS OF NEUROIMAGING FOR CLINICAL PRACTICE
accepted operations are anterior cingulotomy, anterior
capsulotomy, and limbic leucotomy. The advent of ste-
reotactic functional neurosurgery helped to refine the
reliability of lesion placement. Likewise, the advent of
radiosurgical methods, with the gamma knife, led to
investigation of ablative procedures (i.e., anterior cap-
sulotomy) performed without the need for craniotomy.
Finally, ongoing research, still in an early stage, is being
conducted to investigate the application of deep brain
stimulation (DBS) as a treatment for OCD or depres-
sion. In comparison with ablative procedures, DBS of-
fers the obvious advantages of more flexibility and re-
versibility.
In several respects, neuroimaging plays an impor-
tant role in this area. First, structural MRI is used to
plan and confirm the placement of lesions (in the case
of the ablative procedures) or the stimulation elec-
trodes (in the case of DBS). Second, investigators have
begun to conduct neuroimaging studies to identify pre-
dictors of treatment response and also to establish the
structural and functional consequences of these proce-
dures. Pretreatment imaging data paired with acute
postoperative and long-term follow-up imaging data
can be used to explore the changes associated with ef-
fective versus ineffective interventions. In this way, it is
hoped that knowledge will be gained about the mech-
anism of action by which these treatments exert their
effects—both beneficial and adverse.
Third, there is much interest in the idea of using im-
aging data to tailor the specific application of these
methods to individual patients. For example, in the
case of DBS, functional brain-imaging data gathered
during acute stimulation, using various stimulation
parameters, might one day be used to guide clinicians
in selecting treatment settings. Likewise, in the case of
ablative neurosurgical treatments, it is conceivable that
the precise lesion site could be individually tailored on
the basis of results from a presurgical functional imag-
ing test.
In addition to surgical interventions, including ab-
lative procedures and DBS, the technique of transcra-
nial magnetic stimulation (TMS) provides a means for
relatively noninvasive regional brain stimulation. In-
vestigators have recently begun to explore potential
clinical applications of TMS in the treatment of OCD
and depression. More generally, it is appealing to con-
sider that manipulation of focal brain activity may offer
a way to treat some psychiatric diseases. In its current
form, TMS can be used to facilitate or inhibit regional
cortical activity. Consequently, one might imagine that
TMS would be a potential treatment for psychiatric
disorders with known regional cortical dysfunction.
Much as in the case of surgical treatments, imaging
may conceivably play a role in TMS-based therapies by
enabling 1) enhanced placement to match a specific
targeted location, 2) prediction of treatment response,
and 3) individual tailoring of treatment through provi-
sion of a) pretreatment guidance regarding optimal tar-
geting and b) ongoing information to optimize stimula-
tion parameters on the basis of the individual’s brain
response.
Conclusions
The future of psychiatric neuroimaging is bright. In ad-
dition to having a continuing tremendous role in psy-
chiatric research, neuroimaging is likely to progres-
sively play a prominent role in the clinical psychiatric
setting. New imaging techniques will expand the range
of parameters we can measure while extending the
boundaries of temporal and spatial resolution and
overcoming other obstacles. It is plausible that the near
future will see us able to quantitatively assess numer-
ous indices of brain structure, function, and chemistry
in real time, safely, in patients of essentially any age,
while awake and, in some instances, freely moving.
The new gamut of imaging technologies combined
with innovative paradigms will soon support advances
toward early diagnosis and predictors of both natural
illness course and treatment response. As neuroimag-
ing and genetic research progress in parallel, it is likely
that we will witness an evolution of the psychiatric di-
agnostic scheme toward one that is better grounded in
the pathophysiological basis of disease. Finally, psychi-
atric neuroimaging techniques will play a central role
in the development of new and better treatments. This
will include a role in the process of drug development
and also in the fields of neurosurgical treatment and
brain stimulation. These capabilities promise to revolu-
tionize the practice of psychiatry during the current
century.
Suggested Readings
Bonmassar G, Schwartz DP, Liu AK, et al: Spatiotemporal
brain imaging of visual-evoked activity using interleaved
EEG and fMRI recordings. Neuroimage 13:1035–1043, 2001
Cosyns P, Gabriels L, Nuttin B: Deep brain stimulation in se-
vere treatment refractory OCD. Eur Psychiatry 17 (suppl 1):
31–32, 2002