The financial numbers game detecting creative accounting practices phần 9 doc
Bạn đang xem bản rút gọn của tài liệu. Xem và tải ngay bản đầy đủ của tài liệu tại đây (350.49 KB, 41 trang )
317
CHAPTER TEN
Getting Creative with the Income
Statement: Pro-Forma Measures
of Earnings
Pro forma information is a tool that companies have invented to
disseminate an idealized version of their performance. It may exclude
any cost or expense the company wants, yet it is presented in a form
that suggests reliability and soundness.
1
Cash flow, by the way, is not EBITDA. EBITDA is the biggest joke of
the 1990s.
2
Are GAAP net earnings on the endangered species list? Pro forma
per-share figures in earnings announcements, a number derived after
removing an expanding list of items and sometimes real cash
expenses, seem to be crowding out traditional net earnings in many
industries.
3
Operating income is often more important to investors than net
income, and widely regarded as an indicator of how well management
is running the shop.
4
The previous chapter laid out the GAAP requirements surrounding the income statement
and also outlined how the financial numbers game could be played by creative classifi-
cations within the GAAP-basis income statement. Pro-forma creativity develops mea-
sures of financial performance that employ GAAP information, but they are decidedly
non-GAAP measures. A common justification for one such pro-forma measure (sustain-
able or core earnings) is illustrated by this statement from the Corning, Inc. annual report:
Corning believes comparing its operating results excluding non-recurring items, a measure
that is not in accordance with generally accepted accounting principles (GAAP) and may
318
not be consistent with measures used by other companies, provides a better understanding
of the changes in its operating results.
5
Corning’s pro-forma measure is GAAP net income adjusted for the effects of a num-
ber of charges and gains that it judged to be nonrecurring. In practice, it is common to dis-
cuss results after the exclusion of selected nonrecurring items. Corning simply refers to
this pro-forma measure as “operating results excluding non-recurring items.” By adjust-
ing only for nonrecurring items, the scope of Corning’s restatement is rather limited. The
range of adjustments made to GAAP net income is greater in the case of some of the other
pro-forma measures of performance. These measures often adjust GAAP earnings for
noncash items as well as selected recurring and nonrecurring items of revenue, gain,
expense, and loss. However, they all share a common feature: They employ GAAP-based
information in the creation of alternative, non-GAAP measures of performance.
The first two of the chapter-opening quotes are clearly critical of pro-forma measures
of financial performance. Lynn Turner, chief accountant of the Corporation Finance
Division of the SEC, has characterized some of these measures by referring to them as
EBBS, or “earnings before the bad stuff.”
6
Such criticisms have led the Financial Exec-
utives International (FEI), an organization made up mainly of company financial offi-
cers, and The National Investor Relations (NIRI) Institute to release “best practice”
guidelines for firms that release pro-forma measures of financial performance in earn-
ings press releases.
7
A key feature of these recommendations is found in the following:
GAAP results provide a critical framework for pro-forma results, although the pro-forma
results may be more analytically useful. The order in which reported or pro-forma results
are presented in the release is not as important as their context. Pro-forma results should
always be accompanied by a clearly described reconciliation to GAAP results; this recon-
ciliation is often provided in tabular form.
8
The FEI/NIRI guidelines do not explicitly criticize pro-forma measures of financial
performance. However, the absence of their recommended reconciliation of the pro-
forma to GAAP numbers represents a clear weakness in most of the current presentations
of pro-forma data.
This chapter builds on the discussion in Chapter 9 and presents a review and analysis
of pro-forma measures of financial performance. The computation of these pro-forma
measures is considered along with their motivation, characterization, and disclosure.
Their role in the financial numbers game is also explored.
RECASTING THE BOTTOM LINE: PRO-FORMA EARNINGS MEASURES
Adaptations of net income are generically referred to as pro-forma earnings.
9
Other
labels include EBITDA (earnings before interest, taxes, depreciation, and amortization),
sustainable earnings, core earnings, and operating earnings.
10
The Random House
Unabridged Dictionary of the English Language provides an accounting-oriented defi-
nition of “pro-forma”:
T
HE
F
INANCIAL
N
UMBERS
G
AME
319
Indicating hypothetical financial figures based on previous business operations for estimate
purposes.
11
Some pro-forma earnings numbers are quite consistent with the Random House def-
inition of pro-forma. This is especially true when pro-forma earnings have been devel-
oped, at least in part, to provide a better baseline for forecasting earnings. This is often
the case when net income is adjusted so as to eliminate the effects of nonrecurring items.
It is less true in cases where adjustments to reported net income are designed to derive a
joint cash flow and sustainable earnings measure. Pro-forma earnings typically involve
adjustments to net income for items that are either noncash or nonrecurring or both.
The two most common pro-forma numbers, which fall within the spirit of income
statement creativity, are (1) earnings before interest, taxes, depreciation, and amortiza-
tion (EBITDA) and (2) adjusted or sustainable earnings. EBITDA is well known and
widely used in the business and financial community. It is also common for sustainable
earnings to be labeled adjusted earnings. Whether called adjusted or sustainable earn-
ings, the exclusion of nonrecurring items is the key feature of these measures.
Earnings before Interest, Taxes, Depreciation, and Amortization
EBITDA represents part of a movement up the income statement from the bottom line.
EBITDA is predated by and probably evolved from earnings before interest and taxes
(EBIT). EBIT is positioned farther down the income statement, below the point at which
depreciation and amortization would have been deducted. EBIT is one of the early
income statement adaptations. It is designed mainly to gauge the extent to which fixed
charges are covered by earnings.
12
EBIT has been a common financial covenant in debt
and other credit agreements for decades.
EBITDA has a shorter history, with its widespread use extending back only into the
early 1980s. EBITDA was used early on in leveraged buyouts (LBOs) on the premise
that there would be no replacement of fixed assets until later while the LBO company
was run and debt was serviced. It has long been common to require firms to maintain a
specified minimum EBIT coverage ratio as part of a debt or credit agreement. As inter-
est is deductible before the computation of income taxes, it is logical to add back both
income taxes as well as interest. In more recent years, it has become even more common
for fixed-charge and debt-limit covenants to be based on EBITDA.
13
While the mea-
surement of EBITDA would seem to be dictated by the underlying words, in practice the
measurement of EBITDA is often more extensive. Frequently a variety of adjustments
are made beyond simply those for interest, taxes, depreciation, and amortization.
Measurement of EBITDA
As noted, it is common for firms to measure EBITDA by including additional adjust-
ments. In this sense, most measures of EBITDA should be viewed as adjusted EBITDA,
a term that is sometimes used to describe expanded measures of EBITDA. A review of
some of the additional adjustments made in arriving at adjusted EBITDA provides addi-
tional insight into the character of this alternative measure of financial performance.
Getting Creative with the Income Statement: Pro-Forma Measures of Earnings
TEAMFLY
Team-Fly
®
TEAMFLY
Team-Fly
®
320
The process of moving up from the bottom line of the income statement and selec-
tively jettisoning items of revenue, gain, expense, and loss is an exercise in income
statement creativity. Exhibit 10.1 contains examples of some of the additional adjust-
ments made to arrive at EBITDA. It is far more common to observe items of loss or
T
HE
F
INANCIAL
N
UMBERS
G
AME
Exhibit 10.1 EBITDA Adjustment Items
Company EBITDA Adjustments
ACG Holdings, Inc. (1998) EBITDA is defined as earnings before interest
expense, income taxes, depreciation,
amortization, other special charges related to
asset write-offs and write-downs, other income
(expense), discontinued operations and
extraordinary items.
Boca Resorts, Inc. (1998) Adjusted EBITDA represents EBITDA plus the
annual change in Premier Club net deferred
income.
The Carbide/Graphite Group, Inc. EBITDA is defined as operating income before
(1999) depreciation and amortization, early
retirement/severance charges, and other expense.
Coast Resorts, Inc. (1999) EBITDA means earnings before interest, taxes,
depreciation, amortization, deferred (noncash)
rent expense and certain nonrecurring items,
including preopening expenses.
Lifestyle Furnishings International, Adjusted EBITDA for 1998 excludes transition
Ltd. (1999) costs related to the restructuring and
reengineering initiative costs related to the
development and implementation of year 2000
compliance costs related to computer system
implementation.
News Communications, Inc. (1999) EBITDA, excluding three one-time expenses:
hiring costs associated with a new president, an
increase in the reserve for uncollected
receivables, and an adjustment to the accrual for
unpaid commissions.
Sunrise Medical, Inc. (1998) EBITDA excludes reengineering expenses,
merger costs, and unusual items.
Teletouch Communications, Inc. EBITDA for fiscal 1998 excludes the gain on
(1998) sale of assets.
Sources: Companies’ annual reports. The year following each company name designates the annual
report from which each example was drawn. Information obtained from Disclosure, Inc., Compact
D/SEC: Corporate Information on Public Companies Filing with the SEC (Bethesda, MD:
Disclosure, Inc., June 2000).
321
expense as opposed to revenue or gain being adjusted from net income to arrive at
EBITDA. This may simply reflect the fact that the former items tend to be more numer-
ous. Beyond this, one or more of three characteristics are typically associated with the
additional adjustments: (1) nonrecurring, (2) noncash, and (3) nonoperating.
An examination of the entries in the exhibit reveals a mix of adjustments that reflect
one or more of the above characteristics. The motivation for adding back depreciation
and amortization is usually its noncash character. Alternatively, it sometimes reflects the
sentiment that depreciation and the amortization of intangibles are not real expenses.
That is, in spite of the traditional GAAP requirement to depreciate fixed assets and to
amortize intangibles, many feel that these assets often do not decline in value and that
over time they actually may appreciate in value.
An example of the rejection of depreciation is found in the measure used to judge the
financial performance of real estate firms, especially real estate investment trusts
(REITs). Depreciation is added back to net income, along with adjustments for other
selected nonrecurring items, to arrive at a pro-forma measure termed funds from opera-
tions (FFO). The case for rejecting depreciation in measuring financial performance is
illustrated by the next excerpt from a document that supports adding real estate depreci-
ation back to the earnings of REITs:
GAAP historical cost depreciation of real estate assets is generally not correlated with
changes in the value of those assets, whose value does not diminish predictably over time,
as historical cost depreciation implies. For this reason, comparisons of the operating results
of REITs that rely on net income have been less than satisfactory.
14
Similar arguments have been made in the case of some intangible assets. Goodwill is
a common example. Interestingly, a new standard issued by the Financial Accounting
Standards Board no longer requires the routine amortization of goodwill. Rather, good-
will will be written down only if it is judged to be impaired.
14a
Interest and taxes are the standard add-backs to develop measures for determining the
coverage of fixed charges. Additional adjustments for the growth in deferred income by
Boca Resorts, Inc., and of deferred rent by Coast Resorts, Inc., reflect the cash-flow
dimension of EBITDA. That is, the growth in these balances represents an inflow of cash
that has not yet been included in net income (Boca Resorts) and an expense that has not
yet required a cash outflow (Coast Resorts). Hence, these increases are added to net
income in order to produce a measure that is closer to cash flow.
The adjustments for write-offs (ACG Holdings, Inc.), severance charges (The Carbide/
Graphite Group, Inc.), certain nonrecurring items (Coast Resorts), transition costs
(Lifestyle Furnishings International, Inc.), adjustments to the accrual for commissions
(News Communications, Inc.), and gain on sale of assets (Teletouch Communications,
Inc.), are all consistent with developing a measure of sustainable financial performance.
The adjustments for some of the nonrecurring items, for example, other income and
other expenses, reflects the effort to develop a measure that is based on operating items.
The determination of what items should be adjusted out of EBITDA, where the key
consideration is their nonrecurring character, is difficult. Nonrecurring items are not
specifically defined under GAAP.
Getting Creative with the Income Statement: Pro-Forma Measures of Earnings
322
It is common for EBITDA measures to be developed with additional adjustments for
nonrecurring and nonoperating revenue, gains, expenses, and losses. These all entail the
exercise of considerable judgment. A strict version of EBITDA requires the exercise of
little or no judgment. However, the dominance of adjusted EBITDA measures means
that there is abundant room for the exercise of creativity. This also means that it is very
difficult to compare EBITDA performance among different firms. Doing so is somewhat
akin to trying to compare the weights of different people when they all make a number
of unique adjustments to their scales. There is a clear problem with the comparability of
EBITDA measures among firms.
Comparability of EBITDA among Firms
EBITDA combines adjustments for noncash, nonrecurring, and nonoperating items in an
effort to create a revised measure that is a combined operating cash flow and sustainable
earnings statistic. The adjustments that are prompted by the noncash feature are reason-
ably nonjudgmental.
15
However, the specification of nonrecurring items for adjustment
introduces the potential for the creation of EBITDA measures that are not comparable
between different firms. This potential for a lack of comparability among firms is cited
frequently in discussions of EBITDA disclosures. The following commentary is typical:
All companies do not calculate EBITDA in the same manner. As a result, EBITDA as pre-
sented here may not be comparable to the similarly titled measure presented by other com-
panies.
16
Our calculation of EBITDA may be different from the calculation used by other com-
panies and, therefore, comparability may be limited.
17
It is worth noting that the lack of comparability introduced by adjusted EBITDA
measures simply adds to the lack of comparability that already exists due to differences
among firms in accounting policies followed as well as variations in accounting esti-
mates. Also, the judgments that go into the computation of EBITDA affect both interyear
and interfirm comparability. That is, EBITDA may be measured differently among firms
as well as differently by individual firms across different years.
Company Characterizations of EBITDA
The characterizations of EBITDA provided by companies help to clarify some of the
motivations for the creation of this measure. Some examples of EBITDA characteriza-
tions are provided in Exhibit 10.2. The information in the exhibit as well as the results
of a review of about 200 companies was used to identify a number of recurring themes
in these EBITDA characterizations. EBITDA is held to be:
• Useful in evaluating operating performance
• Helpful in judging the ability to meet future cash requirements
• Useful as a measure of operating cash flow
• Helpful in evaluating financial condition, results of operations, and cash flow
T
HE
F
INANCIAL
N
UMBERS
G
AME
323
Getting Creative with the Income Statement: Pro-Forma Measures of Earnings
Exhibit 10.2 Characterizations of EBITDA
Company Characterization of EBITDA
Ameriking, Inc. (1999) EBITDA is included to provide additional
information with respect to the ability of the
Company to meet its future debt service, capital
expenditure and working capital requirements.
The Carbide/Graphite Group, Inc. Management believes that EBITDA is an
(1999) appropriate measure of the Company’s ability to
service its cash requirements. EBITDA is an
important measure in assessing the performance of
the business segments.
Lightbridge, Inc. (1999) Lightbridge considers EBITDA to be meaningful
given the impact on operating income from non-
cash expenses.
Metro Goldwyn Mayer, Inc. (1999) Management considers EBITDA to be an
important measure of comparative operating
performance. It should be considered in addition
to, but not as a substitute for or superior to,
operating income, net earnings, cash flow and
other GAAP measures. The items excluded from
EBITDA are significant components in assessing
financial performance.
News Communications, Inc. (1999) EBITDA is used in this report because
management believes that it is an effective way of
monitoring our operating performance and is
widely used among media related businesses.
Niagara Mohawk, Inc. (1999) EBITDA is a non-GAAP measure of cash flows
and is presented to provide additional information
about Niagara Mohawks’ ability to meet its future
requirements for debt service.
Stimsonite Corp. (1998) EBITDA, a measure of operating cash flow,
increased to $16.1 million from $14.3 million in
1997.
Note: The above entries are abridgements of the actual language used by the listed companies.
Sources: Companies’ annual reports. The year following each company name designates the annual
report from which each example was drawn. Information obtained from Disclosure, Inc., Compact
D/SEC: Corporate Information on Public Companies Filing with the SEC (Bethesda, MD:
Disclosure, Inc., June 2000).
324
• Widely accepted as an indicator of funds available to service debt
• Useful in measuring operating performance, liquidity, and leverage
EBITDA as a measure of cash flow is one of the more common themes. It is obviously
not a GAAP measure of cash flow, and companies often make this point as part of an
effort to distinguish EBITDA from GAAP cash-flow measures. Yet, companies repeat-
edly refer to EBITDA as a measure of cash flow, often presenting any qualifying lan-
guage at some other location in the financial statements or notes.
The evaluation of operating performance is another common EBITDA application.
This is clearly facilitated by the adjustments that remove nonrecurring or nonoperating
revenue, gains, expenses, and losses. These adjustments provide better indicators of sus-
tainable performance and better predictors of future results.
18
Because of its prevalence and its representation as a measure of cash flow and oper-
ating performance, it is not surprising to observe EBITDA being employed in financial
covenants found in debit and credit agreements. The problem of comparability can be
dealt with in this setting because the credit agreement can include the specific definition
of EBITDA to be used in measuring compliance with the EBITDA covenant.
Use of EBITDA in Financial Covenants
Financial covenants are used so that lenders and other creditors will have more control
over the likelihood of their ultimate repayment. Financial covenants provide some
capacity to monitor and influence the behavior of the debtor. Exhibit 10.3 provides some
representative uses of EBITDA in financial covenants. The EBITDA-based covenants
are of three types:
1. Coverage covenant: requires a minimum ratio of EBITDA to fixed charges
2. Leverage covenant: permits a maximum ratio of debt to EBITDA
3. Level covenant: requires maintenance of a minimum level of EBITDA
The common use of EBITDA by lenders in financial covenants is evidence that they
find it to be a useful device in helping to monitor their borrowers and to ensure the even-
tual repayment of their funds.
19
While based on GAAP-based income statement data, EBITDA rearranges and
removes certain income statement data in the creative effort to develop alternative mea-
sures of financial performance and cash flows. As a cautionary measure, and with a
nudge from the Securities and Exchange Commission, some companies that include
EBITDA information in their annual reports highlight its non-GAAP character.
Cautionary Comments about Non-GAAP EBITDA Information
EBITDA incorporates only information that is present in the GAAP-basis income state-
ment. Providing cautionary or qualifying commentary in conjunction with EBITDA data
is consistent with SEC guidance.
20
Examples of cautionary or qualifying language are
found in Exhibit 10.4.
T
HE
F
INANCIAL
N
UMBERS
G
AME
325
Despite the many cautionary notes provided about EBITDA, the manner in which it
is presented and characterized implies, contrary to SEC guidance, its superiority to
GAAP-based earnings and cash-flow data.
EBITDA as Income Statement Creativity
EBITDA involves a creative rearrangement of selected income statement data. While the
EBITDA acronym suggests a simple alternative measure developed in a quite mechani-
cal manner, this is usually not the case. Rather, most measures of EBITDA go beyond
the acronym and involve the selective exclusion of GAAP-basis income statement data.
Terms like special charges and nonrecurring items are common labels applied to these
exclusions. However, as noted earlier, these terms are not well defined in practice or in
GAAP. Their identification entails a good deal of judgment, and this results in much
flexibility in developing EBITDA measures. EBITDA is truly a creative income state-
ment-based measure. However, this effort to develop an alternative measure of cash flow
and financial performance brings with it some new problems and continues some old.
Getting Creative with the Income Statement: Pro-Forma Measures of Earnings
Exhibit 10.3 EBITDA-Based Financial Covenants
Company Financial Covenant
ABR Information Services, Inc. (1998) Requires a funded debt-to-EBITDA ratio
maximum of 2.5 to 1
Abercrombie & Fitch Co. (1999) A financial covenant requires a minimum
EBITDAR to interest expense and minimum
rent
Foodarama Supermarkets, Inc. (1999) Requires the maintenance of certain levels of
EBITDA
Marine Drilling Companies, Inc. (1999) Calls for a maximum ratio of debt to EBITDA
of 4 to 1
Packaging Corp. of America (1999) Must not exceed a leverage ratio (indebtedness
divided by EBITDA) of 6.75 at December 31,
1999, decreasing per the guidelines set forth in
the Credit Agreement to 4.00 as of March 31,
2006
Roanoke Electric Steel (1999) Funded debt cannot be greater than 3 times
consolidated EBITDA, and the ratio of
EBITDA to the sum of current maturities of
long-term debt and consolidated interest
expense must equal at least 1.5.
Sources: Companies’ annual reports. The year following each company name designates the annual
report from which each example was drawn. Information obtained from Disclosure, Inc., Compact
D/SEC: Corporate Information on Public Companies Filing with the SEC (Bethesda, MD:
Disclosure, Inc., June 2000).
326
Interfirm Comparability The flexibility associated with the development of EBITDA
results in a lack of interfirm comparability. It is common for EBITDA firms to point out
the comparability issue as part of their EBITDA disclosures.
21
For example, Lightbridge,
Inc., takes the position that EBITDA enhances comparability because it eliminates the
T
HE
F
INANCIAL
N
UMBERS
G
AME
Exhibit 10.4 Qualifying EBITDA
Company Qualifying Language
Browning Ferris Industries, Inc. (1997) EBITDA, which is not a measure of financial
performance under generally accepted
accounting principles, is included because the
company understands that such information is
used by certain investors when analyzing the
company’s financial condition and
performance.
Lifestyle Furnishings, Ltd. (1997) Adjusted EBITDA should not be considered as
an alternative to net income, cash flow from
operations or operating profit as determined by
generally accepted accounting principles, and
does not necessarily indicate that cash flow
will be sufficient to meet cash requirements.
St. Mary Land & Exploration EBITDA is a financial measure commonly
Co. (2000) used for St. Mary’s industry and should not be
considered in isolation or as a substitute for net
income, cash flow provided by operating
activities or other income or cash flow data
prepared in accordance with generally accepted
accounting principles or as a measure of a
company’s profitability or liquidity. Because
EBITDA excludes some, but not all, items that
affect net income and may vary among
companies, the EBITDA presented above may
not be comparable to similarly titled measures
of other companies.
Unidigital, Inc. (1999) EBITDA does not represent and should not be
considered as an alternative to net income or
operating income as determined by generally
accepted accounting principles.
Sources: Companies’ annual reports. The year following each company name designates the annual
report from which each example was drawn. Information obtained from Disclosure, Inc., Compact
D/SEC: Corporate Information on Public Companies Filing with the SEC (Bethesda, MD:
Disclosure, Inc., June 2000). Information on St. Mary Land and Exploration Co. is from its annual
report, December 2000, p. 26.
327
effects of differences in depreciation and amortization policy among telecommunica-
tions companies.
22
American West Holding Corp. makes a similar point:
The Company believes that EBITDAR margin, which is a non-GAAP measurement, is the
best measure of relative airline operating performance. EBITDAR measures operating per-
formance before depreciation and aircraft rentals. By excluding both rentals and deprecia-
tion, differences in the method of financing aircraft acquisitions are eliminated. Cash
earnings are distorted by differences in financing aircraft as depreciation attributable to
owned-aircraft (including those acquired through finance leases) is added back to cash
earnings while operating lease rentals are deducted.
23
A lack of comparability among firms is not a unique weakness of EBITDA. It also
afflicts GAAP-based measures of performance, notably net income. However, the mea-
sure of net income is laid out quite clearly in the income statement. Moreover, the
accounting policies used to develop net income are disclosed. There is usually no com-
parable presentation of the development of EBITDA. Rather, one must simply rely on
statements concerning the measurement or definition of EBITDA, such as those pre-
sented in Exhibit 10.1. Efforts to reproduce disclosed EBITDA numbers from the com-
bination of company definitions and their financial statements can be difficult.
If EBITDA is going to compete with net income, then in the interests of clarity and
transparency a schedule that details the computation of EBITDA should be provided.
Moreover, this information should be presented in the same location with any qualify-
ing commentary or other key EBITDA disclosures.
Pitting EBITDA against Net Income Occasionally the SEC has felt the need to com-
ment on the use by firms of alternatives to GAAP net income and GAAP cash flow from
operating activities. On the matter of earnings, the SEC has declared that “Such mea-
sures [alternatives to GAAP net income] should not be presented in a manner that gives
them greater authority or prominence than conventionally computed earnings.”
24
A review of EBITDA disclosures would suggest that the SEC’s guidance is ignored
on occasion. A study of the presentation of information on EBITDA reveals that it is
often reported ahead of net income. This appears to be most common in the case of the
EBITDA references in the president’s letter to shareholders.
25
A sampling of EBITDA
disclosures in the president’s letter revealed the following average order of presentation
of sales (or revenue), net income, and EBITDA: Revenue, 1.20; EBITDA, 2.20; and Net
Income, 2.30.
26
EBITDA and Net Income are basically tied for being the second measure
of financial performance presented in the president’s letter. However, EBITDA either is
presented before earnings or is presented in cases where earnings are not presented at all
in 25 out of the 40 cases examined. That is, by being presented first, EBITDA is given
greater prominence than earnings, something that the SEC advised against.
The Grubb & Ellis Company’s annual report states:
Fiscal 1998 revenue grew 24 percent to $282.8 million, exceeding our goal of 20 percent
revenue growth. EBITDA, before non-recurring items for fiscal 1998, totaled $19.1 million,
compared with $17.6 million in 1997. Net income was $21.5 million, or $0.98 per share, an
increase over $19.0 million, or $.97 per share, last year.
27
Getting Creative with the Income Statement: Pro-Forma Measures of Earnings
328
The Mindspring Enterprises, Inc., annual report says:
Our revenue increased by 118% to $114,673,000. Our customer base grew by 149% to
693,000. EBITDA increased 365% to $23,013,000. Earnings per share increased 328%
from a loss of $(0.18) per share in 1997 to a profit of $0.41 per diluted share in 1998.
28
Beyond the issue of order of presentation, a further questionable practice involves
reporting EBITDA margins. The most common margin disclosures are of gross mar-
gin—gross profit divided by sales—and net margin—net income divided by sales. Pre-
sentation of EBITDA margins implies that EBITDA is a measure of profitability. It is not
a GAAP profitability measure, and its use in place of GAAP-basis margins would also
seem to be inconsistent with SEC guidance.
EBITDA as Cash Flow It is common for company disclosures to characterize EBITDA
as cash flow. As discussed earlier, EBITDA has aspects of both a cash flow and sus-
tainable earnings measure. Noncash items are added back to earnings, but nonrecurring
items of revenue, gain, expense, and loss are also typical adjustments. Some representa-
tions of EBITDA as cash flow are provided in Exhibit 10.5.
EBITDA is clearly not operating cash flow as it is defined under GAAP. Firms fre-
quently make this point in their EBITDA disclosures. The following is a typical disclo-
sure of the non-GAAP character of EBITDA as a cash-flow measure:
T
HE
F
INANCIAL
N
UMBERS
G
AME
Exhibit 10.5 EBITDA as a Cash Flow Measure
Company Cash Flow Language
Aztar Corp. (1999) In 1999, our consolidated operating cash flow,
as measured by earnings before interest, taxes,
depreciation, amortization and rent
(EBITDAR), grew to $160.6 million.
Brown-Forman Corp. (2000) EBITDA represents a measure of the
company’s cash flow.
Dole Foods Company, Inc. (1999) Cash flow from operations (EBITDA) grew to
$372 million, an increase of 10% over prior
years.
Mandalay Resort Group (1999) Companies frequently refer to operating cash
flow, or EBITDA, as a benchmark of earning
power.
SI Technologies, Inc. (1999) Sales and cash flow, as measured by EBITDA,
increased to record levels.
Sources: Companies’ annual reports. The year following each company name designates the annual
report from which each example was drawn. Information obtained from Disclosure, Inc., Compact
D/SEC: Corporate Information on Public Companies Filing with the SEC (Bethesda, MD:
Disclosure, Inc., June 2000).
329
EBITDA does not represent net income or cash flows from operations as those terms are
defined by generally accepted accounting principles and does not necessarily indicate
whether cash flows will be sufficient to fund cash needs.
29
The addition of depreciation and amortization to net income in computing EBITDA
is typically based on their noncash character. However, in some cases their addition
reflects the view that the underlying assets being depreciated or amortized either will not
require replacement or are not declining in value.
The failure to include working capital requirements and the adding back of both inter-
est expense and taxes are the key differences between EBITDA and cash flow from oper-
ating activities under GAAP.
30
As should be clear by now, EBITDA is a non-GAAP measure, but it is derived from
the GAAP-basis income statement and associated GAAP data. It involves a creative
rearrangement of income statement data. It has become a very popular measure by which
management represents its financial performance. Moreover, it is widely used by
bankers and other providers of debt capital to gauge and monitor the ongoing ability to
service debt.
As financial statistics go, EBITDA is neither fish nor fowl. Rather, it is a blend of
adjustments to GAAP income statement data that produce a blended measure of cash
flow and sustainable earnings. As a measure of cash flow it is incomplete, mainly
because of the failure to include working capital requirements. Moreover, in the typical
case, the adjustments for nonrecurring items are also selective. Comparability becomes
a key weakness of EBITDA as a result of the variability in the adjustments made to net
income in arriving at EBITDA.
A related pro-forma measure, which also employs considerable income statement
creativity, is sustainable earnings. This measure is also referred to as core or adjusted
earnings.
Adjusted or Sustainable Earnings
EBITDA is a non-GAAP, pro-forma financial measure that begins with net income or
loss and then recasts earnings in order to develop an alternative measure of performance.
The adjustments to net income or loss are of three basic types: (1) noncash, (2) nonre-
curring, and (3) nonoperating. Sustainable earnings is an additional pro-forma measure,
which also begins with net income or loss, but it makes adjustments only for nonrecur-
ring items of revenue, gain, expense, and loss. The goal is to develop a measure of
financial performance that complies with investors’ need for “information about that
portion of a company’s reported earnings that is stable or recurring and that provides a
basis for estimating sustainable earnings.”
31
In the spirit of this quote, Harbinger Corpo-
ration states that the adjusted earnings are provided “In order to facilitate comparison of
operating results year over year.”
32
Developing a measure of sustainable earnings is not required by GAAP. Moreover, a
sustainable earnings series, developed by performing a comprehensive restatement of
reported earnings, is not provided by most companies. However, it is common for firms
to provide some information on the effects of selected nonrecurring items and to indicate
Getting Creative with the Income Statement: Pro-Forma Measures of Earnings
TEAMFLY
Team-Fly
®
TEAMFLY
Team-Fly
®
330
what results would have been in the absence of these items. In addition to being part of
earnings releases, such information sometimes is provided in Management’s Discussion
and Analysis of Financial Condition and Results of Operations (MD&A) and in selected
notes to the financial statements. A SEC disclosure requirement that relates specifically
to the disclosure of nonrecurring (unusual or infrequent) items is found in this passage:
Describe any unusual or infrequent events or transactions or any significant economic
changes that materially affected the amount of reported income from continuing operations
and, in each case, indicate the extent to which income was so affected. In addition, describe
any other significant components of revenues and expenses that, in the registrant’s judgment,
should be described in order to understand the registrant’s results of operations.
33
Disclosures of Nonrecurring Items and Adjusted Earnings
A sampling of disclosures of nonrecurring items and their effects on adjusted earnings is
provided in Exhibit 10.6. These disclosures are from both the MD&A and notes to the
financial statements. These pro-forma data are an additional form of income statement
creativity. They involve the recasting of information that is already a part of the GAAP-
based income statement. Providing information on earnings, after the exclusion of non-
recurring items of revenue, gain, expense and loss, should result in an earnings series that
is both more stable and of greater value in making estimates of sustainable earnings.
34
However, this creativity could be used somewhat selectively so as to play the finan-
cial numbers game. As with EBITDA, these pro-forma summaries are not GAAP state-
ments. Nonrecurring is the key quality of adjustment items that are added to or deducted
from GAAP net income. However, the precise meaning of nonrecurring is not well
defined. Companies have considerable capacity to be opportunistic in making decisions
about what items are adjusted out of reported earnings in arriving at adjusted earnings.
This is a common characteristic of pro-forma measures, as was also pointed out in the
case of EBITDA.
Notice that some of the exhibit disclosures enumerate the specific nonrecurring items
(C.R. Bard, Inc. and Cisco Systems, Inc.) that have been adjusted out of earnings, while
others simply characterize the nature of the adjustment items (Vishay Intertechnology,
Inc.). However, elsewhere in its annual report Vishay does detail its nonrecurring items.
The disclosures in the exhibit are fairly typical. That is, where the effects on earnings
are enumerated, it is usually in a textual format and not in a schedule. More frequently,
nonrecurring items are disclosed without summarizing their effects on earnings. This is
the least effective approach to dealing with nonrecurring items. A more effective pre-
sentation provides a detailed statement that summarizes the effect of nonrecurring items
on adjusted earnings.
Summary Disclosures of Nonrecurring Items The least helpful disclosures of nonre-
curring items simply enumerate their amount and presence, usually in the MD&A sec-
tion, but do not summarize their effects on net income. The disclosures in Exhibit 10.6
are an improvement on this practice because they do indicate the effect of the nonrecur-
ring items on net income. However, a potential limitation of these disclosures, especially
T
HE
F
INANCIAL
N
UMBERS
G
AME
331
when the nonrecurring items are not listed separately, is that they may not be compre-
hensive. That is, some items that are arguably nonrecurring may not have been removed
from net income in arriving at adjusted earnings.
The disclosures of nonrecurring items by Mason Dixon Bancshares, Inc., in Exhibit
10.7 are both comprehensive and presented in a user-friendly schedule, as opposed to
being embedded in textual material.
The term core net income is common among financial firms. The report by the Spe-
cial Committee on Financial Reporting of the American Institute of Certified Public
Accountants recommended that core earnings be presented in income statements. It pro-
vided the following description of core earnings:
Getting Creative with the Income Statement: Pro-Forma Measures of Earnings
Exhibit 10.6 Adjusting Earnings for the Effects of Nonrecurring Items
Company Disclosures
C. R. Bard, Inc. (1999) In 1999, Bard reported net income of $118.1
million, or diluted earnings per share of $2.28.
Excluding the impact of the after-tax gain on the
sale of the cardiopulmonary business of $0.12 and
the after-tax impact of the fourth quarter write-
down of impaired assets of ($0.11), diluted
earnings per share was $2.27.
Cisco Systems, Inc. (1999) Net income and net income per share include
purchased research and development expenses of
$471 million and acquisition-related costs of $16
million. Pro-forma net income and diluted net
income per share, excluding these nonrecurring
items net of tax, would have been $2,548 million
and $0.75, respectively.
Phillips Petroleum Co. (1999) Phillips’ net income was $609 million in 1999, up
157 percent from net income of $237 million in
1998. Special items benefited 1999 net income by
$61 million, while reducing net income in 1998
by $138 million. After excluding these items, net
operating income for 1999 was $548 million, a 46
percent increase over $375 million in 1998.
Vishay Intertechnology, Inc. (1999) Net earnings, before special charges, for the year
ended December 31, 1999 were $97,799,000 or
$1.14 per share. After special charges of
$14,562,000 or $0.17 per share, net earnings were
$0.97 per share.
Sources: Companies’ annual reports. The year following each company name designates the annual
report from which each example was drawn.
332
A company’s core activities are usual or recurring activities, transactions, and events. Usual
means the activity is ordinary and typical for a particular company. Recurring means the
activity, transaction, or event is expected to occur again after an interval. Core activities
include usual or recurring operations and recurring non-operating gains and losses. Con-
versely, non-core activities, transactions, and events are unusual (not typical for a particu-
lar company) or non-recurring (not expected to occur again in the foreseeable future or
before a specified interval).
35
Mason Dixon’s earnings revision is quite comprehensive. However, two items remain
in core (adjusted) net income that could be candidates for adjustment: gain on sale of
securities of $792,000 and gain on sale of mortgage loans of $2,140,000. Such transac-
tions no doubt fit within the concept of Mason Dixon’s core earnings. In a nonfinancial
firm, the gain on the sale of securities would be a prime candidate for exclusion in mov-
ing toward adjusted net income. However, another financial firm, Emerald Financial
Corporation, excluded gains on the sale of loans in a comparable revision of earnings.
36
As with EBITDA, comparability of adjusted earnings must be considered a potential
weakness of this pro-forma information.
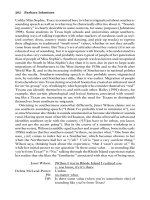
In Exhibit 10.8, the income statement of Cooper Industries, Inc., displays information
on nonrecurring items within the body of the GAAP-basis income statement. Doing this
has the virtue of not requiring the reader to look to some other location for information
on the presence of nonrecurring items and their effects on earnings.
The presentation of nonrecurring items within the body of the Cooper income state-
ment is generally consistent with the recommendation of the Special Committee on
T
HE
F
INANCIAL
N
UMBERS
G
AME
Exhibit 10.7 Comprehensive Revision of Earnings: Mason Dixon
Bancshares, Inc., Consolidated Income Statement, Year Ending December
31, 1998 (thousands of dollars)
Reported net income $10,811
Adjustments, add (deduct), for nonrecurring items:
Gain on sale of branches (6,717)
Special loan provision for loans with Year 2000 risk 918
Special loan provision for change in charge-off policy 2,000
Reorganization costs 465
Year 2000 costs 700
Impairment loss on mortgage sub-servicing rights 841
Income tax expense on the nonrecurring items above 1,128
———–
Core (adjusted) net income $10,146
———–
———–
Source: Mason Dixon Bancshares, Inc., Annual Report, December 1998. Information obtained from
Disclosure, Inc., Compact D/SEC: Corporate Information on Public Companies Filing with the SEC
(Bethesda, MD: Disclosure, Inc., June 2000).
333
Financial Reporting of the AICPA.
37
The other major nonrecurring item in Cooper’s
income statement, Discontinued Operations, is placed below Operating earnings after
nonrecurring items. A fully adjusted net income measure also would require the deduc-
tion of the income from discontinued operations. However, this is easy to accomplish
with the information as presented.
Notice the difference between the trend in Cooper’s performance as represented by
the income series that excludes the nonrecurring items. Only modest growth is sug-
gested by Operating earnings after nonrecurring items for the period 1998 to 2000. How-
ever, substantial earnings growth is indicated for the same period by Operating earnings
before nonrecurring items. Getting a reliable reading on trends, if any, in underlying
operating performance is a key benefit of the income statement creativity represented by
the development of adjusted earnings.
In addition to the summary income statement disclosures of nonrecurring items,
Cooper provided detailed notes on nonrecurring and unusual items. Some of these items
are quite small: a $2.8 million gain on a litigation settlement and a $0.8 million insurance
Getting Creative with the Income Statement: Pro-Forma Measures of Earnings
Exhibit 10.8 Adjusted Earnings within the Income Statement: Cooper
Industries, Inc., Consolidated Income Statements, Year Ending December 31,
1998–2000 (millions of dollars)
1998 1998 2000
Revenues $3,651.2 $3,868.9 $4,459.9
Cost of sales 2,447.1 2,603.4 3,018.3
Selling and administrative expenses 616.4 640.9 732.9
Goodwill amortization 43.8 47.1 58.5
———— ———— ————
Operating earnings before nonrecurring items 543.9 577.5 650.2
Nonrecurring gains (135.2) — —
Nonrecurring charges 53.6 3.7 —
———— ———— ————
Operating earnings after nonrecurring items 625.5 573.8 650.2
Interest expense, net 101.9 55.2 100.3
———— ———— ————
Income before income taxes 523.6 518.6 549.9
Income taxes 187.7 186.7 192.5
———— ———— ————
Income from continuing operations 335.9 331.9 357.4
Income from discontinued operations, net of
income taxes 87.1 — —
———— ———— ————
Net Income $ 423.0 $ 331.9 $ 357.4
———— ———— ————
———— ———— ————
Note: Earnings per share data, included with the Cooper income statement, are not reproduced
above.
Source: Cooper Industries, Inc., annual report, December 2000, p. 20.
334
recovery based upon an unsuccessful offer for another company in 1999. Nonrecurring
items in 1998 included charges of $5.8 million for a voluntary severance program and
$1.5 for other severance and closure costs. Others are very large: a $132.7 million gain
on an exchange of securities and a $53.6 million restructuring charge, both in 1998.
The presentation of adjusted or pro-forma earnings numbers within the GAAP income
statement is uncommon. Supplemental disclosures of this information are the norm.
However, even with the absence of detail on the nonrecurring items on the face of the
income statement, Cooper’s disclosures provide an opportunity to present an alternative
measure of operating performance within the framework of the GAAP-basis income
statement. It is decidedly user friendly.
The reliability of alternative measures of financial performance, such as that pre-
sented by Cooper Industries, turns on the classification of items of revenue, gain,
expense, and loss as recurring versus nonrecurring. The treatment of individually small
nonrecurring items also could have a significant influence on the message conveyed by
the adjusted earnings. Some attention was given to the issue of materiality in Chapter 9.
Some examples of the classification of items as nonrecurring are presented in the next
section.
Nonrecurring Classification Decision
The classification of items as nonrecurring is the key to developing adjusted earnings.
No definition can remove the need for judgment in identifying nonrecurring items. How-
ever, some further insight into this classification decision can be gained by reviewing the
range of items removed from net income in arriving at the pro-forma earnings. A sam-
pling of these items is presented in Exhibit 10.9.
Some of the labels applied to these pro-forma earnings numbers by the companies
were: underlying results (Johns Manville Corp. and Phillip Morris Cos.), core operating
results (Area Bancshares Corp.), pro-forma results (Schnitzer Steel Industries, Inc.),
adjusted net income (Beringer Wine Estates, Inc. and Air Canada), and normalized net
earnings (Curtiss-Wright Corp).
The listing in the exhibit includes more nonrecurring charges than gains. This simply
reflects the typical excess of nonrecurring charges over nonrecurring gains. A review of
1,100 third-quarter earnings reports for 2000 showed 18 nonrecurring charges per 100
companies against only eight nonrecurring gains per 100 companies.
38
Pro-forma, or adjusted, income measures are presented by many firms, but these pre-
sentations are found most frequently among firms with numerous nonrecurring items.
With the growth in the frequency of nonrecurring items, adjusted earnings are essential
in order to determine the trends, if any, in basic operating profitability. The presence of
numerous nonrecurring items may mask developing profitability trends. There is some
evidence that earnings purged of nonrecurring items have more predictive value and
information content, and are more closely associated with firm value than as-reported
earnings.
39
However, adjusted earnings are not developed with the level of formal guidance asso-
ciated with GAAP net income. The limited number of adjustments reported with
adjusted net earnings and the absence of detailed summaries of the nonrecurring items
T
HE
F
INANCIAL
N
UMBERS
G
AME
335
Getting Creative with the Income Statement: Pro-Forma Measures of Earnings
Exhibit 10.9 Adjustments for Pro-Forma Earnings
Company Nonrecurring Items
Nonrecurring Losses or Expenses
Air Canada (1998) Estimated impact of strike
American Standard Cos., Inc. (1999) Asset impairment charges
ATI Technologies, Inc. (1999) Purchased in-process research and
development
BEA Systems, Inc. (2000) Payroll taxes on gains from employee
options
Beringer Wine Estates, Inc. (1999) Charge from inventory step-up
Compaq Computer Corp. (1999) Restructuring and related charges
Cone Mills Corp. (1999) Operating losses of businesses exited
Crown Cork & Seal Co., Inc. (1999) Charges due to an earthquake in Turkey
Federal Mogul Corp. (1999) Reengineering and integration costs
Johns Manville Corp. (1999) Shutdown, demolition and site restoration
Micron Electronics, Inc. (2000) e-commerce infrastructure development
Nova Chemicals Corp. (1999) Loss on hedges of currency exposures
Pall Corp. (2000) Charge for increase in environmental
reserve
Phillip Morris Cos, Inc. (1999) Beer asset write-downs
Schnitzer Steel Industries, Inc. (2000) Inventory write-down
Stewart & Stevenson Services, Inc. (1999) Change in estimated profit on a contract
Toys “R” Us, Inc. (1999) Costs to establish internet subsidiary
Nonrecurring Gains or Revenues
Air Canada (1998) Fuel excise tax rebate
Airtran Holdings, Inc. (1999) Gain on litigation settlement
Area Bancshares Corp. (1999) Securities gains
C. R. Bard, Inc. (1999) Gain on settlement of patent infringement
claims
Cameco Corp. (1999) Sale of uranium property interests
Cisco Systems, Inc. (2000) Sale of minority stock investment
Curtiss-Wright Corp. (1999) Environmental insurance settlements
Federal Mogul, Inc. (1999) Gain on currency option
Phillips Petroleum Co. (1999) Kenai tax settlement benefit
Quaker Chemical Corp. (1999) Reversal of repositioning and integration
charges
Supervalue, Inc. (2000) Sale of Hazelwood Farms Bakeries
Sources: Companies’ annual reports. The year following each company name designates the annual
report from which each example was drawn.
336
make it unclear how comprehensively earnings have been adjusted. Ample room
remains for firms to be creative with the income statement data that are the grist for
adjusted earnings. A process that should be prompted by the desire to reveal what might
otherwise be obscured could, instead, be used to do the opposite.
Interim Pro-forma Earnings Releases
The examples of adjusted earnings are drawn mainly from information found in formal
financial statement disclosures in company annual reports. However, the initial
announcements of interim and annual earnings usually include relatively limited disclo-
sures. More complete information often is available only later, when the more formal
interim reports on Form 10-Q or the annual report on Form 10-K are filed or the annual
reports to shareholders are released. In the case of interim reports on Form 10-Q, note
disclosures are far less extensive than in the annual report. It is quite common for lim-
ited-disclosure earnings releases to include pro-forma measures of earnings, with their
prominence often greater than that accorded to GAAP-based net income or loss. The
degree to which these pro-forma measures are explained varies.
The earnings release of Amazon.Com, Inc., for its 2001 first-quarter results is more
detailed than the earnings releases of many other companies.
40
The release provides a
useful example of the adjustments made to arrive at pro-forma results and includes dis-
closures that reconcile actual results under GAAP to the pro-forma results.
In its release, Amazon initially presents information on sales and gross profit growth,
and then follows immediately with a disclosure of a pro-forma operating loss of $49. A
pro-forma net loss of $76 million is presented next. The pro-forma net loss makes addi-
tional adjustments for the effects of noncash gains and losses, equity in losses of equity
method investees, and cumulative effect of a change in accounting principle. The net loss
on a GAAP basis of $234 million is presented last.
The Amazon earnings release includes comments on both the nature and role of the
pro-forma information:
Pro-forma information regarding Amazon.com’s results from operations is provided as a
complement to results provided in accordance with accounting principles generally
accepted in the United States (GAAP). Pro-forma operating loss excludes stock-based
compensation costs, amortization of goodwill and other intangibles, and impairment-
related and other costs (including restructuring and other charges). Management measures
the progress of the business using this pro-forma information.
Pro-forma net loss excludes stock-based compensation costs, amortization of goodwill
and other intangibles, impairment-related and other costs (including restructuring and other
charges), non-cash gains and losses, equity in losses of equity-method investees, and the
cumulative effect of change in accounting principle.
41
Amazon.Com places an emphasis on pro-forma as opposed to GAAP numbers when
it comes to judging their financial performance. This is consistent with the declaration
that “Management measures the progress of the business using this pro-forma informa-
tion.” In a listing of “Highlights of First Quarter Results,” seven items are listed, begin-
ning with the growth in sales, gross profit, and customers. These three disclosures are
T
HE
F
INANCIAL
N
UMBERS
G
AME
337
followed by the pro-forma loss from operations and the pro-forma net loss. The net loss
on a GAAP basis and the ending balance of cash and marketable securities are listed
sixth and seventh.
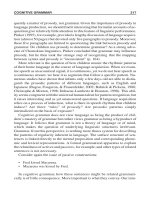
In contrast to the above ordering of information, the financial statements provided
with the earnings release present the GAAP-basis income statement first. These GAAP-
basis statements are followed immediately by pro-forma income statements. These dis-
closures provide an explicit reconciliation of GAAP and pro-forma results. The
pro-forma statement of operations for the three months ended March 31, 2001 is pre-
sented in Exhibit 10.10.
Amazon.com also presented pro-forma measures in its 2000 annual report to the SEC
on Form 10-K, along with the following qualifier:
The pro-forma information is not presented in accordance with accounting principles gen-
erally accepted in the United States and may not necessarily be useful in analyzing our
results.
42
The Amazon.Com pro-forma measures are not showcased in the 10-K report, for the
year ending December 31, 2000, to the extent that they are in the 2001 interim earnings
releases. The high profile of the pro-forma results in the earnings release may be due to
the fact that such releases are not subject to SEC regulation.
43
Amazon’s disclosures appear to conform to the recent recommendations made by the
combined efforts of Financial Executives International and the National Investor Rela-
tions Institute (FEI/NIRI).
44
The recommendations included the requirement that pro-
forma “results should always be accompanied by a clearly described reconciliation to
GAAP results.” In addition, the report stated that the “order in which reported or pro-
forma results are presented in the release is not as important as their context.” Therefore,
Amazon’s presentation of pro-forma results before actual results does not represent a
problem, according to the FEI/NIRI report.
Amazon does balance, to some extent, the prominence given the pro-forma results in
the opening paragraph of its earnings release by presenting the GAAP-basis income
statement before presenting the reconciliation of GAAP-basis and pro-forma results
shown in Exhibit 10.10.
The adjustments made to arrive at pro-forma results, such as those disclosed in the
exhibit, share much the same blend of noncash and nonrecurring features that were dis-
cussed in connection with adjustments made in arriving at EBITDA. Adjustments for
nonrecurring items are probably the easiest to support, and analysts routinely remove
such items from reported earnings in assessing ongoing performance. The potential dif-
ficulty with these adjustments is that considerable discretion may be employed in decid-
ing just what is and is not considered to be nonrecurring. Moreover, these calculations
are devoid of any GAAP guidance, and the Securities and Exchange Commission has not
made any move to restrain this activity.
The adjustment for noncash items is more difficult to justify, unless the central objec-
tive of the pro-forma measures is to represent cash flow. However, the adjustment for
nonrecurring items, some of which are associated with current cash flows, suggests that
cash flow is not the central objective of pro-forma measures of results.
Getting Creative with the Income Statement: Pro-Forma Measures of Earnings
338
T
HE
F
INANCIAL
N
UMBERS
G
AME
Exhibit 10.10 GAAP-Basis and Pro-Forma Earnings: Amazon.Com Inc.,
Consolidated Statements of Operations, for the Three Months Ended March
31, 2001 (thousands of dollars)
As Pro-Forma
Reported Adjustments Pro Forma
Net sales $ 700,356 — $700,356
Cost of sales 517,759 — 517,759
————– ————– ————–
Gross profit 182,597 — 182,597
Operating expenses:
Fulfillment 98,248 — 98,248
Marketing 36,638 — 36,638
Technology and content 70,284 — 70,284
General and administrative 26,028 — 26,028
Stock-based compensation 2,916 (2,916) —
Amortization of goodwill and
other intangibles 50,831 (50,831) —
Impairment-related and other 114,260 (114,260) —
————– ————– ————–
Total operating expenses 399,205 (168,007) 231,198
————– ————– ————–
Loss from operations (216,608) 168,007 (48,601)
Interest income 9,950 — 9,950
Interest expense (33,748) — (33,748)
Other expense, net (3,884) — (3,884)
Non-cash gains and losses, net 33,857 (33,857) —
————– ————– ————–
Net interest expense and other 6,175 (33,857) (27,682)
————– ————– ————–
Loss before equity in losses of equity-
method investees (210,433) 134,150 (76,283)
Equity in losses of equity-method
investees (13,175) 13,175 —
————– ————– ————–
Net loss before change in
accounting principle (223,608) 147,325 (76,283)
Cumulative effect of change in
accounting principle (10,523) 10,523 —
————– ————– ————–
Net loss $(234,131) $ 157,848 $(76,283)
————– ————– ————–
————– ————– ————–
Note: Earnings per share date were provided with the income statement but are not
included above.
Source: Amazon.Com, first-quarter earnings release, April 24, 2001, pp. 5–6
339
There is something quite peculiar about a reporting and disclosure system that
requires a strict adherence to GAAP in developing the required measures of perfor-
mance but then permits the virtually unfettered production of competitors to GAAP.
Moreover, when these competitive measures are presented along with GAAP measures,
it is common for them to be given equal or greater prominence.
Pro-forma measures of earnings, especially when they are featured in a company’s
earnings release, provide maximum freedom to exercise income statement creativity
and play the financial numbers game. With the exception of pro-forma earnings that
involve only adjustments for nonrecurring items, these pro-forma measures should be
seen as the equivalent of home remedies that have not had to meet the rigors of FDA test-
ing in order to demonstrate their efficacy. They should be examined carefully and used
with caution.
SUMMARY
The income statement is the premier playground of those who engage in the financial
numbers game. The goal of this chapter has been to analyze selected measures of finan-
cial performance that are GAAP based but that are not GAAP measures. Key points
made in the chapter include the following:
• The traditional preeminence of the income statement’s bottom line as a measure of
financial performance is under attack, and a variety of alternatives have been devel-
oped. Virtually all of the competitors to net income are not measures that are part of
the body of GAAP. These non-GAAP alternatives normally use information that is
part of the conventional income statement. However, these alternative, pro-forma
measures rearrange this information and use only a subset of the information in the
income statement.
• Pro-forma measures of financial performance are developed by removing selected
nonrecurring or noncash revenues, gains, expenses, and losses from GAAP net
income. The resulting measure of financial performance then is characterized either
as being superior to net income as an indicator of financial performance or as being
demanded by statement users.
• EBITDA (earnings before interest, taxes, depreciation, and amortization) is a popular
pro-forma measure of financial performance. EBITDA often is presented prior to net
income as a measure of a firm’s financial performance. It is common for the calcula-
tion of EBITDA to include adjustments for nonrecurring items as well as ITDA (inter-
est, taxes, depreciation, and amortization). EBITDA is a blended measure of cash
flow and sustainable earnings. While often represented as a measure of cash flow
from operations, its failure to include working capital requirements as well as interest
and taxes, clearly operating cash flow items, leaves it open to substantial criticism.
• Adjusted earnings is an even more dominant concept than EBITDA. Somewhat infor-
mal and incomplete adjusted earnings data are presented virtually every time earnings
are released. If there are any material nonrecurring items, then their effect on earnings
Getting Creative with the Income Statement: Pro-Forma Measures of Earnings
TEAMFLY
Team-Fly
®
TEAMFLY
Team-Fly
®
340
will be discussed. Some versions of adjusted earnings continue to be developed by
removing only the effects of nonrecurring items. However, in more recent years,
selected noncash items have been removed from net income as well. Both EBITDA
and adjusted (pro-forma) earnings started out with a narrow focus. EBITDA simply
moved up the income statement to a location before interest and taxes and then added
back depreciation and amortization. Adjusted earnings simply removed nonrecurring
items of revenue, gain, expense, and loss. The computation of both EBITDA and
adjusted earnings now involves adjustments based on selected items that are seen to
be nonrecurring or noncash. A unifying concept of why these measures should be
seen to be as preferable to GAAP-based measures is yet to be articulated. Companies
presenting these measures make little or no effort to defend their use.
• Selected adjustments to the bottom line can provide a measure of earnings that is a
better indicator of sustainable financial performance. This is especially true if the
adjustments represent nonrecurring items of revenue, gain, expense, and loss. How-
ever, these adjusted or pro-forma measures currently are provided in an unregulated
environment that lacks any standards to guide their development and use. Some of
these adjusted or pro-forma measures lack adequate justification, and at times they
seem driven simply to improve the apparent financial performance of firms. At a
minimum, firms should justify these measures, detail their computation, and reconcile
them to conventional bottom-line net income or loss. In the meantime, like an unap-
proved therapy or drug, they should be used with caution.
GLOSSARY
Abusive Earnings Management The use of various forms of gimmickry to distort a com-
pany’s true financial performance in order to achieve a desired result.
45
Adjusted Earnings Net income adjusted to exclude selected nonrecurring and noncash items
of reserve, gain, expense, and loss.
Adjusted EBITDA Conventional earnings before interest, taxes, depreciation, and amortiza-
tion (EBITDA) revised to exclude the effects of mainly nonrecurring items of revenue or gain and
expense or loss.
Core Earnings A measure of earnings that includes only the results of the primary operating
activities of the firm. It is most common to see the measure used by financial firms.
EBBS Earnings before the bad stuff. An acronym attributed to a member of the Securities and
Exchange Commission staff. The reference is to earnings that have been heavily adjusted to
remove a wide range of nonrecurring, nonoperating, and noncash items.
EBDDT Earnings before depreciation and deferred taxes. This measure is used principally by
firms in the real estate industry, with the exception of real estate investment trusts, which typi-
cally do not pay taxes.
Defined EBITDA A measure of EBITDA that is outlined or defined in a debt or credit agree-
ment. Also see adjusted EBITDA and recurring EBITDA.
EBIT Earnings before interest and taxes. The measure often is used to gauge coverage of fixed
charges.
EBITA Earnings before interest, taxes, and amortization expense.
T
HE
F
INANCIAL
N
UMBERS
G
AME
341
EBITDA Earnings before interest, taxes, depreciation, and amortization.
EBITDA Margin EBITDA divided by total sales or total revenue.
EBITDAR Earnings before interest, taxes, deprecation, amortization, and rents.
Financial Covenant A feature of a debt or credit agreement that is designed to protect the
lender or creditor. It is common to characterize covenants as either positive or negative covenants.
A positive covenant might require that the debtor maintain a minimum amount of working capi-
tal. A negative covenant might limit dividend payments that may be made.
Nonrecurring Items Items that do not appear with any regularity but are not considered to be
unusual. If an item is judged to be both nonrecurring and unusual, then it would properly be clas-
sified as extraordinary.
Operating Earnings An after-tax measure of performance that selectively excludes items of
nonrecurring and sometimes noncash revenue, gain, expense, and loss. It may be used inter-
changeably with adjusted earnings.
Operating Income A measure of results produced by the core operations of a firm. It usually
is found in multistep income statements and is a pretax measure. The term operating earnings is
sometimes used interchangeably with operating income. However, operating income is a GAAP
measure, and operating earnings is a pro-forma, non-GAAP measure of performance.
Opportunistic Behavior Using the flexibility inherent in GAAP to alter earnings so as to
achieve desired outcomes.
Permanent Earnings Reported earnings that have had the after-tax effects of all items of non-
recurring revenues, gains, expenses, and losses removed. Used interchangeably with sustainable
earnings.
Pro-forma Earnings Measures of earnings that are derived by making adjustments to the net
income or loss found in the GAAP income statement.
Recurring EBITDA The standard EBITDA with the effects of nonrecurring items removed.
Comparable to adjusted EBITDA.
Restructuring Charge Costs associated with restructuring activities, including the consolida-
tion and/or relocation of operations or the disposition or abandonment operations or productive
assets. Such charges may be incurred in connection with a business combination, a change in an
enterprise’s strategic plan, or a managerial response to declines in demand, increasing costs, or
other environmental factors.
Special Items A term that is used interchangeably with nonrecurring items.
Sustainable Earnings Reported earnings that have had the after-tax effects of all material
items of nonrecurring revenue or gain and expense or loss removed.
NOTES
1. From a speech by Laura S. Unger, acting chairman of the SEC, given to the Philadelphia Bar
Association on March 30, 2001. The speech is titled “Protecting the Integrity of Financial
Information in Today’s Marketplace,” and the quote is from p. 4. The speech is available at:
www.sec.gov/news/speech/spch474js.htm.
2. Interview with Robert Olstein, of New York–based Olstein & Associates, Barrons, October
5, 1998.
3. George Donnelly, “Pro Forma Performances,” CFO Magazine, November 27, 2000, p. 1.
4. The Wall Street Journal, November 24, 1999, p. C1.
Getting Creative with the Income Statement: Pro-Forma Measures of Earnings