Digital video quality vision models and metrics phần 9 ppsx
Bạn đang xem bản rút gọn của tài liệu. Xem và tải ngay bản đầy đủ của tài liệu tại đây (187.53 KB, 20 trang )
highest quality over all scenes, closely followed by condition 7 (MPEG-4 at
2 Mb/s). At 1 Mb/s, the MPEG-4 codec (condition 6) outperforms conditions
1, 3, and 8. It should be noted that the Intel Indeo Video codecs and the
Sorenson Video codec were designed for lower bitrates than the ones used in
this test and obviously do not scale well at all, as opposed to MPEG-2 and
MPEG-4. Comparing Figures 6.10(a) and 6.10(b) reveals that the perceived
quality depends much more on the codec and bitrate than on the particular
scene content in these experiments.
6.3.6 PDM Prediction Performance
Before returning to the image appeal attributes, let us take a look at the
prediction performance of the regular PDM for these sequences. This is of
interest for two reasons. First, as mentioned before, no normalization of the
test sequences was carried out in this test. Second, the codecs and compres-
sion algorithms described above used to create the test sequences and the
resulting visual quality of the sequences are very different from the VQEG
test conditions (cf. Table 5.2). The latter rely almost exclusively on MPEG-2
and H.263, which are based on very similar compression algorithms (block-
based DCT with motion compensation), whereas this test adds codecs based
on vector quantization, the wavelet transform and hybrid methods. One of the
advantages of the PDM is that it is independent of the compression method
due to its underlying general vision model, contrary to specialized artifact
metrics (cf. section 3.4.4).
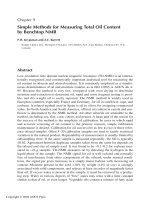
The scatter plot of perceived quality versus PDM predictions is shown in
Figure 6.11(a). It can be seen that the PDM is able to predict the subjective
ratings well for most test sequences. The outliers belong mainly to conditions
1 and 8, the lowest-quality sequences in the test, as well as the computer-
graphics scenes, where some of the Windows-based codecs introduced strong
color distortions around the text, which was rated more severely by the
subjects than by the PDM. It should be noted that performance degradations
for such strong distortions can be expected, because the metric is based on a
threshold model of human vision. Despite the much lower quality of the
sequences compared to the VQEG experiments, the correlations between
subjective DMOS and PDM predictions over all sequences are above 0.8 (see
also final results in Figure 6.13).
The prediction performance of the PDM should be compared with PSNR,
for which the corresponding scatter plot is shown in Figure 6.11(b). Because
PSNR measures ‘quality’ instead of distortion, the slope of the plot is
negative. It can be observed that its spread is wider than for the PDM, i.e.
144 METRIC EXTENSIONS
there is a higher number of outliers. While PSNR achieved a performance
comparable to the PDM in the VQEG test, its correlations have now
decreased significantly to below 0.7.
6.3.7 Performance with Image Appeal Attributes
Now the benefits of combining the PDM quality predictions with the image
appeal attributes are analyzed. The sharpness and colorfulness ratings are
0 10 20 30 40 50 60 70 80 90
0
10
20
30
40
50
60
70
80
PDM prediction
Subjective DMOS
20 25 30 35 40 45
0
10
20
30
40
50
60
70
80
PSNR [dB]
Subjective DMOS
(a) PDM predictions
(b) PSNR
Figure 6.11 (a) Perceived quality versus PDM predictions (a) and PSNR (b). The error
bars indicate the 95% confidence intervals of the subjective ratings.
IMAGE APPEAL 145
computed for the test sequences described above in section 6.3.4. The results
are compared with the subjective quality ratings from section 6.3.5 in
Figure 6.12. The correlation between the subjective quality ratings and
the sharpness rating differences is lower than for the VQEG sequences
(see section 6.3.3). This is mainly due to the extreme outliers pertaining
–0.05 –0.04 –0.03 –0.02 –0.01 0 0.01 0.02 0.03 0.04 0.05
0
10
20
30
40
50
60
70
80
Sharpness rating difference
Subjective DMOS
–0.02 0 0.02 0.04 0.06 0.08 0.1 0.12 0.14
0
10
20
30
40
50
60
70
80
Colorfulness rating difference
Subjective DMOS
(a) Sharpness
(b) Colorfulness
Figure 6.12 (a) Perceived quality versus sharpness (a) and colorfulness (b) rating
differences.
146 METRIC EXTENSIONS
to conditions 1 and 8. These conditions introduce considerable distortions
leading to additional strong edges in the compressed sequences, which
increase the overall contrast.
On the other hand, a correlation between colorfulness rating differences
and subjective quality ratings can now be observed. This confirms our
assumption that the counter-intuitive behavior of the colorfulness ratings
for the VQEG sequences was due to their rigorous normalization. Without
such a normalization, the behavior is as expected for the test sequences
described above in section 6.3.4, i.e. the colorfulness of the compressed
sequences is reduced with respect to the reference for nearly all test
sequences (see Figure 6.12(b)).
We stress again that neither the sharpness rating nor the colorfulness rating
was designed as an independent measure of quality; both have to be used in
combination with a visual fidelity metric. Therefore, the sharpness and
colorfulness rating differences are combined with the output of the PDM
as Á
PDM
þ w
sharp
maxð0; Á
sharp
Þþw
color
maxð0; Á
color
Þ. The rating differ-
ences are thus scaled to a range comparable to the PDM predictions, and
negative differences are excluded. The results achieved with the optimum
weights are shown in Figure 6.13.
It is evident that the additional consideration of sharpness and colorfulness
improves the prediction performance of the PDM. The improvement with the
sharpness rating alone is smaller than for the VQEG data. Together with the
0.65 0.7 0.75 0.8 0.85 0.9
0.7
0.72
0.74
0.76
0.78
0.8
0.82
0.84
0.86
0.88
0.9
Pearson linear correlation
Spearman rank–order correlation
PSNR(VQEG)
PDM(VQEG)
PDM
sharp
(VQEG)
PSNR
PDM
PDM
sharp
PDM
color
PDM
sharp
color
better
Figure 6.13 Prediction performance of the PDM alone and in combination with image
appeal attributes for the VQEG test sequences (stars) as well as the new test sequences
(circles). PSNR correlations are shown for comparison.
IMAGE APPEAL 147
results discussed in section 6.3.3, this indicates that the sharpness rating is
more useful for sequences with relatively low distortions. The colorfulness
rating, on the other hand, which is of low computational complexity, gives a
significant performance boost to the PDM predictions.
6.4 SUMMARY
A number of promising applications and extensions of the PDM were
investigated in this chapter:
A perceptual blocking distortion metric (PBDM) for evaluating the effects
of blocking artifacts on perceived quality was described. Using a stage for
blocking region segmentation, the PBDM was shown to achieve high
correlations with subjective blockiness ratings.
The usefulness of including object segmentation in the PDM was dis-
cussed. The advantages of segmentation support were demonstrated with
test sequences showing human faces, resulting in better agreement of the
PDM predictions with subjective ratings.
Sharpness and colorfulness were identified as important attributes of
image appeal. The attributes were quantified by defining a sharpness
rating based on the measure of isotropic local contrast and a colorfulness
rating derived from the distribution of chroma in the sequence. Extensive
subjective experiments were carried out to establish a relationship between
these ratings and perceived video quality. The results show that a
combination of PDM predictions with the sharpness and colorfulness
ratings leads to improvements in prediction performance.
148 METRIC EXTENSIONS
7
Closing Remarks
We shall not cease from exploration
And the end of all our exploring
Will be to arrive where we started
And know the place for the first time.
T. S. Eliot
7.1 SUMMARY
Evaluating and optimizing the performance of digital imaging systems with
respect to the capture, display, storage and transmission of visual information
is one of the biggest challenges in the field of image and video processing.
Understanding and modeling the characteristics of the human visual system
is essential for this task.
We gave an overview of vision and discussed the anatomy and physiology
of the human visual system in view of the applications investigated in this
book. The following aspects can be emphasized: visual information is
processed in different pathways and channels in the visual system, depending
on its characteristics such as color, frequency, orientation, phase, etc. These
channels play an important role in explaining interactions between stimuli.
Furthermore, the response of the visual system depends much more on the
contrast of patterns than on their absolute light levels. This makes the visual
system highly adaptive. However, it is not equally sensitive to all stimuli.
We discussed the fundamentals of digital imaging systems. Image and
video coding standards already exploit certain properties of the human visual
Digital Video Quality - Vision Models and Metrics Stefan Winkler
# 2005 John Wiley & Sons, Ltd ISBN: 0-470-02404-6
system to reduce bandwidth and storage requirements. Lossy compression as
well as transmission errors lead to artifacts and distortions that affect video
quality. Guaranteeing a certain level of quality has thus become an important
concern for content providers. However, perceived quality depends on many
different factors. It is inherently subjective and can only be described
statistically.
We reviewed existing visual quality metrics. Pixel-based metrics such as
MSE and PSNR are still popular despite their inability to give reliable
predictions of perceived quality across different scenes and distortion types.
Many vision-based quality metrics have been developed that provide a better
prediction performance. However, independent comparison studies are rare,
and so far no general-purpose metric has been found that is able to replace
subjective testing.
Based on these foundations, we presented models of the human visual
system and its characteristics in the framework of visual quality assessment
and distortion minimization.
We constructed an isotropic local contrast measure by combining the
responses of analytic directional filters. It is the first omnidirectional phase-
independent contrast definition that can be applied to natural images and
agrees well with perceived contrast.
We then described a perceptual distortion metric (PDM) for color video.
The PDM is based on a model of the human visual system that takes into
account color perception, the multi-channel architecture of temporal and
spatial mechanisms, spatio-temporal contrast sensitivity, pattern masking,
and channel interactions. It was shown to accurately fit data from psycho-
physical experiments.
The PDM was evaluated by means of subjective experiments using natural
images and video sequences. It was validated using threshold data for color
images, where its prediction performance is close to the differences between
subjects. With respect to video, the PDM was shown to perform well over a
wide range of scenes and test conditions. Its prediction performance is on a
par with or even superior to other advanced video quality metrics, depending
on the sequences considered. However, the PDM does not yet achieve the
reliability of subjective ratings.
The analysis of the different components of the PDM revealed that visual
quality metrics that are essentially equivalent at the threshold level can
exhibit differences in prediction performance for complex sequences,
depending on the implementation choices made for the color space and the
pooling algorithm. The design of the decomposition filters on the other hand
only has a negligible influence on the prediction accuracy.
150 CLOSING REMARKS
We also investigated a number of promising metric extensions in an
attempt to overcome the limitations of the PDM and other vision-based
quality metrics and to improve their prediction performance. A perceptual
blocking distortion metric (PBDM) for evaluating the effects of blocking
artifacts was described. The PBDM was shown to achieve high correlations
with perceived blockiness. Furthermore, the usefulness of including object
segmentation in the PDM was discussed. The advantages of segmentation
support were demonstrated with test sequences showing human faces,
resulting in better agreement of the PDM predictions with subjective ratings.
Finally, we identified attributes of image appeal that contribute to per-
ceived quality. The attributes were quantified by defining a sharpness rating
based on the measure of isotropic local contrast and a colorfulness rating
derived from the distribution of chroma in the sequence. Additional sub-
jective experiments were carried out to establish a relationship between these
ratings and perceived video quality. The results show that combining the
PDM predictions with sharpness and colorfulness ratings leads to improve-
ments in prediction performance.
7.2 PERSPECTIVES
The tools and techniques that were introduced in this book are quite general
and may prove useful in a variety of image and video processing applica-
tions. Only a small number could be investigated within the scope of this
book, and numerous extensions and improvements can be envisaged.
In general, the development of computational HVS-models itself is still in
its infancy, and many issues remain to be solved. Most importantly, more
comparative analyses of different modeling approaches are necessary. The
collaborative efforts of Modelfest (Carney et al., 2000, 2002) or the Video
Quality Experts Group (VQEG, 2000, 2003) represent important steps in the
right direction. Even if the former concerns low-level vision and the latter
entire video quality assessment systems, both share the idea of applying
different models to the same set of carefully selected subjective data under
the same conditions. Such analyses will help determine the most promising
approaches.
There are several modifications of the vision model underlying the
perceptual distortion metric that can be considered:
The spatio-temporal CSF used in the PDM is based on stabilized
measurements and does not take into account natural unconstrained eye
PERSPECTIVES 151
movements. This could be remedied using motion-compensated CSF
models as proposed by Westen et al. (1997) or Daly (1998). This way,
natural drift, smooth pursuit and saccadic eye movements can be inte-
grated in the CSF.
The contrast gain control model of pattern masking has a lot of potential
for considering additional effects, in particular with respect to channel
interactions and color masking. The measurements and models presented
by Chen et al. (2000a,b) may be a good starting point. Another example is
temporal masking, which has not received much attention so far, and
which can be taken into account by adding a time dependency to the
pooling function. Pertinent data are available that may facilitate the fitting
of the corresponding model parameters (Boynton and Foley, 1999; Foley
and Chen, 1999). Watson et al. (2001) incorporated certain aspects of temporal
noise sensitivity and temporal masking into a video quality metric.
Contrast masking may not be the optimal solution. With complex stimuli
as are found in natural scenes, the distortion can be more noise-like, and
masking can become much larger (Eckstein et al., 1997; Blackwell, 1998).
Entropy masking has been proposed as a bridge between contrast masking
and noise masking, when the distortion is deterministic but unfamiliar
(Watson et al., 1997), which may be a good model for quality assessment
by inexperienced viewers. Several different models for spatial masking are
discussed and compared by Klein et al. (1997) and Nadenau et al. (2002).
Finally, pattern adaptation has a distinct temporal component to it and is
not taken into account by existing metrics. Ross and Speed (1991)
presented a single-mechanisms model that accounts for both pattern
adaptation and masking effects of simple stimuli. More recently, Meese
and Holmes (2002) introduced a hybrid model of gain control that can
explain adaptation and masking in a multi-channel setting.
It is important to realize that incremental vision model improvements and
further fine-tuning alone may not lead to quantum leaps in prediction
performance. In fact, such elaborate vision models have significant draw-
backs. As mentioned before, human visual perception is highly adaptive, but
also very dependent on certain parameters such as color and intensity of
ambient lighting, viewing distance, media resolution, and others. It is
possible to design HVS-models that try to meticulously incorporate all of
these parameters. The problem with this approach is that the model becomes
tuned to very specific situations, which is generally not practical. Besides,
fitting the large number of free parameters to the necessary data is
computationally very expensive due to iterative procedures required by the
152 CLOSING REMARKS
high degree of nonlinearity in the model. However, when looking at the
example in Figure 3.9, the quality differences remain, even if viewing
parameters such as background light or viewing distance are changed. It is
clear that one will no longer be able to distinguish them from three meters
away, but exactly here lies an answer to the problem: it is necessary to make
realistic assumptions about the typical viewing conditions, and to derive from
them a good model parameterization, which can actually work for a wide
variety of situations.
Another problem with building and calibrating vision models is that most
psychophysical experiments described in the literature focus on simple test
stimuli like Gabor patches or noise patterns. This can only be a makeshift
solution for the modeling of more complex phenomena that occur when
viewing natural images. More studies, especially on masking, need to be
done with complex scenes and patterns (Watson et al., 1997; Nadenau et al.,
2002; Winkler and Su
¨
sstrunk, 2004).
Similarly, many psychophysical experiments have been carried out at
threshold levels of vision, i.e. determining whether or not a certain stimulus
is visible, whereas quality metrics and compression are often applied above
threshold. This obvious discrepancy has to be overcome with supra-threshold
experiments, otherwise the metrics run the risk of being nothing else than
extrapolation guesses. Great care must be taken when using quality metrics
based on threshold models and threshold data from simple stimuli for
evaluating images or video with supra-threshold distortions. In fact, it may
turn out that quality assessment of highly distorted video requires a
completely new measurement paradigm.
This possible paradigm shift may actually be advantageous from the point
of view of computational complexity. Like other HVS-based quality metrics,
the proposed perceptual distortion metric is quite complex and requires a lot
of computing power due to the extensive filtering and nonlinear operations in
the underlying HVS-model. Dedicated hardware implementations can alle-
viate this problem to a certain extent, but such solutions are big and
expensive and cannot be easily integrated into the average user’s TV or
mobile phone. Therefore, quality metrics may focus on specialized tasks or
video material instead, for example specific codecs or artifacts, in order to
keep complexity low while at the same time maintaining a good prediction
performance. Several such metrics have been developed for blockiness
(Winkler et al., 2001; Wang et al., 2002), blur (Marziliano et al., 2004),
and ringing (Yu et al., 2000), for example.
Another important restriction of the PDM and other HVS-model based
fidelity metrics is the need for the full reference sequence. In many
PERSPECTIVES 153
applications the reference sequence simply cannot be made available at the
testing site, for example somewhere out in the network, or a reference as such
may not even exist, for instance at the output of the capture chip of a camera.
Metrics are needed that rely only on a very limited amount of information
about the reference, which can be transmitted along with the compressed
bitstream, or even none at all. These reduced-reference or no-reference
metrics would be much more versatile than full-reference metrics from an
application point of view. However, they are less general than vision model-
based metrics in the sense that they have to rely on certain assumptions about
the sources and types of artifacts in order to make the quality predictions.
This is the reason reduced-reference metrics (Wolf and Pinson, 1999; Horita
et al., 2003) and especially no-reference metrics (Coudoux et al., 2001;
Gastaldo et al., 2002; Caviedes and Oberti, 2003; Winkler and Campos,
2003; Winkler and Dufaux, 2003) are usually based on the analysis of certain
predefined artifacts or video features, which can then be related to overall
quality for a specific application. The Video Quality Experts Group has
already initiated evaluations of such reduced- and no-reference quality
metrics.
Finally, vision may be the most essential of our senses, but it is certainly
not the only one: we rarely watch video without sound. Focusing on visual
quality alone cannot solve the problem of evaluating a multimedia experi-
ence, and the complex interactions between audio and video quality have
been pointed out previously. Therefore, comprehensive audio-visual quality
metrics are required that analyze both video and audio as well as their
interactions. Only little work has been done in this area; the metrics
described by Hollier and Voelcker (1997) or Jones and Atkinson (1998)
are among the few examples in the literature to date.
As this concluding discussion shows, the future tasks in this area of
research are challenging and need to be solved in close collaboration of
experts in psychophysics, vision science and image processing.
154 CLOSING REMARKS
Appendix: Color Space Conversions
Conversion from CIE 1931 XYZ tristimulus values to CIE L
Ã
a
Ã
b
Ã
and CIE
L
Ã
u
Ã
v
Ã
color spaces is defined as follows (Wyszecki and Stiles, 1982). The
conversions make use of the function
gðxÞ¼
x
1=3
if x > 0:008856;
7:787x þ
16
116
otherwise:
(
ðA:1Þ
Both CIE L
Ã
a
Ã
b
Ã
and CIE L
Ã
u
Ã
v
Ã
space share a common lightness component
L
Ã
:
L
Ã
¼ 116gðY=Y
0
ÞÀ16: ðA:2Þ
The 0-subscript refers to the corresponding unit for the reference white being
used. By definition, L
Ã
¼ 100, u
Ã
¼ v
Ã
¼ 0, and a
Ã
¼ b
Ã
¼ 0 for the refer-
ence white.
The two chromaticity coordinates u
Ã
and v
Ã
in CIE L
Ã
u
Ã
v
Ã
space are
computed as follows:
u
Ã
¼ 13L
Ã
ðu
0
À u
0
0
Þ; u
0
¼
4X
X þ15Y þ 3Z
;
v
Ã
¼ 13L
Ã
ðv
0
À v
0
0
Þ; v
0
¼
9Y
X þ15Y þ 3Z
;
ðA:3Þ
and the CIE L
Ã
u
Ã
v
Ã
color difference is given by
ÁE
Ã
uv
¼
ffiffiffiffiffiffiffiffiffiffiffiffiffiffiffiffiffiffiffiffiffiffiffiffiffiffiffiffiffiffiffiffiffiffiffiffiffiffiffiffiffiffiffiffiffiffiffiffiffiffiffiffiffiffi
ðÁL
Ã
Þ
2
þðÁu
Ã
Þ
2
þðÁv
Ã
Þ
2
q
: ðA:4Þ
Digital Video Quality - Vision Models and Metrics Stefan Winkler
# 2005 John Wiley & Sons, Ltd ISBN: 0-470-02404-6
The two chromaticity coordinates a
Ã
and b
Ã
in CIE L
Ã
a
Ã
b
Ã
space are
computed as follows:
a
Ã
¼ 500½gðX=X
0
ÞÀgðY=Y
0
Þ;
b
Ã
¼ 200½gðY=Y
0
ÞÀgðZ=Z
0
Þ;
ðA:5Þ
and the CIE L
Ã
a
Ã
b
Ã
color difference is given by
ÁE
Ã
ab
¼
ffiffiffiffiffiffiffiffiffiffiffiffiffiffiffiffiffiffiffiffiffiffiffiffiffiffiffiffiffiffiffiffiffiffiffiffiffiffiffiffiffiffiffiffiffiffiffiffiffiffiffiffiffiffi
ðÁL
Ã
Þ
2
þðÁa
Ã
Þ
2
þðÁb
Ã
Þ
2
q
: ðA:6Þ
156 APPENDIX: COLOR SPACE CONVERSIONS
References
All of the books in the world contain no more information than
is broadcast as video in a single large American city in a
single year. Not all bits have equal value.
Carl Sagan
Ahnelt, P. K. (1998). The photoreceptor mosaic. Eye 12(3B):531–540.
Ahumada, A. J. Jr (1993). Computational image quality metrics: A review. In SID
Symposium Digest, vol. 24, pp. 305–308.
Ahumada, A. J. Jr, Beard, B. L., Eriksson, R. (1998). Spatio-temporal discrimination model
predicts temporal masking function. In Proc. SPIE Human Vision and Electronic
Imaging, vol. 3299, pp. 120–127, San Jose, CA.
Ahumada, A. J. Jr, Null, C. H. (1993). Image quality: A multidimensional problem. In A. B.
Watson (ed.), Digital Images and Human Vision, pp. 141–148, MIT Press.
Albrecht, D. G., Geisler, W. S. (1991). Motion selectivity and the contrast-response
function of simple cells in the visual cortex. Visual Neuroscience 7:531–546.
Aldridge, R. et al. (1995). Recency effect in the subjective assessment of digitally-coded
television pictures. In Proc. International Conference on Image Processing and its
Applications, pp. 336–339, Edinburgh, UK.
Alpert, T. (1996). The influence of the home viewing environment on the measurement of
quality of service of digital TV broadcasting. In MOSAIC Handbook, pp. 159–163.
ANSI T1.801.01 (1995). Digital transport of video teleconferencing/video telephony
signals – video test scenes for subjective and objective performance assessment. ANSI,
Washington, DC.
Antoine, J P., Murenzi, R., Vandergheynst, P. (1999). Directional wavelets revisited:
Cauchy wavelets and symmetry detection in patterns. Applied and Computational
Harmonic Analysis 6(3):314–345.
Ardito, M., Gunetti, M., Visca, M. (1996). Preferred viewing distance and display
parameters. In MOSAIC Handbook, pp. 165–181.
Digital Video Quality - Vision Models and Metrics Stefan Winkler
# 2005 John Wiley & Sons, Ltd ISBN: 0-470-02404-6
Ascher, D., Grzywacz, N. M. (2000). A Bayesian model of temporal frequency masking.
Vision Research 40(16):2219–2232.
Avcibas
˛
,I
˙
., Sankur, B., Sayood, K. (2002). Statistical evaluation of image quality measures.
Journal of Electronic Imaging 11(2):206–223.
Bass, M. (ed. in chief) (1995). Handbook of Optics: Fundamentals, Techniques, and
Design, 2nd edn, vol. 1, McGraw-Hill.
Baylor, D. A. (1987). Photoreceptor signals and vision. Investigative Ophthalmology &
Visual Science 28:34–49.
Beerends, J. G., de Caluwe, F. E. (1999). The influence of video quality on perceived audio
quality and vice versa. Journal of the Audio Engineering Society 47(5):355–362.
Blackwell, K. T. (1998). The effect of white and filtered noise on contrast detection
thresholds. Vision Research 38(2):267–280.
Blakemore, C. B., Campbell, F. W. (1969). On the existence of neurons in the human visual
system selectively sensitive to the orientation and size of retinal images. Journal of
Physiology 203:237–260.
Bolin, M. R., Meyer, G. W. (1999). A visual difference metric for realistic image synthesis.
In Proc. SPIE Human Vision and Electronic Imaging, vol. 3644, pp. 106–120, San Jose,
CA.
Boynton, G. A., Foley, J. M. (1999). Temporal sensitivity of human luminance pattern
mechanisms determined by masking with temporally modulated stimuli. Vision
Research 39(9):1641–1656.
Braddick, O., Campbell, F. W., Atkinson, J. (1978). Channels in vision: Basic aspects. In
Held, R., Leibowitz, H. W., Teuber, H L. (eds), Perception, vol. 8 of Handbook of
Sensory Physiology, pp. 3–38, Springer-Verlag.
Bradley, A. P. (1999). A wavelet visible difference predictor. IEEE Transactions on Image
Processing 8(5):717–730.
Brainard, D. H. (1995). Colorimetry. In Bass, M. (ed. in chief), Handbook of Optics:
Fundamentals, Techniques, and Design, 2nd edn, vol. 1, chap. 26, McGraw-Hill.
Breitmeyer, B. G., Ogmen, H. (2000). Recent models and findings in visual backward
masking: A comparison, review and update. Perception & psychophysics 72(8):1572–
1595.
Burbeck, C. A., Kelly, D. H. (1980). Spatiotemporal characteristics of visual mechanisms:
Excitatory-inhibitory model. Journal of the Optical Society of America 70(9):1121–
1126.
Campbell, F. W., Gubisch, R. W. (1966). Optical quality of the human eye. Journal of
Physiology 186:558–578.
Campbell, F. W., Robson, J. G. (1968). Application of Fourier analysis to the visibility of
gratings. Journal of Physiology 197:551–566.
Carney, T., Klein, S. A., Hu, Q. (1996). Visual masking near spatiotemporal edges. In
Proc. SPIE Human Vision and Electronic Imaging, vol. 2657, pp. 393–402, San Jose,
CA.
Carney, T. et al. (2000). Modelfest: Year one results and plans for future years. In Proc.
SPIE Human Vision and Electronic Imaging, vol. 3959, pp. 140–151, San Jose, CA.
Carney, T. et al. (2002). Extending the Modelfest image/threshold database into the spatio-
temporal domain. In Proc. SPIE Human Vision and Electronic Imaging, vol. 4662, pp.
138–148, San Jose, CA.
Carpenter, R. H. S. (1988). Movements of the Eyes, Pion.
158 REFERENCES
Caviedes, J. E., Oberti, F. (2003). No-reference quality metric for degraded and enhanced
video. In Proc. SPIE Visual Communications and Image Processing, vol. 5150, pp. 621–
632, Lugano, Switzerland.
Cermak, G. W. et al. (1998). Validating objective measures of MPEG video quality. SMPTE
Journal 107(4):226–235.
Charman, W. N. (1995). Optics of the eye. In Bass, M. (ed. in chief), Handbook of Optics:
Fundamentals, Techniques, and Design, 2nd edn, vol. 1, chap. 24, McGraw-Hill.
Chen, C C., Foley, J. M., Brainard, D. H. (2000a). Detection of chromoluminance patterns
on chromoluminance pedestals. I: Threshold measurements. Vision Research 40(7):
773–788.
Chen, C C., Foley, J. M., Brainard, D. H. (2000b). Detection of chromoluminance patterns
on chromoluminance pedestals. II: Model. Vision Research 40(7):789–803.
Cole, G. R., Stromeyer III, C. F., Kronauer, R. E. (1990). Visual interactions with
luminance and chromatic stimuli. Journal of the Optical Society of America A
7(1):128–140.
Coudoux, F X., Gazalet, M. G., Derviaux, C., Corlay, P. (2001). Picture quality measure-
ment based on block visibility in discrete cosine transform coded video sequences.
Journal of Electronic Imaging 10(2):498–510.
Curcio, C. A., Sloan, K. R., Kalina, R. E., Hendrickson, A. E. (1990). Human photoreceptor
topography. Journal of Comparative Neurology 292:497–523.
Curcio, C. A. et al. (1991). Distribution and morphology of human cone photoreceptors
stained with anti-blue opsin. Journal of Comparative Neurology 312:610–624.
Daly, S. (1993). The visible differences predictor: An algorithm for the assessment of image
fidelity. In Watson, A. B. (ed.), Digital Images and Human Vision, pp. 179–206, MIT
Press.
Daly, S. (1998). Engineering observations from spatiovelocity and spatiotemporal visual
models. In Proc. SPIE Human Vision and Electronic Imaging, vol. 3299, pp. 180–191,
San Jose, CA.
Daugman, J. G. (1980). Two-dimensional spectral analysis of cortical receptive field
profiles. Vision Research 20(10):847–856.
Daugman, J. G. (1985). Uncertainty relation for resolution in space, spatial frequency, and
orientation optimized by two-dimensional visual cortical filters. Journal of the Optical
Society of America A 2(7):1160–1169.
Deffner, G. et al. (1994). Evaluation of display-image quality: Experts vs. non-experts. In
SID Symposium Digest, vol. 25, pp. 475–478, Society for Information Display.
de Haan, G., Bellers, E. B. (1998). Deinterlacing – an overview. Proceedings of the IEEE
86(9):1839–1857.
de Ridder, H. (1992). Minkowski-metrics as a combination rule for digital-image-coding
impairments. In Proc. SPIE Human Vision, Visual Processing and Digital Display, vol.
1666, pp. 16–26, San Jose, CA.
de Ridder, H., Blommaert, F. J. J., Fedorovskaya, E. A. (1995). Naturalness and image
quality: Chroma and hue variation in color images of natural scenes. In Proc. SPIE
Human Vision, Visual Processing and Digital Display, vol. 2411, pp. 51–61, San Jose,
CA.
De Valois, R. L., Smith, C. J., Kitai, S. T., Karoly, A. J. (1958). Electrical responses of
primate visual system. I. Different layers of macaque lateral geniculate nucleus. Journal
of Comparative and Physiological Psychology. 51:662–668.
REFERENCES 159
De Valois, R. L., Yund, E. W., Hepler, N. (1982a). The orientation and direction selecitivity
of cells in macaque visual cortex. Vision Research 22(5):531–544.
De Valois, R. L., Albrecht, D. G., Thorell, L. G. (1982b). Spatial frequency selecitivity of
cells in macaque visual cortex. Vision Research 22(5):545–559.
D’Zmura, M. et al. (1998). Contrast gain control for color image quality. In Proc. SPIE
Human Vision and Electronic Imaging, vol. 3299, pp. 194–201, San Jose, CA.
EBU Broadcast Technology Management Committee (2002). The potential impact of flat
panel displays on broadcast delivery of television. Technical Information I34, EBU,
Geneva, Switzerland.
Eckert, M. P., Buchsbaum, G. (1993). The significance of eye movements and image
acceleration for coding television image sequences. In Watson, A. B. (ed.), Digital
Images and Human Vision, pp. 89–98, MIT Press.
Eckstein, M. P., Ahumada, A. J. Jr, Watson, A. B. (1997). Visual signal detection in
structured backgrounds. II. Effects of contrast gain control, background variations, and
white noise. Journal of the Optical Society of America A 14(9):2406–2419.
Endo, C., Asada, T., Haneishi, H., Miyake, Y. (1994). Analysis of the eye movements and
its applications to image evaluation. In Proc. Color Imaging Conference, pp. 153–155,
Scottsdale, AZ.
Engeldrum, P. G. (2000). Psychometric Scaling: A Toolkit for Imaging Systems Develop-
ment, Imcotek Press.
Eriksson, R., Andre
´
n, B., Brunnstro
¨
m, K. (1998). Modelling the perception of digital
images: A performance study. In Proc. SPIE Human Vision and Electronic Imaging, vol.
3299, pp. 88–97, San Jose, CA.
Eskicioglu, A. M., Fisher, P. S. (1995). Image quality measures and their performance.
IEEE Transactions on Communications 43(12):2959–2965.
Faugeras, O. D. (1979). Digital color image processing within the framework of a human
visual model. IEEE Transactions on Acoustics, Speech and Signal Processing
27(4):380–393.
Fedorovskaya, E. A., de Ridder, H., Blommaert, F. J. J. (1997). Chroma variations and
perceived quality of color images of natural scenes. Color Research and Application
22(2):96–110.
Field, D. J. (1987). Relations between the statistics of natural images and the response
properties of cortical cells. Journal of the Optical Society of America A 4(12):2379–
2394.
Foley, J. D., van Dam, A., Feiner, S. K., Hughes, J. F. (1992). Computer Graphics.
Principles and Practice, 2nd edn, Addison-Wesley.
Foley, J. M. (1994). Human luminance pattern-vision mechanisms: Masking experiments
require a new model. Journal of the Optical Society of America A 11(6):1710–
1719.
Foley, J. M., Chen, C C. (1999). Pattern detection in the presence of maskers that differ in
spatial phase and temporal offset: Threshold measurements and a model. Vision
Research 39(23):3855–3872.
Foley, J. M., Yang, Y. (1991). Forward pattern masking: Effects of spatial frequency and
contrast. Journal of the Optical Society of America A 8(12):2026–2037.
Fontaine, B., Saadane, H., Thomas, A. (2004). Perceptual quality metrics: Evaluation of
individual components. In Proc. International Conference on Image Processing ,
pp. 3507–3510, Singapore.
160 REFERENCES
Foster, K. H., Gaska, J. P., Nagler, M., Pollen, D. A. (1985). Spatial and temporal frequency
selectivity of neurons in visual cortical areas V1 and V2 of the macaque monkey.
Journal of Physiology 365:331–363.
Fra
¨
nti, P. (1998). Blockwise distortion measure for statistical and structural errors in digital
images. Signal Processing: Image Communication 13(2):89–98.
Fredericksen, R. E., Hess, R. F. (1997). Temporal detection in human vision: Dependence
on stimulus energy. Journal of the Optical Society of America A 14(10):2557–2569.
Fredericksen, R. E., Hess, R. F. (1998). Estimating multiple temporal mechanisms in
human vision. Vision Research 38(7):1023–1040.
Fuhrmann, D. R., Baro, J. A., Cox, J. R. Jr. (1995). Experimental evaluation of psycho-
physical distortion metrics for JPEG-coded images. Journal of Electronic Imaging
4(4):397–406.
Gastaldo, P., Zunino, R., Rovetta, S. (2002). Objective assessment of MPEG-2 video
quality. Journal of Electronic Imaging 11(3):365–374.
Gescheider, G. A. (1997). Psychophysics: The Fundamentals, 3rd edn, Lawrence Erlbaum
Associates.
Girod, B. (1989). The information theoretical significance of spatial and temporal masking
in video signals. In Proc. SPIE Human Vision, Visual Processing and Digital Display,
vol. 1077, pp. 178–187, Los Angeles, CA.
Gobbers, J F., Vandergheynst, P. (2002). Directional wavelet frames: Design and algo-
rithms. IEEE Transactions on Image Processing 11(4):363–372.
Gonzalez, R. C., Woods, R. E. (1992). Digital Image Processing, Addison-Wesley.
Graham, N., Sutter, A. (2000). Normalization: Contrast-gain control in simple (Fourier)
and complex (non-Fourier) pathways of pattern vision. Vision Research 40(20):2737–
2761.
Grassmann, H. G. (1853). Zur Theorie der Farbenmischung. Annalen der Physik und
Chemie 89:69–84.
Green, D. M., Swets, J. A. (1966). Signal Detection Theory and Psychophysics, John Wiley.
Greenlee, M. W., Thomas, J. P. (1992). Effect of pattern adaptation on spatial frequency
discrimination. Journal of the Optical Society of America A 9(6):857–862.
Gu, L., Bone, D. (1999). Skin colour region detection in MPEG video sequences. In Proc.
International Conference on Image Analysis and Processing, pp. 898–903, Venice, Italy.
Guyton, A. C. (1991). Textbook of Medical Physiology, 7th edn, W. B. Saunders.
Hammett, S. T., Smith, A. T. (1992). Two temporal channels or three? A reevaluation.
Vision Research 32(2):285–291.
Hearty, P. J. (1993). Achieving and confirming optimum image quality. In Watson, A. B.
(ed.), Digital Images and Human Vision, pp. 149–162, MIT Press.
Hecht, E. (1997). Optics, 3rd edn, Addison-Wesley.
Hecht, S., Schlaer, S., Pirenne, M. H. (1942). Energy, quanta and vision. Journal of General
Physiology 25:819–840.
Heeger, D. J. (1992a). Half-squaring in responses of cat striate cells. Visual Neuroscience
9:427–443.
Heeger, D. J. (1992b). Normalization of cell responses in cat striate cortex. Visual
Neuroscience 9:181–197.
Hering, E. (1878). Zur Lehre vom Lichtsinne, Carl Gerolds.
Hess, R. F., Snowden, R. J. (1992). Temporal properties of human visual filters: Number,
shapes and spatial covariation. Vision Research 32(1):47–59.
REFERENCES 161
Hollier, M. P., Voelcker, R. (1997). Towards a multi-modal perceptual model. BT
Technology Journal 15(4):162–171.
Hood, D. C., Finkelstein, M. A. (1986). Sensitivity to light. In Boff, K. R., Kaufman, L.,
Thomas, J. P. (eds), Handbook of Perception and Human Performance, vol. 1, chap. 5,
John Wiley.
Horita, Y. et al. (2003). Evaluation model considering static-temporal quality degradation
and human memory for SSCQE video quality. In Proc. SPIE Visual Communications
and Image Processing, vol. 5150, pp. 1601–1611, Lugano, Switzerland.
Hubel, D. H. (1995). Eye, Brain, and Vision, Scientific American Library.
Hubel, D. H., Wiesel, T. N. (1959). Receptive fields of single neurons in the cat’s striate
cortex. Journal of Physiology 148:574–591.
Hubel, D. H., Wiesel, T. N. (1962). Receptive fields, binocular interaction and functional
architecture in the cat’s visual cortex. Journal of Physiology 160:106–154.
Hubel, D. H., Wiesel, T. N. (1968). Receptive fields and functional architecture of monkey
striate cortex. Journal of Physiology 195:215–243.
Hubel, D. H., Wiesel, T. N. (1977). Functional architecture of macaque striate cortex.
Proceedings of the Royal Society of London B 198:1–59.
Hunt, R. W. G. (1995). The Reproduction of Colour, 5th edn, Fountain Press.
Hurvich, L. M., Jameson, D. (1957). An opponent-process theory of color vision.
Psychological Review 64:384–404.
ITU-R Recommendation BT.500-11 (2002). Methodology for the subjective assessment of
the quality of television pictures. ITU, Geneva, Switzerland.
ITU-R Recommendation BT.601-5 (1995). Studio encoding parameters of digital
television for standard 4:3 and wide-screen 16:9 aspect ratios. ITU, Geneva,
Switzerland.
ITU-R Recommendation BT.709-5 (2002). Parameter values for the HDTV standards for
production and international programme exchange. ITU, Geneva, Switzerland.
ITU-R Recommendation BT.1683 (2004). Objective perceptual video quality measurement
techniques for standard definition digital broadcast television in the presence of a full
reference. ITU, Geneva, Switzerland.
ITU-T Recommendation H.263 (1998). Video coding for low bit rate communication. ITU,
Geneva, Switzerland.
ITU-T Recommendation H.264 (2003). Advanced video coding for generic audiovisual
services. ITU, Geneva, Switzerland.
ITU-T Recommendation J.144 (2004). Objective perceptual video quality measurement
techniques for digital cable television in the presence of a full reference. ITU, Geneva,
Switzerland.
ITU-T Recommendation P.910 (1999). Subjective video quality assessment methods for
multimedia applications. ITU, Geneva, Switzerland.
Jacobson, R. E., (1995). An evaluation of image quality metrics. Journal of Photographic
Science 43(1):7–16.
Jameson, D., Hurvich, L. M. (1955). Some quantitative aspects of an opponent-colors
theory. I. Chromatic responses and spectral saturation. Journal of the Optical Society of
America 45(7):546–552.
Joly, A., Montard, N., Buttin, M. (2001). Audio-visual quality and interactions between
television audio and video. In Proc. International Symposium on Signal Processing and
its Applications, pp. 438–441, Kuala Lumpur, Malaysia.
162 REFERENCES
Jones, C., Atkinson, D. J. (1998). Development of opinion-based audiovisual quality
models for desktop video-teleconferencing. In Proc. International Workshop on Quality
of Service, pp. 196–203, Napa Valley, CA.
Karunasekera, S. A., Kingsbury, N. G. (1995). A distortion measure for blocking artifacts in
images based on human visual sensitivity. IEEE Transactions on Image Processing
4(6):713–724.
Kelly, D. H. (1979a). Motion and vision. I. Stabilized images of stationary gratings. Journal
of the Optical Society of America 69(9):1266–1274.
Kelly, D. H. (1979b). Motion and vision. II. Stabilized spatio-temporal threshold surface.
Journal of the Optical Society of America 69(10):1340–1349.
Kelly, D. H. (1983). Spatiotemporal variation of chromatic and achromatic contrast
thresholds. Journal of the Optical Society of America 73(6):742–750.
Klein, S. A. (1993). Image quality and image compression: A psychophysicist’s viewpoint.
In Watson, A. B. (ed.), Digital Images and Human Vision, pp. 73–88, MIT Press.
Klein, S. A., Carney, T., Barghout-Stein, L., Tyler, C. W. (1997). Seven models of masking.
In Proc. SPIE Human Vision and Electronic Imaging, vol. 3016, pp. 13–24, San Jose, CA.
Koenderink, J. J., van Doorn, A. J. (1979). Spatiotemporal contrast detection threshold
surface is bimodal. Optics Letters 4(1):32–34.
Kuffler, S. W. (1953). Discharge pattern and functional organisation of mammalian retina.
Journal of Neurophysiology 16:37–68.
Kutter, M., Winkler, S. (2002). A vision-based masking model for spread-spectrum image
watermarking. IEEE Transactions on Image Processing 11(1):16–25.
Lai, Y K., Kuo, C C. J. (2000). A Haar wavelet approach to compressed image quality
measurement. Visual Communication and Image Representation 11(1):17–40.
Lee, S., Pattichis, M. S., Bovik, A. C. (2002). Foveated video quality assessment. IEEE
Transactions on Multimedia 4(1):129–132.
Legge, G. E., Foley, J. M. (1980). Contrast masking in human vision. Journal of the Optical
Society of America 70(12):1458–1471.
Lehky, S. R. (1985). Temporal properties of visual channels measured by masking. Journal
of the Optical Society of America A 2(8):1260–1272.
Li, B., Meyer, G. W., Klassen, R. V. (1998). A comparison of two image quality models. In
Proc. SPIE Human Vision and Electronic Imaging, vol. 3299, pp. 98–109, San Jose, CA.
Liang, J., Westheimer, G. (1995). Optical performances of human eyes derived from
double-pass measurements. Journal of the Optical Society of America A 12(7):1411–
1416.
Lindh, P., van den Branden Lambrecht, C. J. (1996). Efficient spatio-temporal decom-
position for perceptual processing of video sequences. In Proc. International Con-
ference on Image Processing, vol. 3, pp. 331–334, Lausanne, Switzerland.
Lodge, N. (1996). An introduction to advanced subjective assessment methods and the
work of the MOSAIC consortium. In MOSAIC Handbook, pp. 63–78.
Losada, M. A., Mullen, K. T. (1994). The spatial tuning of chromatic mechanisms identified
by simultaneous masking. Vision Research 34(3):331–341.
Losada, M. A., Mullen, K. T. (1995). Color and luminance spatial tuning estimated by noise
masking in the absence of off-frequency looking. Journal of the Optical Society of
America A 12(2):250–260.
Lu, Z. et al. (2003). PQSM-based RR and NR video quality metrics. In Proc. SPIE Visual
Communications and Image Processing, vol. 5150, pp. 633–640, Lugano, Switzerland.
REFERENCES 163