Báo cáo sinh học: " Genetic diversity of a large set of horse breeds raised in France assessed by microsatellite polymorphism" pdf
Bạn đang xem bản rút gọn của tài liệu. Xem và tải ngay bản đầy đủ của tài liệu tại đây (1.44 MB, 12 trang )
BioMed Central
Page 1 of 12
(page number not for citation purposes)
Genetics Selection Evolution
Open Access
Research
Genetic diversity of a large set of horse breeds raised in France
assessed by microsatellite polymorphism
Grégoire Leroy*
1,2
, Lucille Callède
1,2
, Etienne Verrier
1,2
, Jean-
Claude Mériaux
3
, Anne Ricard
4
, Coralie Danchin-Burge
1,2
and
Xavier Rognon
1,2
Address:
1
AgroParisTech, UMR1236 Génétique et Diversité Animales, 16 rue Claude Bernard F-75321 Paris, France,
2
INRA, UMR1236 Génétique
et Diversité Animales, 78352 Jouy-en-Josas, France,
3
LABOGENA, F-78352 Jouy-en-Josas, France and
4
INRA, UR631 Station d'amélioration
génétique des animaux, BP 52627, 31326 Castanet-Tolosan, France
Email: Grégoire Leroy* - ; Lucille Callède - ;
Etienne Verrier - ; Jean-Claude Mériaux - ;
Anne Ricard - ; Coralie Danchin-Burge - ;
Xavier Rognon -
* Corresponding author
Abstract
The genetic diversity and structure of horses raised in France were investigated using 11
microsatellite markers and 1679 animals belonging to 34 breeds. Between-breed differences
explained about ten per cent of the total genetic diversity (Fst = 0.099). Values of expected
heterozygosity ranged from 0.43 to 0.79 depending on the breed. According to genetic
relationships, multivariate and structure analyses, breeds could be classified into four genetic
differentiated groups: warm-blooded, draught, Nordic and pony breeds. Using complementary
maximisation of diversity and aggregate diversity approaches, we conclude that particular efforts
should be made to conserve five local breeds, namely the Boulonnais, Landais, Merens, Poitevin and
Pottok breeds.
Introduction
During the twentieth century, horse breeding has under-
gone large changes in Europe. Previously considered as an
agricultural, industrial and war tool, horse is now essen-
tially bred for hobby riding. Draught horses, in particular,
have been less and less used as utility horses, and many
draught breeds have undergone a dramatic decrease in
population size: according to the Haras Nationaux, out of
the nine French draught breeds, six have annual births
below 1000. Measures for in situ conservation have been
applied in France for several years but such measures are
in general expensive. Therefore, it would be useful to iden-
tify priorities among conservation purposes and this
requires characterising diversity and genetic relations
between breeds [1].
During the last fifteen years, microsatellite markers have
frequently been used to evaluate genetic distances and to
characterise local breeds, [2-10]. Some methods have
recently been developed to evaluate the genetic contribu-
tion of populations to within-breed and between-breed
diversities [11,12].
Published: 5 January 2009
Genetics Selection Evolution 2009, 41:5 doi:10.1186/1297-9686-41-5
Received: 16 December 2008
Accepted: 5 January 2009
This article is available from: />© 2009 Leroy et al; licensee BioMed Central Ltd.
This is an Open Access article distributed under the terms of the Creative Commons Attribution License ( />),
which permits unrestricted use, distribution, and reproduction in any medium, provided the original work is properly cited.
Genetics Selection Evolution 2009, 41:5 />Page 2 of 12
(page number not for citation purposes)
With about 800 000 animals belonging to 50 different
breeds (source: Haras Nationaux), France shows a large
diversity of horse populations. Among these breeds, 21
have a French origin or have been bred in France for at
least a century. According to the FAO, at least 15 popula-
tions have disappeared during the last 50 years, and eight
indigenous breeds are still considered as endangered or
endangered-maintained. Among those breeds, the major-
ity are draught breeds, namely the Ardennais, Auxois,
Boulonnais, Poitevin and Trait du Nord breeds, the other
ones being the Merens warm-blooded breed and the
Landais and Pottock pony breeds. Information on the
genetic diversity of French endangered breeds could help
breeders and providers, decide where they should place
more emphasis.
In the present study, we first analysed the genetic diversity
of 39 horse populations reared in France: within-breed
diversity, breed relationship and population structure
were investigated, using microsatellite data. Then, we
focussed on 19 breeds of French origin or having been
raised in France for at least a century, and evaluated the
conservation priorities between these populations, using
different approaches to evaluate within, between and total
diversity.
Methods
Populations sampled and microsatellite analysis
French nomenclature divides horse breeds into three
groups: warm-blooded, draught horses and ponies. In this
study, 39 populations were considered (Table 1). These
39 populations comprised 31 recognised breeds (includ-
ing 13 warm-blooded breeds, nine draught breeds, and
nine pony breeds), the primitive Przewalski horse (used
as an outgroup), and seven populations originating from
the splitting of two recognised breeds, namely the Anglo-
Arab (AA) and Selle Français (SF) breeds (divided into
four and three groups, respectively). The 2005 studbook
rules define those groups according to the proportion of
foreign genes that can be found from genealogical analy-
sis: AA6 and AA9 are considered as pure AA, whereas AA5
and AA10 can have ancestors from another origin, the
proportion of Arab origin being higher for AA5 and AA6
than the others. SF8 has a large proportion of PS origin
and can therefore be used to produce AA, SFA97 consti-
tutes a group closed to direct foreign influences, whereas
SFB98 individuals can have a parent from another breed
(under some conditions).
For each of the 39 populations, 23 to 50 animals born
between 1996 and 2005, were sampled amounting to
1679 animals. Except for the Przewalski horse, where no
pedigree data was available, the sampled animals were
known to have no common parents. For the conservation
approach, the study focussed on 19 populations, either of
French origin, or having been bred in France for at least
100 years (PS, AA and AR breeds). In this approach, 50
animals were randomly sampled among the four and
three AA and SF subpopulations, respectively, to consti-
tute two populations.
Eleven microsatellite markers were used to perform the
analysis (AHT4, AHT5, ASB2, HMS1, HMS3, HMS6,
HMS7, HTG4, HTG6, HTG10, VHL20), with all but two
(HMS1 and HTG6) being recommended by the Interna-
tional Society of Animal Genetics for parentage testing
and used in similar studies (except HMS1) [7,9,10]. For
the entire sample, amplifications and analyses were per-
formed by the same laboratory, using a capillary
sequencer (ABI PRISM 3100 Genetic Analyzer, Applied
Biosystems).
Statistical analysis
Allele frequencies, mean number of alleles (MNA),
observed (Ho) and non-biased expected heterozygosity
(He), were calculated using GENETIX [13]. Wright Fis, Fit
and Fst coefficients were also computed using the same
software. GENEPOP [14] was used to evaluate pairwise
genetic differentiation between breeds [15] and departure
from Hardy-Weinberg equilibrium, using exact tests and
sequential Bonferonni correction [16] on loci. Global
tests on Hardy-Weinberg equilibrium were also per-
formed using GENEPOP. Allelic richness was computed
using FSTAT [17].
The matrix of Reynolds unweighted distances D
R
[18] was
computed using POPULATION (Olivier Langella; http://
bioinformatics.org/~tryphon/populations/). Regarding
the D
R
distance, a NeighborNet tree was drawn using
SPLITSTREE 4.8 [19]. A factorial correspondence analysis
(without the Przewalsky horse) was also performed using
GENETIX. Finally, the genetic structure of the populations
was assessed using Bayesian clustering methods devel-
oped by Pritchard (STRUCTURE, [20]): using a model
with admixture and correlated allele frequencies, we made
20 independent runs for each value of the putative
number of sub-populations (K) between 1 and 22, with a
burn-in period of 20 000 followed by 100 000 MCMC
repetitions. Pairwise similarities (G) between runs were
computed using CLUMPP [21].
To evaluate the conservation priorities in a set of popula-
tions, taking into account contributions to within-popula-
tion and between-population genetic diversity, Ollivier
and Foulley [12] have proposed the following method.
First, the between-breed contribution (CB) is evaluated,
based on the Weitzman [22] loss Vk of diversity when the
population k is removed from the whole set of breeds (in
this study we used D
R
distance). Then, the within-breed
contribution (CW) is defined as:
Genetics Selection Evolution 2009, 41:5 />Page 3 of 12
(page number not for citation purposes)
Table 1: Basic information on the 39 populations studied
Population code Breed Type
a
Country
b
Nb of foals registered in 2005 Sample size
c
AA10 Anglo-Arab W France 282 50 (13)
AA5 781 50 (11)
AA6 244 50 (15)
AA9 252 50 (11)
APPAL Appaloosa W USA 84 29
AB Arab-Barb W Morocco 71 38
AR Arab W France 1267 50
ARD Ardennais D France 645 50
AUX Auxois D France 130 35
BA Barb W Morocco 99 24
BOUL Boulonnais D France 290 49
BR Breton D France 3548 50
CAM Camargue W France 468 37
CO Connemara Pony P Ireland 456 49
COBND Cob Normand D France 495 50
COMT Comtois D France 4173 50
FJ Fjord P Norway 237 33
FRI Friesian W The Netherlands 53 37
HAF Haflinger P Austria 344 32
IS Iceland Pony W Iceland 96 48
LAND Landais P France 31 27
LUS Lusitanian W Portugal 312 50
MER Merens W France 443 32
NF New Forrest Pony P UK 119 45
PER Percheron D France 1309 50
PFS Poney français de selle P France 1069 50
POIT Poitevin D France 90 35
POT Pottok P France 170 50
Genetics Selection Evolution 2009, 41:5 />Page 4 of 12
(page number not for citation purposes)
CW = 1 - H(S/k)/H(S) (1)
where H(S) is the average internal heterozygosity of the
whole set S and H(S/k) the average internal heterozygosity
of the set when k is removed. Finally, the aggregate diver-
sity D of a population is defined as:
D = F
st
CB + (1 - F
st
)CW.(2)
The cryopreservation potential (CP) could be computed
as the product between the breed contribution (CB) and
the probability of extinction (P
ex
) of the breed, assumed to
be directly proportional to the inbreeding rate (
Δ
F). Fol-
lowing Simianer et al. [23], P
ex
can be approximated as
P
ex
= c
Δ
F = c/(2Ne) = c (M + F)/8 MF (3)
where Ne is the effective population size, M and F are the
numbers of breeding males and females, respectively,
used inside the breed in 2005, and c is a constant, to be
chosen. Considering that the effective population size of a
breed should not be lower than 50 to avoid extinction in
the short term [24], we considered that P
ex
= 1 for Ne = 50.
Therefore, c was set to 100 (see equation 3).
Caballero and Toro [11] have developed a parallel
approach. The total diversity GD
T
can be considered as the
exact sum of the gene diversity within population GD
WS
and the gene diversity between populations GD
BS
consid-
ering the following equations:
GD
T
= 1 - Σ
i
Σ
j
f
ij
/n
2
(4)
GD
WS
= 1 - Σ
i
f
ii
/n (5)
GD
BS
= Σ
i
Σ
j
D
ij
/n
2
(6)
where n is the number of populations, f
ij
is the average
coancestry between populations I and j, and D
ij
is the Nei
minimum distance between populations I and j. The con-
tribution of a population to the diversity is evaluated by
computing the loss or gain of diversity
Δ
GD when the
population is removed.
The authors have also proposed to evaluate the contribu-
tions (c
i
) of each population, which can maximise the
total diversity at the next generation, using the following
equation:
GD
TN
= 1 - Σ
i
c
i
[f
ii
- Σ
j
D
ij
c
j
]. (7)
The contributions can be computed by maximising GD
TN
in equation (7), with the following restrictions: for each
population i, c
i
≥ 0 and Σ
i
c
i
= 1.
PRE Pure Spanish Horse W Spain 146 50
PRW Przewalsky horse Pr Mongolia - 26
PS Pur Sang (Thoroughbred) W France 4822 50
QH Quaterhorse W USA 162 41
SF8 Selle Français W France 732 50 (17)
SFA97 5729 50 (20)
SFB98 895 50 (13)
SHE Shetland Pony P UK 402 50
TDN Trait du Nord D France 96 23
TF Trotteur Français W France 10348 50
WAB Welsh Pony P UK 142 39
a
W = warm-blooded horse, D = draught horse, P = pony, Pr = primitive horse
b
France = breeds of French origin or raised in France for at least 100 years; other countries = country of origin for breeds raised in France for less
than 100 years
c
In brackets, number of individuals of each AA and SF subpopulation used when aggregating the four and three subpopulations, respectively
Table 1: Basic information on the 39 populations studied (Continued)
Genetics Selection Evolution 2009, 41:5 />Page 5 of 12
(page number not for citation purposes)
Results
Genetic variations
One hundred and nine alleles were found over all popu-
lations and all markers. The average number of alleles per
locus was 9.8 ranging from seven (locus HTG4 and
HMS1) to 15 (locus ASB2). Some rare alleles in the whole
data set were found with a high frequency in the PRW
population: for instance, with the HTG6 loci, the two
most frequent alleles in the PRW population (70%) were
seldom found in other breeds (less than 1%). Heterozy-
gosities, mean number of alleles (MNA) and allelic rich-
ness (AR) are presented in Table 2. MNA and AR were
highly correlated, (r = 0.98, P < 0.0001). He ranged from
0.43 in the FRI breed to 0.79 in the PFS breed, while Fis
per breed ranged from -0.08 (TDN breed) to 0.11 (PRE
breed).
Some significant heterozygote deficits after corrections
were found, for different loci and populations (see Table
2). Only one test exhibited significant excess (AA5 with
HMS1). Using global tests, five populations (AB, AR, AUX,
CAM, PRE) and two markers (HMS3 and HTG10) showed
significant deficit in heterozygotes (P < 0.01). Other stud-
ies have shown similar results for these two markers [4].
Testing population differentiation, 11 pairs of popula-
tions were found non significantly differentiated out of
the 741 tests performed: AA5 with AA6, AA9 with AA10,
Table 2: Values for parameters of polymorphism within the 39 populations studied
Population code He Ho F
is
HWE deficiency MNA AR
AA10 0.71 0.72 -0.01 0 5.45 5.0
AA5 0.73 0.71 0.03 0 5.73 5.4
AA6 0.73 0.71 0.03 0 5.91 5.3
AA9 0.69 0.70 -0.01 0 4.91 4.6
APPAL 0.77 0.72 0.06 0 7.55 6.9
AB 0.76 0.74 0.03 1 7.00 6.7
AR 0.72 0.66 0.08 1 6.09 5.4
ARD 0.64 0.62 0.03 0 6.09 5.5
AUX 0.65 0.62 0.05 1 6.00 5.5
BA 0.74 0.74 0.00 0 7.00 6.8
BOUL 0.62 0.60 0.03 1 5.09 4.7
BR 0.66 0.67 -0.02 0 6.36 5.8
CAM 0.73 0.68 0.07 1 6.36 6.0
CO 0.75 0.73 0.03 1 6.64 6.1
COBND 0.72 0.73 -0.01 0 6.64 6.1
COMT 0.69 0.67 0.03 2 6.00 5.6
FJ 0.67 0.69 -0.03 0 6.00 5.6
FRI 0.43 0.43 0.00 0 3.45 3.2
HAF 0.65 0.62 0.05 0 4.82 4.6
IS 0.70 0.68 0.03 1 6.27 5.7
LAND 0.75 0.71 0.05 1 6.82 6.6
LUS 0.74 0.71 0.04 1 6.27 5.9
MER 0.70 0.71 -0.01 0 5.91 5.6
NF 0.76 0.74 0.03 1 7.64 6.9
PER 0.68 0.69 -0.01 0 6.64 6.0
PFS 0.79 0.79 0.00 0 8.09 7.2
POIT 0.57 0.58 -0.02 0 4.82 4.4
POT 0.77 0.79 -0.03 0 7.82 7.1
PRE 0.70 0.62 0.11 1 6.55 5.7
PRW 0.59 0.56 0.05 0 3.73 3.7
PS 0.69 0.70 -0.01 0 5.00 4.6
QH 0.73 0.72 0.01 0 7.00 6.2
SF8 0.71 0.73 -0.03 0 5.55 4.9
SFA97 0.74 0.73 0.01 0 6.27 5.7
SFB98 0.75 0.75 0.00 0 7.00 6.1
SHE 0.69 0.65 0.06 0 6.00 5.2
TDN 0.64 0.69 -0.08 0 5.36 5.3
TF 0.70 0.69 0.01 1 6.27 5.5
WAB 0.76 0.74 0.03 0 7.55 7.0
He = non biased heterozygosity; Ho = observed heterozygosity; MNA = mean number of alleles; AR = allelic richness; HWE deficiency: number of
loci deviating from Hardy-Weinberg equilibrium after Bonferroni correction
Genetics Selection Evolution 2009, 41:5 />Page 6 of 12
(page number not for citation purposes)
SF8 and PS, PS and SF8, AA10 with SF8 and PS, AB with
BA, APPAL with QH, AUX with TDN, SFA97 with
SFB98.
The Fis, Fit, and Fst values were 0.019, 0.116 and 0.099,
respectively. We found a gene differentiation coefficient
G
ST
[25] of 0.0989.
Breed relationships and clustering
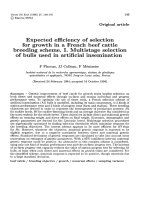
The NeighborNet network (Figure 1) clearly separated
draught horses (also including MER, HAF breeds) and
warm-blooded horses, whereas most pony breeds were
placed between these two groups. Nordic (IS, SHE, FJ)
breeds formed a separate group. FRI and PRW popula-
tions were isolated from the other breeds, the closest
groups being draught horses and Nordic breeds, for the
FRI breed and PRW population, respectively.
Neighbour-Net for the 39 horse populations, based on Reynolds D
R
distanceFigure 1
Neighbour-Net for the 39 horse populations, based on Reynolds D
R
distance.
Genetics Selection Evolution 2009, 41:5 />Page 7 of 12
(page number not for citation purposes)
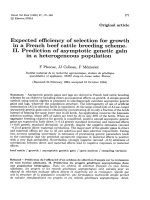
In Figure 2, the 38 populations (PRW being excluded)
were placed according to the two main axes of the corre-
spondence analysis (accounting for 27.4% and 11.5% of
the inertia, respectively). Axis 1 clearly differentiates
warm-blooded horses, ponies and draught horses,
whereas axis 2 separates Nordic horses (IS, SHE, FJ) from
the other ones. The FRI breed seems to be isolated from
the other populations, the closest populations being the
draught breeds.
Neighbornet and FCA approaches were also used on 34
and 33 breeds, respectively (the four samples of AA breed
and three samples of the SF breeds being aggregated into
two samples of 50 animals each), showing similar results
to previous figures (see Additional files 1 and 2).
Breed assignment to clusters provides complementary
information on genetic relationships between popula-
tions. As K increases from 2 to 7, mean similarity coeffi-
cients among runs are respectively equal to 0.997, 0.993,
0.993, 0.773, 0.562, and 0.658, respectively. Likelihood
increased until K reached 15–18 values (see additional file
3), indicating that the most significant subdivisions were
obtained for such values. Since mean similarity coeffi-
cients were slightly lower for K = 16 (0.78) or 17 (0.81)
than for K = 15 (0.83), the results are shown for this last
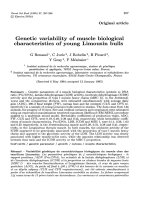
value. Figure 3 shows the assignment of populations to
clusters for each K, using runs having the highest pair-wise
similarity coefficients.
For K = 2, there was a clear separation between draught
and warm-blooded horses, with other populations show-
ing intermediate results. When K reached 3, Nordic/prim-
itive breeds, ponies, and some warm-blooded horses
segregated more or less clearly from the two other clusters.
As K increases to 4 and 5, the five clusters were constituted
of Nordic/primitive breeds, draught horses, ponies,
warm-blooded populations close to the AR breed and
warm-blooded populations close to the PS breed. Some
breeds were shared among the last three clusters, such as
Correspondence analysis of allele frequencies for 38 of the populations studied (PRW is not included)Figure 2
Correspondence analysis of allele frequencies for 38 of the populations studied (PRW is not included). The pro-
jection is shown on the first two axes.
Genetics Selection Evolution 2009, 41:5 />Page 8 of 12
(page number not for citation purposes)
LAND between ponies and AR groups, and APPAL among
the three clusters. When K reached 6, depending on the
runs, FRI or PRW populations were alternately isolated,
which led to a decrease of similarity across runs and
explains the low similarity coefficient (0.562) in compar-
ison with other K. When K = 7, these two populations
were isolated. The different runs highlight some differ-
ences among sub-populations of AA and SF breeds, under-
lining a more important proportion of AR genes in AA6,
AA5 and respectively SFA97 and SF98 groups. Some
warm-blooded (FRI until K = 6, MER) and pony breeds
(HAF) were classified with draught horses, while the CAM
warm-blooded breed was clustered with ponies. As K
reached 15, most breeds were shared among different
clusters. The ARD, AUX and TDN breed constituted a sin-
gle cluster while FJ/IS and LUS/PRE constituted two oth-
ers. In a few cases, a single cluster was essentially
associated to a single breed (BOUL, FRI, SHE, PRW).
Partition of diversity
In the set of the 19 French breeds, we found a gene diver-
sity within population GD
WS
of 0.685, a gene diversity
between populations GD
BS
of 0.073, and a total gene
diversity GD
T
of 0.758. Table 3 shows between-breed,
within-breed, and total contribution/variation of diversity
according to Ollivier and Foulley [12] and Caballero and
Toro [11] approaches. For within-breed diversity, CW and
ΔGD
WS
ranged from -0.48 to 0.50 and from -0.0055 to
0.0069 respectively. In both cases, the POIT breed showed
a particularly low within-breed diversity. CW and ΔGD
WS
were negatively correlated (r = -0.715, P = 0.001). For
between-breed diversity, CB and ΔGD
BS
ranged from 0.85
to 12.60 and from -0.0041 to 0.0024, respectively. Here,
the POIT breed showed a particularly high contribution to
the between-breed diversity. The correlation between CB
and ΔGD
BS
was not significant. D and ΔGD
T
, accounting
for total diversity, were negatively correlated (r = -0.53, P
< 0.019). They ranged from -0.32 to 1.25 and from -
0.0042 to 0.0039, respectively. In both cases, the ARD and
PS breeds showed a particularly low and high diversity,
respectively.
Considering contributions to the between-breed diversity
and probabilities of extinction, the BOUL, LAND and
POIT breeds showed the highest cryopreservation poten-
tials (2.95, 2.95 and 4.83, respectively).
Cluster assignment of each of the 39 populations to the K clusterFigure 3
Cluster assignment of each of the 39 populations to the K cluster. Among 20 runs, solutions having the most similar
pair-wise similarity coefficients are presented here. Breeds not classified in their group according to French nomenclature are
in italic.
Genetics Selection Evolution 2009, 41:5 />Page 9 of 12
(page number not for citation purposes)
Contributions of each population for an optimal GD
T
are
given in Table 3: the composite PFS breed should contrib-
ute to 70% of the pool, for a total GD
T
of 0.79. Besides, to
maximise the total gene diversity, seven of the 19 breeds
should be maintained, namely the BOUL, COBND,
LAND, PFS, POT, PS and SF breeds.
Discussion
Gene diversity and genetic relations among breeds
Differences between breeds explained 10% of the total
genetic variation, which is quite similar to other analyses,
where values ranged from 8% to 15% [2-4,9]. According
to previous studies using microsatellites, expected hetero-
zygosities ranged from 0.47 for the FRI breed [6] to 0.80
for the Sicilian Indigenous breed [6]. In our study, only
one result was found outside this range of values: 0.43 for
the FRI breed, i.e. close to the value found by Luis et al. [6].
Plante et al. [9] recently analysed 22 Canadian and Span-
ish populations. Our estimated values of He were slightly
lower (0.71 on average vs. 0.75, P = 0.048) for the eight
breeds shared between their study and the present one.
Differences on the within-breed diversity among studies
using microsatellites can be explained, on the one hand,
by the loci used and, on the other hand, by the popula-
tions analysed, incidentally belonging to similar breeds
but having different recent histories. In the AR breed, we
found a He value of (0.72) with a significant deficit of het-
erozygotes, which can be explained by the fact that this is
an international breed in which mating between close rel-
atives is common [26]. Plante et al. [9] and Luis et al. [6]
have found similar results for the same breed, but not
Aberle et al. [2] who observed a lower heterozygosity
(0.57) without a heterozygote deficit. The PER population
seemed to have a particularly high genetic diversity in the
Plante study (He = 0.78), in comparison with the French
PER population (He = 0.68). Because PER populations
have been bred in America since the end of the 19
th
cen-
tury, such results should be interpreted bearing in mind
that the French PER population has probably suffered
from recent bottlenecks due to several modifications of
the selection aims.
The three approaches based on genetic relationships
(genetic distances, FCA and clustering methods) gave sim-
ilar results. The populations considered in the present
study can be classified into four more or less differentiated
clusters: warm-blooded, draught, Nordic and pony
breeds. Similar patterns of clustering have been found in
other studies [2,3,9,10]. The draught horses constitute a
quite homogenous group, including the nine French
Table 3: Contributions of the different breeds to genetic diversity according to different approaches
Breed
code
Nb of breeding
animals in 2005
Pr.
extinction
Aggregate diversity and
cryopreservation potential
(Ollivier and Foulley, 2005)
Loss or gain of diversity when a breed is
removed and contributions to optimal
diversity (Caballero and Toro, 2002)
Males Females CW CB D CP ΔGD
WS
ΔGD
BS
ΔGD
T
C
i
AA 119 1443 0.11 0.35 0.85 0.39 0.10 -0.0013 -0.0018 -0.0031 0%
AR 480 2130 0.03 0.29 10.90 1.25 0.35 -0.0015 -0.0010 -0.0026 0%
ARD 187 1417 0.08 -0.48 1.33 -0.32 0.10 0.0031 0.0001 0.0032 0%
AUX 24 248 0.57 -0.19 3.14 0.11 1.79 0.0023 -0.0005 0.0018 0%
BOUL 58 540 0.24 -0.27 12.35 0.87 2.95 0.0040 -0.0023 0.0018 6%
BR 621 6380 0.02 -0.38 5.57 0.16 0.12 0.0016 0.0009 0.0024 0%
CAM 118 837 0.12 0.00 7.99 0.73 0.97 -0.0018 0.0013 -0.0006 0%
COBND 63 760 0.21 -0.06 2.42 0.16 0.52 -0.0017 0.0019 0.0002 2%
COMT 856 7073 0.02 -0.25 3.63 0.11 0.06 0.0000 0.0015 0.0015 0%
LAND 22 73 0.74 0.06 3.99 0.41 2.95 -0.0029 0.0016 -0.0014 2%
MER 93 1012 0.15 -0.04 10.41 0.91 1.53 0.0000 0.0001 0.0001 0%
PER 183 2461 0.07 -0.32 4.60 0.12 0.34 0.0006 0.0014 0.0020 0%
PFS 100 949 0.14 0.39 1.93 0.53 0.27 -0.0055 0.0024 -0.0031 70%
POIT 39 199 0.38 -0.43 12.60 0.75 4.83 0.0069 -0.0030 0.0039 0%
POT 94 910 0.15 0.19 1.33 0.29 0.20 -0.0040 0.0024 -0.0016 5%
PS 369 8049 0.04 0.50 6.17 1.02 0.22 -0.0001 -0.0041 -0.0042 1%
SF 474 11700 0.03 0.45 1.33 0.53 0.04 -0.0024 -0.0013 -0.0037 15%
TDN 16 183 0.85 -0.17 1.93 0.02 1.64 0.0032 -0.0009 0.0022 0%
TF 527 15950 0.02 0.36 7.51 1.01 0.18 -0.0002 -0.0029 -0.0032 0%
Sum 0 100 9.054 0 -0.043 0.043 100%
CW = contribution to within-breed diversity; CB = contribution to between-breed diversity; D = aggregate diversity;CP = Cryopreservation
potential; ΔGD
WS
= Loss or gain of gene diversity within populations when breed is removed; ΔGD
BS
= Loss or gain of gene diversity between
populations when breed is removed; ΔGD
T
= Loss or gain of total diversity when the breed is removed; C
i
= contribution of the breed to optimise
GD
T
Genetics Selection Evolution 2009, 41:5 />Page 10 of 12
(page number not for citation purposes)
draught horse breeds and three breeds presently classified
as pony (HAF) or warm-blooded (MER and FRI in a lesser
extent) breeds. These three breeds were historically used
as draught horse breeds and could therefore have been
subject to crossbreeding with other draught horse popula-
tions in their past history. Pony breeds formed a group in
an intermediate position in comparison to the other clus-
ters. It also included the CAM breed, today recognised as
a warm-blooded breed, but morphologically considered
as a pony [27]. According to our analysis, FRI and PRW
populations were found to be genetically isolated, which
can be, to some extent, linked to a low genetic variability
[28] due to historical bottlenecks within these breeds
[2,29]. Moreover, another parameter explaining isolation
of the PRW breed is the presence of rare alleles, which was
in agreement with other studies [2] and expected for a
population considered as a primitive wild horse.
Population differentiation tests and Bayesian approaches
indicate clear differences between sub-populations of AA
and SF. Such results may be largely explained by differ-
ences in the proportion of thoroughbred (PS) origins in
the gene pool of these sub-populations. Within the AA
breed, AA5 and AA6 populations appeared distinct from
AA9 and AA10 populations and close to the PS breed. This
was in agreement with the studbook rules: on the basis of
pedigree data, AA5, AA6, AA9 and AA10 populations were
indeed found to have respectively 94%, 89%, 44% and
59% of genes from PS origin (Sophie Danvy, personal
communication). Within the SF breed, the SF8 (not differ-
entiated from the PS breed) was distinct from SFA97 and
SFB98 populations. This result was in agreement with pre-
vious results from pedigree data [30]: the SF8 was found
to have 98% of genes from PS origin. The three draught
breeds ARD, AUX and TDN, were found to be quite simi-
lar, which is linked to a common historical and geograph-
ical origin (north of France) [27]. Iberic breeds (LUS and
PRE) were also found to be genetically quite close. These
results and the fact that according to Bayesian approaches,
the likelihood became stable before K reached the
number of breeds, indicate that the most relevant division
is situated at a level superior to that of the breeds [31].
Such a subdivision of the whole set can be explained by
the existing crossbreeding management system in several
horse populations.
Conservation priorities
In the present study, an almost comprehensive sampling
of French breeds was achieved. The different approaches
used gave an estimation of the contribution of each breed
to the whole French horse stock. Petit [32] has proposed
allelic richness as a good parameter to evaluate the genetic
diversity of a population, useful as an indicator of past
bottlenecks [33]. In our study, the POIT breed was found
to have the lowest allelic richness and also one of the low-
est within-breed contributions to diversity according to
the two other methods used in the study. Because of the
strong correlation with the mean number of alleles, the
concept of allelic richness interest seemed to be of limited
value in our study.
The results given by the aggregate diversity and gene diver-
sity approaches were slightly correlated. By definition,
breeds with low contributions to aggregate and total
diversities should have related breeds in the data set. Thus,
ARD, TDN, and AUX breeds, which were genetically
highly related, illustrate quite well such a hypothesis.
According to the approaches of Ollivier and Foulley [33]
and Cabalero and Toro [11], populations that contributed
a lot to the total diversity were mostly non-endangered
breeds (AR, PS, SF, TF). There were, however, some differ-
ences between the two methods when considering the
eight breeds classified as endangered or endangered/
maintained by the FAO (ARD, AUX, BOUL, LAND, MER,
POIT, POT, TDN). Using the approach of Ollivier and
Foulley [33], contributions to aggregate diversity D of
BOUL, MER and POIT breeds were quite high, and taking
into account population size, CP was the highest for
BOUL, LAND and POIT breeds. Using the approach of
Caballero and Toro [11], GD
T
decreased only when LAND
and POT breeds were removed, and those two breeds plus
the BOUL breed should have been kept to optimise GD
T
.
The differences can be explained by the methods used in
the two approaches, particularly considering the evalua-
tion of the contributions to between-diversity. Using the
approach of Caballero and Toro [11], some Weitzman cri-
teria, such as the twin property [22], were not applied: for
instance, assuming that two populations are genetically
identical but very different from the whole set, removing
one of them will largely decrease GD
BS
, which will not be
the case when using the Weitzman approach. However,
one advantage of the approach of Caballero and Toro [11]
is the fact that there is no need to give weight to within-
and between-diversities to compute total diversity, since
by definition GD
T
is the sum of GD
WS
and GD
BS
. In fact,
our results outline that both approaches should be con-
sidered as complementary to identify which breeds have
to be taken into account in a context of genetic resource
management. Therefore, conservation priorities should
concern particularly BOUL, LAND, MER, POIT and POT
breeds.
Another advantage of the method of Caballero and Toro
[11] is the possibility of computing the contribution of
each population to optimise total diversity. Such an
approach was designed to conserve a large diversity of
alleles. Therefore, it is not surprising to notice that the
three breeds (PFS, SF, BOUL) that should have the highest
contribution to optimise genetic diversity represent the
Genetics Selection Evolution 2009, 41:5 />Page 11 of 12
(page number not for citation purposes)
three identified genetic differentiated groups. The impor-
tance of the PFS breed is due to the fact that this synthetic
pony breed has the largest number of alleles. SF, another
composite breed, has a smaller variability but carries alle-
les representative of the warm-blooded breed group,
while the BOUL breed carries alleles seldom present in the
two other breeds but frequent in draught horses.
Finally, several considerations have to be taken into
account before taking final conservation decisions [34],
such as the special range of performances for given traits,
current production systems associated to the breed, socio-
cultural value, or dynamics of the group of breeders.
Between 1998 and 2003, births remained more or less sta-
ble for BOUL, LAND, POIT and POT breeds, but
decreased for the MER breed [35]. In the endangered
breeds, specific uses should be supported to maintain a
demand for such horses (production of mules for the
POIT breed, ecotourism for local breeds, draught activi-
ties, meat production). Genetic variability should also be
managed, especially since some of these breeds constitute
a pool of original genes (BOUL, MER and POIT) (see Fig-
ure 3). For instance, sires with different origins should be
used [36]. When populations of the same breed are raised
in other countries (such as the POT breed in Spain [31]),
regular exchanges should be organised between both
countries to maintain a relatively large variety of repro-
ducers.
Conclusion
Based on this study, horse breeds raised in France can be
clustered into four groups. These groups were found to be
meaningful according to the use of breeds, morphological
characteristics and/or geographical origins. The combined
use of different methods allowed us to identify breeds for
which conservation efforts should be a priority, in order
to preserve the maximum genetic variability. Since several
horse studies have used similar panels of markers
[7,9,10], it would be interesting to merge the correspond-
ing data.
Competing interests
The authors declare that they have no competing interests.
Authors' contributions
JCM carried out the genotyping. AR contributed to the
description of the populations and carried out the sam-
pling collection. LC performed the preliminary analysis.
GL carried out the computational analysis and prepared
the manuscript. XR participated in the computational
analysis and preparation of the manuscript. CDB partici-
pated in the preparation and the revision of the manu-
script. EV participated in the design of the study and the
revision of the manuscript. All authors read and approved
the final manuscript.
Additional material
Acknowledgements
The authors thank the Haras Nationaux for the data provided and Wendy
Brand-Williams for linguistic revision.
References
1. Toro MA, Fernandez J, Caballero A: Scientific basis for policies in
conservation of farm animal genetic resources. Proceedings of
the 8th World Congress on Genetics Applied to Livestock Production: 13–
18 August 2006; Belo Horizonte, Brazil 2006.
2. Aberle KS, Hamann H, Drögemüller C, Distl O: Genetic diversity
in German draught horse breeds compared with a group of
primitive, riding and wild horses by means of microsatellite
DNA markers. Anim Genet 2004, 35:270-277.
3. Bjørnstad G, Gunby E, Røed KH: Genetic structure of Norwe-
gian horse breeds. J Anim Breed Genet 2000, 117:307-317.
4. Cañon J, Checa ML, Carleos C, Vega-Pla JL, Vallejo M, Dunner S: The
genetic structure of Spanish Celtic horse breeds inferred
from microsatellite data. Anim Genet 2000, 31:39-48.
5. Druml T, Curik I, Baumung R, Aberle K, Distl O, Sölknet J: Individ-
ual-based assessment of population structure and admixture
in Austrian, Croatian and German draught horses. Heredity
2007, 98:114-122.
6. Luis C, Juras R, Oom MM, Cothran EG: Genetic diversity and
relationships of Portuguese and other horse breeds based on
protein and microsatellite loci variation. Anim Genet 2007,
38:20-27.
7. Marletta D, Tupac-Yupanqui I, Bordonaro S, Garcia D, Guastella AM,
Criscione A, Cañon J, Dunner S: Analysis of genetic diversity and
the determination of relationships among western Mediter-
ranean horse breeds using microsatellite markers. J Anim
Breed Genet 2006, 123:315-325.
8. Moureaux S, Ricard A, Mériaux JC, Verrier E: Caractérisation
génétique des races françaises de sport et de course et ana-
lyse de leur variabilité génétique. 21ème journée de la recherche
équine, 1995; Les Haras Nationaux, Le Pin-au-Haras 1995:100-105.
9. Plante Y, Vega-Pla JL, Lucas Z, Colling D, de March B, Buchanan F:
Genetic diversity in a feral horse population from sable
island, Canada. J Hered 2007, 98(6):594-602.
10. Solis A, Jugo BM, Mériaux JC, Iriondo M, Mazon LI, Aguirre AI, Vicario
A, Estomba A: Genetic diversity within and among four south
European native horse breeds based on microsatellite DNA
Additional file 1
Supplementary Figure 1. Neighbour-Net for the 34 horse breeds, based
on Reynolds D
R
distance
Click here for file
[ />9686-41-5-S1.tiff]
Additional file 2
Supplementary Figure 2. Correspondence analysis of allele frequencies
for 33 of the populations studied (PRW is not included). The projection is
shown on the first two axes.
Click here for file
[ />9686-41-5-S2.tiff]
Additional file 3
Supplementary Figure 3. Evolution of mean ln of likelihood according to
K on twenty runs (standard deviation indicated)
Click here for file
[ />9686-41-5-S3.tiff]
Publish with Bio Med Central and every
scientist can read your work free of charge
"BioMed Central will be the most significant development for
disseminating the results of biomedical research in our lifetime."
Sir Paul Nurse, Cancer Research UK
Your research papers will be:
available free of charge to the entire biomedical community
peer reviewed and published immediately upon acceptance
cited in PubMed and archived on PubMed Central
yours — you keep the copyright
Submit your manuscript here:
/>BioMedcentral
Genetics Selection Evolution 2009, 41:5 />Page 12 of 12
(page number not for citation purposes)
analysis: implications for conservation. J Hered 2005,
96(6):670-678.
11. Caballero A, Toro MA: Analysis of genetic diversity for the
management of conserved subdivided populations. Conserv
Genet 2002, 3:289-299.
12. Ollivier L, Foulley JL: Aggregate diversity: New approach com-
bining within- and between-breed genetic diversity. Livest Prod
Sci 2005, 95:247-254.
13. Belkhir K, Borsa P, Chikhi L, Raufaste N, Bonhomme F: GENETIX
4.04, Logiciel sous Windows TM pour la Génétique des Pop-
ulations. Laboratoire Génome, Populations, Interactions, CNRS UMR
5000, Université de Montpellier II, Montpellier 2001.
14. Raymond M, Rousset F: GENEPOP (version 1.2): population
genetics software for exact tests and ecumenicism. J Hered
1995, 86:248-249.
15. Goudet J, Raymond M, De Meeüs T, Rousset F: Testing differenti-
ation in diploid populations. Genetics 1996, 144:1933-1940.
16. Rice WR: Analysing table of statistical tests. Evolution 1989,
43:223-225.
17. Goudet J: FSTAT, a program to estimate and test gene diver-
sities and fixation indices (version 2.9.3). 2001 [http://
www2.unil.ch/popgen/softwares/fstat.htm]. Université de Lausanne,
Lausanne, Suisse
18. Reynolds J, Weir BS, Cockerham CC: Estimation of the Coances-
try Coefficient: Basis for a Short-Term Genetic Distance.
Genetics 1983, 105:767-779.
19. Hudson DH, Bryant D: Application of phylogenetic networks in
evolutionary studies. Mol Biol Evol 2006, 23:254-267.
20. Pritchard JK, Wen W: Documentation for STRUCTURE soft-
ware (Version 2). 2003 [
]. University
of Chicago
21. Jakobsson M, Rosenberg NA: CLUMPP: a cluster matching and
permutation program for dealing with label switching and
multimodality in analysis of population structure. Bioinformat-
ics 2007, 23:1801-1806.
22. Weitzman ML: On diversity. Quart J Econom 1992, 107:363-405.
23. Simianer H, Marti SB, Gibson J, Hannotte O, Rege JEO: An approach
to the optimal allocation of conservation funds to minimize
loss of genetic diversity between livestock breeds. Ecol Econ
2003, 45:377-392.
24. FAO: Secondary guidelines for development of national farm
animal genetic resources management plans: Management
of small populations at risk. Rome, Italy 1998.
25. Nei M: Analysis of gene diversity in subdivided populations.
Proc Natl Acad Sci USA 1973, 70:3321-3323.
26. Moureaux S, Verrier E, Ricard A, Mériaux JC: Genetic variability
within French race and riding horse breeds from genealogi-
cal data and blood marker polymorphisms. Genet Sel Evol 1996,
28:83-102.
27. Quittet E, Blanc H: Races chevalines en France 2nd edition. Paris: La
Maison Rustique; 1974.
28. Takezaki N, Nei M: Genetic distances and reconstruction of
phylogenetic tree from microsatellite DNA. Genetics 1996,
144:389-399.
29. Ducro BJ, Bovenhuis H, Neuteboom M, Hellinga I: Genetic diver-
sity in the Dutch Friesian horse. In Proceedings of the 8th World
Congress on Genetics Applied to Livestock Production: 13–18 August 2006
Belo Horizonte, Brazil; 2006.
30. Dubois C, Ricard A: Etat des lieux de la sélection Selle-
Français. Quelle marge de manœuvre possible pour d'autres
plans de sélection? In 31ème journée de la recherche équine: 2 March
2005 Les Haras Nationaux, Le Pin-au-Haras; 2005:173-185.
31. Cañon J, Garcia D, Garcia-Atance MA, Obexer-Ruff G, Lenstra JA,
Ajmone-Marsan P, Dunner S: Geographical partitioning of goat
diversity in Europe and the Middle East. Anim Genet 2006,
37:327-334.
32. Petit RJ, El Mousadik A, Pons O: Identifying populations for con-
servation on the basis of genetic markers. Conserv Biol 1998,
12:844-855.
33. Foulley JL, Ollivier L: Estimating allelic richness and its diver-
sity. Livest Sci 2006, 101:150-158.
34. Reist-Marti SB, Simianer H, Hanotte O, Rege JEO: Weitzman's
approach and Conservation of Breed Diversity: an Applica-
tion to African Cattle Breeds. Conserv Biol 2003, 17:1299-1311.
35. Danvy S, Heydeman P: Le point sur les ressources génétiques
équines en France. In 31ème journée de la recherche équine: 2 March
2005 Les Haras Nationaux, Le Pin-au-Haras; 2005:135-146.
36. Verrier E, Loywick V, Donvez J, Blouin C, Joffrin C, Heyman G, Cot-
trant JF: La gestion génétique des races d'effectifs limités:
principes et application aux cas du cheval de trait Boulonnais
et de l'âne grand noir du Berry. In 31ème journée de la recherche
équine: 2 March 2005 Les Haras Nationaux, Le Pin-au-Haras;
2005:161-171.