Báo cáo sinh học: " Prediction of haplotypes for ungenotyped animals and its effect on marker-assisted breeding value estimation" ppsx
Bạn đang xem bản rút gọn của tài liệu. Xem và tải ngay bản đầy đủ của tài liệu tại đây (755.67 KB, 15 trang )
Genetics
Selection
Evolution
Mulder et al. Genetics Selection Evolution 2010, 42:10
/>Open Access
RESEARCH
BioMed Central
© 2010 Mulder et al; licensee BioMed Central Ltd. This is an Open Access article distributed under the terms of the Creative Commons
Attribution License ( which permits unrestricted use, distribution, and reproduction in
any medium, provided the original work is properly cited.
Research
Prediction of haplotypes for ungenotyped animals
and its effect on marker-assisted breeding value
estimation
Han A Mulder*, Mario PL Calus and Roel F Veerkamp
Abstract
Background: In livestock populations, missing genotypes on a large proportion of animals are a major problem to
implement the estimation of marker-assisted breeding values using haplotypes. The objective of this article is to
develop a method to predict haplotypes of animals that are not genotyped using mixed model equations and to
investigate the effect of using these predicted haplotypes on the accuracy of marker-assisted breeding value
estimation.
Methods: For genotyped animals, haplotypes were determined and for each animal the number of haplotype copies
(nhc) was counted, i.e. 0, 1 or 2 copies. In a mixed model framework, nhc for each haplotype were predicted for
ungenotyped animals as well as for genotyped animals using the additive genetic relationship matrix. The heritability
of nhc was assumed to be 0.99, allowing for minor genotyping and haplotyping errors. The predicted nhc were
subsequently used in marker-assisted breeding value estimation by applying random regression on these covariables.
To evaluate the method, a population was simulated with one additive QTL and an additive polygenic genetic effect.
The QTL was located in the middle of a haplotype based on SNP-markers.
Results: The accuracy of predicted haplotype copies for ungenotyped animals ranged between 0.59 and 0.64
depending on haplotype length. Because powerful BLUP-software was used, the method was computationally very
efficient. The accuracy of total EBV increased for genotyped animals when marker-assisted breeding value estimation
was compared with conventional breeding value estimation, but for ungenotyped animals the increase was marginal
unless the heritability was smaller than 0.1. Haplotypes based on four markers yielded the highest accuracies and when
only the nearest left marker was used, it yielded the lowest accuracy. The accuracy increased with increasing marker
density. Accuracy of the total EBV approached that of gene-assisted BLUP when 4-marker haplotypes were used with a
distance of 0.1 cM between the markers.
Conclusions: The proposed method is computationally very efficient and suitable for marker-assisted breeding value
estimation in large livestock populations including effects of a number of known QTL. Marker-assisted breeding value
estimation using predicted haplotypes increases accuracy especially for traits with low heritability.
Background
In livestock, many QTL regions have been identified for
quantitative traits [1]. In some cases, fine mapping has
also led to the detection of causative mutations, e.g.
DGAT1 in dairy cattle for milk yield and milk composi-
tion [2,3] and IGF2 in pigs for body weight [4]. In breed-
ing programs these QTL-regions can be utilized in
marker-assisted selection (MAS). Three types of markers
can be used: markers in linkage equilibrium with the QTL
(LE-MAS), markers in linkage disequilibrium with the
QTL (LD-MAS) and the causative mutation itself as in
gene-assisted selection (GAS). GAS leads to the highest
genetic gain, because no recombination exists between
the marker and QTL [5]. However, identifying the gene is
not easy and is resource demanding [1]. The amount of
QTL variation explained by markers in LD-MAS can be
increased by increasing the marker density and thereby
* Correspondence:
1
Animal Breeding and Genomics Centre, Wageningen UR Livestock Research,
PO Box 65, 8200 AB Lelystad, The Netherlands
Full list of author information is available at the end of the article
Mulder et al. Genetics Selection Evolution 2010, 42:10
/>Page 2 of 15
increasing the LD between markers and QTL. Alterna-
tively, combining alleles of different marker loci into hap-
lotypes is expected to increase the proportion of captured
QTL variance as well. Based on data of a whole genome
scan with 9323 SNP-markers in Angus cattle, Hayes et al.
[6] have reported that 4 and 6-marker haplotypes
increased the accuracy of MAS more than the single
marker in highest LD with the QTL. However, 2-marker
haplotypes performed worse than the best marker.
One of the challenges when applying MAS in livestock
populations is that often a large part of the population is
not genotyped, i.e. some animals have only phenotypes,
some have only genotypes and others have both genotypes
and phenotypes. Several methods have been proposed to
overcome these differences. For LE-MAS, one would like
to apply a method that uses identity-by-descent (IBD)
information of haplotypes to properly account for relation-
ships between haplotypes of related animals and to
account for phase differences between markers and QTL
in different families [7]. Creation of inverse IBD-matrices
is, however, very time consuming [8]. With high-density
SNP-chips, LD-MAS can be applied without having to use
IBD-matrices. With LD-MAS, either flanking markers or
identical-by-state haplotypes (IBS) can be used in marker-
assisted breeding value estimation. When using flanking
markers in MAS, genotype probabilities could be calcu-
lated with iterative peeling methods [9-13] but these are
time consuming. Gengler et al. [14,15] have proposed a
straightforward and quick method to predict genotype
probabilities and gene contents for bi-allelic markers using
a mixed model methodology, where gene content is the
number of positive (negative) alleles (i.e. 2, 1, 0 for AA, Aa,
aa). For ungenotyped animals, the accuracy of predicted
gene contents is similar whether mixed model equations or
single-marker iterative peeling are used [8,14]. Gengler et
al. [14] suggested that the method can also be applied in
the case of multi-allelic markers. Multi-marker IBS haplo-
types can be considered as a special form of multi-allelic
markers, making the mixed model methodology a candi-
date method to predict haplotypes for ungenotyped ani-
mals.
The objective of this article is to develop a method to
predict haplotypes of animals that are not genotyped
using mixed model equations and to investigate the effect
of using those predicted haplotypes on the accuracy of
marker-assisted breeding value estimation. The method
is evaluated using Monte Carlo simulation, varying hap-
lotype length, heritability of the trait and distance
between the markers. The method is compared to gene-
assisted and conventional breeding value estimation,
which yield, respectively, the upper and lower limit of
accuracy.
Methods
Prediction of haplotypes with missing genotypes
Consider a situation where a QTL-region is mapped for a
trait, without having identified the causative mutation
and where some animals in the population are genotyped
for SNP-markers in that region, but most of them are not
genotyped, which is very common in animal breeding
populations. In this study we would like to use IBS-haplo-
types in marker-assisted breeding value estimation.
When the haplotype is based on the single SNP-marker
closest to the QTL, the method of Gengler et al. [14,15]
can be used to predict the missing 'gene content', the
number of A-alleles, if there are A and a-alleles. The
method of Gengler et al. [14,15] uses the additive genetic
relationship matrix in a mixed model setting to predict
the gene contents of those animals not genotyped based
on genotyped relatives. This method can not be applied
directly for haplotypes based on multiple markers,
because discrete haplotypes can not be directly con-
structed based on predicted continuous gene contents of
SNP-markers for ungenotyped animals. However, this
procedure can be easily modified to apply to a situation
with haplotypes based on multiple markers. Consider
that haplotypes are based on two bi-allelic markers, one
on each side of the QTL. There are four possible haplo-
types. For every genotyped animal, one can infer how
many copies it carries for each haplotype (nhc = number
of haplotype copies), which is 0, 1 or 2 (see Table 1 for a
small example). This is in essence the same as the 'gene
content' for a bi-allelic locus and the same mixed model
methodology with the additive genetic relationship
matrix can be applied to predict the nhc for each haplo-
type for the ungenotyped animals. In the case of n haplo-
types this can be modeled as:
Table 1: Example with four animals with the number of haplotype copies for two SNP-marker haplotypes
Number of haplotype copies (nhc)
Animal Haplotype 1 Haplotype 2 Hap1 (11) Hap2 (12) Hap3 (21) Hap4 (22)
111112 0 0 0
211121 1 0 0
311211 0 1 0
411221 0 0 1
Mulder et al. Genetics Selection Evolution 2010, 42:10
/>Page 3 of 15
where nhc
i
is the number of copies of haplotype i
(which is 0, 1 or 2 effectively), is the population
mean number of copies of haplotype i, d
i
is the EBV for
nhc
i
and is the residual of nhc
i
. Although
for each animal, it is assumed that the haplo-
types are independent from each other; therefore n uni-
variate mixed model analyses can be performed.
Analogous to gene contents for a bi-allelic locus [14], this
can be formulated in mixed model matrix notation as:
where 1 is a vector of ones, M is a design matrix linking
d with nhc
y
, A
-1
is the inverse additive genetic relation-
ship matrix, λ is the variance ratio of residual variance
and additive genetic variance for nhc allowing for a small
proportion of genotyping and haplotyping errors or
recombination , d is a vec-
tor with the EBV for nhc with d
y
for genotyped animals
and d
x
for ungenotyped animals, nhc
y
is a vector with
observed nhc of genotyped animals and is set to missing
for ungenotyped animals. The heritability assumed for
nhc is 0.99. Basically, with no genotyping or haplotyping
errors, (the predicted nhc) should be equal to
the phenotype (the true nhc) for genotyped animals,
implying a heritability of 1.0. In the case of haplotypes,
recombinant haplotypes can be transmitted from one
parent to its offspring. In such a case, the recombinant
haplotype can not be fully explained in the model by the
haplotypes of the parent. This decreases the parent-off-
spring regression, i.e. decreasing the heritability. Here we
set the heritability to 0.99 to allow for some small propor-
tions of genotyping and haplotyping errors and recombi-
nation. Preliminary analysis showed no effect when the
heritability was changed to 0.95.
Marker-assisted breeding value estimation using predicted
haplotypes
To include the effects of the haplotypes to perform
marker-assisted breeding value estimation using best lin-
ear unbiased prediction (MABLUP), these nhc can be
used as covariables in random regression, where inclu-
sion as a random effect is preferred so that effects will be
regressed towards zero when there is hardly any pheno-
typic information, e.g. a certain haplotype appears only in
one animal with a phenotypic record. Assuming no other
systematic environmental effects, the model is as follows:
where y is the phenotype, μ is the overall mean and
modeled as a fixed effect, u
pol
is the random polygenic
EBV, , which is the predicted number of
copies of haplotype i, h
i
is the random regression coeffi-
cient for haplotype i and e is the residual. In matrix nota-
tion the model can be summarized as:
where X and Z are the design matrices for fixed effects
and polygenic breeding values, respectively, the matrix W
contains the for all haplotypes, λ
pol
and λ
h
are respec-
tively the variance ratios for the polygenic breeding val-
ues and the random regression on , b is the vector
with solutions for fixed effects (in this case only the
mean), u
pol
is the vector with u
pol
and h
i
is the vector with
h
i
. The variance of h
i
is (see Appendix for
derivation), where is the additive genetic QTL-vari-
ance, and the variance of u
pol
is , where
is the additive genetic variance due to the polygenic
effect. Equations (3) and (4) can be considered as a gener-
nhc d e
i nhc i nhc
ii
=++
m
(1)
m
nhc
i
e
nhc
i
nhc
i
i
n
=
∑
=
1
2
1’1 1’M
M’1 M’M A
d
d
1’nhc
M’nhc
1
y
y
+
⎡
⎣
⎢
⎢
⎤
⎦
⎥
⎥
⎡
⎣
⎢
⎢
⎢
⎤
⎦
⎥
⎥
⎥
=
⎡
⎣
−
nhc
y
x
⎢⎢
⎢
⎤
⎦
⎥
⎥
(2)
ls s
==
ea
nhc nhc
22
001 099/./.
ud
nhc i
i
+
yu nhche
pol i i
i
n
=+ + ×
()
+
∑
m
ˆ
(3)
nhc d
inhc i
i
ˆ
=+
m
X’X X’Z X’W
Z’X Z’Z A Z’W
W’X W’Z W’W
b
u
h
1
+
+
⎡
⎣
⎢
⎢
⎢
⎤
⎦
⎥
⎥
⎥
⎡
⎣
⎢
−
pol
h
pol
i
⎢⎢
⎢
⎤
⎦
⎥
⎥
⎥
=
⎡
⎣
⎢
⎢
⎢
⎤
⎦
⎥
⎥
⎥
X’y
Z’y
w’y
i
nhc
ˆ
nhc
i
ˆ
ss
hA
qtl
22
05= .
s
A
qtl
2
ss
uA
pol pol
22
=
s
A
pol
2
λ
m
λ
λ
Mulder et al. Genetics Selection Evolution 2010, 42:10
/>Page 4 of 15
alization of the method by Gengler et al. [14,15] to multi-
allelic markers and haplotypes.
Evaluation of method
Simulation
Monte Carlo simulation was used to evaluate the method.
The simulation scheme represented a nested full-sib half-
sib design (multiple offspring per mating and dam nested
within sire) with discrete generations which is common
in commercial animal breeding programs. The simula-
tion scheme was identical to that reported in Mulder et
al. [8]. One trait was simulated with additive genetic
effects of one bi-allelic QTL A
qtl
, a polygenic additive
genetic effect A
pol
and a residual effect e (P = A
qtl
+ A
pol
+e). All animals had phenotypic records. Because the
method of MABLUP relies on linkage disequilibrium
(LD) between markers and QTL, first, 100 generations of
random mating were performed prior to the data collec-
tion scheme (generation 101 - 105).
In the first 100 generations, 50 sires and 50 dams were
randomly mated each generation. The QTL and 20 bi-
allelic markers were placed on one 1 M long chromo-
some. The QTL was placed in the middle of the chromo-
some and the markers were equally spaced, their distance
varying from 0.1 to 5 cM. The QTL was in the middle of
the marker bracket between marker 10 and 11. In the
founder generation, all markers and the QTL were in
linkage equilibrium and had a fixed allele frequency of
0.5. The QTL-variance was set to 15% of the total
genetic variance, when the allele frequency is 0.5. The
allele substitution effect was set to ,
assuming that the allele frequencies p and q are 0.5, which
is the case in the founder generation. Recombination
rates were calculated using Haldane's mapping function
[16]. During these 100 generations, some markers or the
QTL became fixed due to drift.
After establishing LD, from generation 101 onwards
and for each generation 50 sires and 250 dams were
selected based on conventional BLUP-EBV (Equation (3)
without haplotype effects) and randomly mated to pro-
duce 2,000 offspring. Each sire was mated to five dams
and each dam produced four male and four female off-
spring, resulting in that each sire had 40 half-sib off-
spring, five full-sib groups of eight full-sibs. A total of five
generations of phenotypic data (generation 101 - 105)
were created and used in breeding value estimation
(10,000 animals in total). The animals of generation 101
served as base generation in the pedigree. The genera-
tions 102 - 104 were used to create linkage disequilibrium
due to selection [17].
In generation 101, simulated polygenic effects were
sampled from N(0, ), where is the polygenic
genetic variance. In subsequent generations polygenic
effects were sampled from N(0.5 A
pol, s
+ 0.5 A
pol, d
, 0.5
(1 - f
p
)), where f
p
is the average inbreeding coeffi-
cient of the parents. Inbreeding coefficients were calcu-
lated using the Meuwissen and Luo [18] algorithm.
Residual effects were sampled from N(0, ), where
is the residual variance.
The overall heritability was set to 0.03, 0.10 or 0.30,
while the QTL explained 15% of the total genetic variance
when the allele frequency was 0.5 as it was in the founder
generation. The phenotypic variance was 1.0 in all situa-
tions when the allele frequency of the QTL was 0.5. The
realized variance of the QTL was lower due to deviations
of the allele frequency from 0.5 and re-estimated in gen-
eration 101. Results were based on 200 effective replicates
after discarding the replicates with minor allele frequency
of the QTL in the last generation (generation 105) less
than 0.05. Averaged over all effective replicates, the aver-
age allele frequency of the negative QTL-allele was 0.63
in generation 101 before selection started and deviated
from 0.5, because in replicates with allele frequencies
closer to 0, the QTL was more likely to become fixed in
generations 101-105 due to selection. The used parame-
ter values are listed in Table 2.
Haplotype methods used for marker-assisted breeding value
estimation
In this study we used three types of haplotypes: 1) the
closest neighboring left marker of the QTL is used as a
single-marker haplotype (NM), 2) both flanking markers
closest to the QTL-locus are used to form a 2-marker
haplotype (HAP2) and 3) on both sides the two markers
closest to the QTL are used to form a 4-marker haplotype
(HAP4). In the case of NM, Equation (3) and (4) reduced
to the method by Gengler et al. [14,15] with the differ-
ence that in this case it was not the causative mutation,
but a linked marker. In addition, = α
2
, where α is the
allele substitution effect (see equation A1 in the Appen-
s
A
qtl
2
apq
A
qtl
=
s
2
2/
s
A
pol
2
s
A
pol
2
s
A
pol
2
s
e
2
s
e
2
s
h
2
Mulder et al. Genetics Selection Evolution 2010, 42:10
/>Page 5 of 15
dix), because we modeled only one SNP marker allele.
The markers chosen to form haplotypes had minor allele
frequencies of at least 5% in generation 105. Haplotypes
were known from the simulation and thus, phasing was
not needed.
Genotyping and breeding value estimation
In generation 105, the breeding program starts with
MABLUP according to Equation (3) and (4) using the
three different haplotype methods. We simulated three
genotyping scenarios: (1) only sires and males in the last
generation are genotyped and (default) (2) all males are
genotyped and (3) all animals are genotyped. In scenario
1 and 2, females are not genotyped. In addition to MAB-
LUP, gene-assisted BLUP (GABLUP) and conventional
BLUP (CONBLUP) are also performed for comparison.
For GABLUP, it is assumed that all animals are genotyped
for the QTL. For GABLUP the model is equal to Equation
(3), with the difference that the true gene content is used
as nhc and the variance is the same as for NM. For CON-
BLUP, Equation (3) is used without regression on nhc and
the variance of the additive genetic effect is set to
. For all evaluations, mixed model
equations were solved using MiX99, which makes use of
the preconditioned conjugate gradient algorithm [19].
The mixed model equations were considered converged
when the relative difference between the left-hand and
right-hand sides of the mixed model equations was
smaller than 1.0 * 10
-10
.
Accuracies were calculated as correlations between
estimated and true breeding values. The QTL-EBV was
calculated as for each animal. The total
EBV was calculated as the sum of the QTL-EBV and the
polygenic EBV. Accuracies of MABLUP were compared
to those of GABLUP and CONBLUP. The accuracies of
GABLUP and CONBLUP can be considered as the upper
and lower limits for the MABLUP accuracy. In addition,
regressions of true breeding values on estimated breeding
values were calculated to get an idea of the over- (regres-
sion coefficient < 1.0) or underestimation (regression
coefficient > 1.0) of the variance of EBV. Bias of estimated
breeding values was calculated as estimated breeding val-
ues minus true breeding values. In addition, accuracies of
were calculated as correlations between estimated
and true nhc and regressions of true on estimated nhc
were calculated.
Proportion of QTL-variance explained by the haplotypes
The proportion of QTL-variance explained by the three
different haplotypes NM, HAP2 and HAP4 was calcu-
lated to assess whether using IBS-haplotypes was suit-
able. The proportion of QTL-variance explained by the
ss s
uA A
pol qtl
22 2
=+
nhc h
ii
i
n
ˆ
×
()
∑
nhc
ˆ
Table 2: Parameter values for simulation
Parameter Default value Alternative values
Number of sires per generation 50
Number of dams per generation 250
Total number of animals 10,000
Number of progeny per dam 8
Number of generations 5
Heritability 0.3 0.03 and 0.10
Proportion of genetic variance explained
by QTL
0.15
Number of markers simulated 20
Distance between markers 0.1 cM 0.5, 1.0, 2.0, 5.0 cM
Number of markers used 10
Number of replicates 200
Mulder et al. Genetics Selection Evolution 2010, 42:10
/>Page 6 of 15
haplotypes is also a measure of linkage disequilibrium
between the haplotype and the QTL. For NM, the r
2
between the marker and the QTL can be calculated as the
squared correlation between them [20]. For multi-allelic
haplotypes, such as HAP2 and HAP4, r
2
was calculated
according to Equation (2) in Hayes et al. [6], based on an
equation for multi-allelic markers by Zhao et al. [21].
Results
Analysis of haplotypes
Statistics of predicted number of haplotype copies
Table 3 shows the mean, standard deviation and mean
square error (MSE) for predicted number of haplotype
copies (nhc) for ungenotyped animals as a function of the
true number of haplotype copies. For all three methods,
the predicted nhc increased with the true nhc and a clear
distinction was made in nhc between animals carrying
the haplotype or not. For genotyped animals the pre-
dicted nhc closely resembled the true nhc. For ungeno-
typed animals, the absolute numbers decreased from NM
towards HAP4, due to regression to the mean and the
mean nhc decreased from NM towards HAP4, albeit the
difference between homozygotic carrier and non-carrier
is largest for HAP4. As a consequence, the MSE increased
with increasing true nhc for HAP2 and HAP4 and for
HAP4 more than for HAP2. In general, the mean nhc
decreased with the frequency of the haplotype (results
not shown).
Table 4 shows the accuracy of predicted nhc and the
regression of true nhc on predicted nhc for ungenotyped
females. The accuracy decreased from NM towards
HAP4, especially for HAP4, due to recombination
between genotyped ancestors and ungenotyped off-
spring. Especially for HAP4, the accuracy decreased
when the marker distance increased, which is again due
to a higher probability of recombination (results not
shown). The regression of true nhc on predicted nhc was
approximately 1 for NM and HAP2, but somewhat lower
for HAP4, due to the lower accuracy.
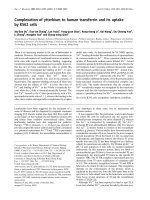
Proportion of QTL-variance explained by haplotype
Figure 1 shows the mean proportion of QTL variance (r
2
)
explained by the haplotype as a function of marker dis-
Table 3: Summary statistics of predicted number of haplotype copies for ungenotyped animals
Haplotype method True nhc
Mean SD
MSE
NM 0 0.590.080.54
1 0.990.090.20
2 1.430.080.52
HAP2 0 0.340.060.27
1 0.760.080.24
2 1.240.080.75
HAP4 0 0.160.040.11
1 0.580.060.32
2 1.130.080.90
Mean, standard deviation (SD) and mean square error (MSE) of predicted number of haplotype copies (nhc) for neighboring marker (NM), 2-
marker haplotype (HAP2) and 4-marker haplotypes (HAP4) for ungenotyped animals in the last generation (females) as a function of true nhc
(sires and males in last generation are genotyped; distance between markers is 0.1 cM, heritability is 0.30, the QTL explains 15% of the genetic
variance, results are averages of 200 replicates)
Table 4: Accuracy and regression coefficients of predicted number of haplotype copies for ungenotyped animals
Haplotype method Accuracy nhc (se)
Regression
1
true nhc on predicted nhc (se)
NM 0.643 (0.003) 1.005 (0.004)
HAP2 0.630 (0.007) 0.994 (0.022)
HAP4 0.595 (0.012) 0.914 (0.038)
Accuracy of number of haplotype copies (nhc) and regression of true nhc on predicted nhc for neighboring marker (NM), 2-marker haplotype
(HAP2) and 4-marker haplotypes (HAP4) for ungenotyped animals in the last generation (females) (sires and males in last generation are
genotyped; distance between markers is 0.1 cM, heritability is 0.30, the QTL explains 15% of the genetic variance, results are averages of 200
replicates)
1
Regressions where the variance of the predicted nhc was smaller than 0.0001 were omitted (denominator of regression coefficient)
Mulder et al. Genetics Selection Evolution 2010, 42:10
/>Page 7 of 15
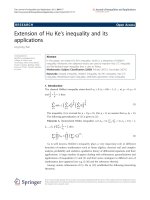
tance. For all three methods, r
2
decreased with increasing
marker distance. The HAP4 method captured most of the
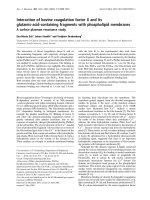
QTL variance and NM the least. Figure 2 shows the fre-
quency distribution of r
2
values for the three methods at a
marker density of 0.1 cM. It shows that HAP4 had the
highest proportion of replicates with r
2
values between
0.90 and 1.00. With NM and HAP2, a substantial propor-
tion of replicates had r
2
values below 20% indicating that
the haplotype explained very little QTL-variance.
Accuracy of EBV
Effect of genotyping scenario
Table 5 shows the accuracies of QTL-EBV, polygenic EBV
and total EBV for genotyped males and ungenotyped
females under different genotyping scenarios with the
three methods of MABLUP when the marker distance
was 0.1 cM. The accuracy of polygenic and total EBV
hardly changed when the number of genotyped animals
increased. The accuracy of QTL-EBV increased only
slightly with an increasing number of genotyped animals.
This means that the use of predicted haplotypes in MAB-
LUP did not negatively affect the accuracy of EBV.
Because of the small differences in accuracy, in the rest of
the article we only show results under the scenario where
sires and males in the last generation were genotyped.
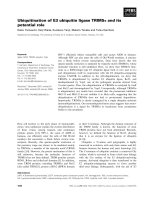
Effect of marker density
Figure 3 shows the accuracy of QTL-EBV (panel A and B)
and total EBV (Panel C and D) for genotyped males
(panel A and C) and ungenotyped females (panel B and
Figure 1 Mean proportion of QTL-variance explained by haplo-
types as a function of distance between SNP-markers. Mean pro-
portion of QTL-variance explained by neighboring marker (NM), 2-
marker haplotype (HAP2) and 4-marker haplotype (HAP4); average of
200 replicates.
0.00
0.20
0.40
0.60
0.80
1.00
0.0 1.0 2.0 3.0 4.0 5.0
Distance between SNP markers
in cM
Mean proportion of QTL
variance explained by
haplotype
NM HAP2 HAP4
Figure 2 Frequency distribution of QTL-variance explained by haplotypes. Proportion of replicates per 0.1-bin class of proportion of QTL vari-
ance (r
2
) explained by neighboring marker (NM), 2-marker haplotype (HAP2) and 4-marker haplotype (HAP4); average of 200 replicates; sires and males
in last generation are genotyped; distance between markers is 0.1 cM.
0
0.1
0.2
0.3
0.4
0.5
0.6
0.7
0.8
0.05 0.15 0.25 0.35 0.45 0.55 0.65 0.75 0.85 0.95
r
2
value (bin mid-point)
Proportion of replicates
NM HAP2 HAP4
Mulder et al. Genetics Selection Evolution 2010, 42:10
/>Page 8 of 15
D) as a function of marker distance using three different
haplotype methods for MABLUP or using CONBLUP or
GABLUP when all animals were genotyped. For geno-
typed males (Figure 3A) the accuracy of the QTL-EBV
was between 0.22 and 0.90 for NM, HAP2 and HAP4 and
1.0 for GABLUP. Among the three haplotype methods,
HAP4 had the highest accuracy and NM the lowest. The
accuracy decreased with increasing marker distance and
more rapidly for HAP4 than for NM, due to a decreasing
proportion of QTL variance explained by the haplotypes
(Figure 1). For ungenotyped females (Figure 3B), the
accuracy of the QTL-EBV was much lower than for geno-
typed males, between 0.15 and 0.57 for NM, HAP2 and
HAP4, but with the same trends across marker distances
as for genotyped animals. The MABLUP methods based
on HAP2 and HAP4 were both able to increase substan-
tially the accuracy of the total EBV of genotyped males in
comparison to CONBLUP when the distance between
the markers was small (Figure 3C). The accuracy of
MABLUP with HAP4 approached the accuracy of gene-
assisted BLUP when the marker distance was 0.1 cM or
less. The advantage of MABLUP was negligible when the
marker distance was large, e.g. 5 cM. For ungenotyped
animals (Figure 3D), the increase in accuracy of total EBV
of MABLUP over conventional BLUP was, however, neg-
ligible regardless of marker distance.
Although the average accuracy of QTL-EBV was mod-
erate to high for genotyped males when markers were
separated by 0.1 cM, substantial variation existed
between replicates (Figure 4). Especially with NM, the
variation between replicates was large and even negative
accuracies were obtained, although in a very small pro-
portion of the replicates (5.5% of replicates). With HAP4,
accuracies of QTL-EBV were always positive and in 86.5%
of the replicates larger than 0.80. With HAP2 this propor-
tion equaled to 60% and with NM only to 30.5%. The fig-
ure clearly shows that HAP4 had not only the highest
average accuracy, but also the least variation in accuracy
of QTL-EBV.
Effect of heritability
Table 6 shows the accuracies of QTL-EBV, polygenic EBV
and total EBV for genotyped males and ungenotyped
females using different values of heritability in the three
MABLUP methods when the marker distance was 0.1
Table 5: Accuracy of EBV for genotyped males and ungenotyped females in different genotyping scenarios
Genotyped Ungenotyped
EBV
Scenario
2
NM HAP2 HAP4 NM HAP2 HAP4
QTL sires +
males last
0.534 0.775 0.912 0.336 0.491 0.580
all males
genotyped
0.534 0.774 0.926 0.337 0.493 0.591
all
genotyped
0.534 0.776 0.932
Polygenic only sires +
males last
0.567 0.576 0.583 0.566 0.575 0.582
all males
genotyped
0.567 0.577 0.584 0.566 0.576 0.583
all
genotyped
0.567 0.578 0.586
Total only sires +
males last
0.605 0.616 0.622 0.595 0.596 0.596
all males
genotyped
0.605 0.616 0.624 0.595 0.596 0.596
all
genotyped
0.606 0.617 0.625
Accuracies
1
of QTL-EBV, polygenic EBV and total EBV for different genotyping scenarios for marker-assisted BLUP with neighboring marker
(NM), 2-marker haplotype (HAP2) and 4-marker haplotypes (HAP4) (distance between markers is 0.1 cM, heritability is 0.30, the QTL explains
15% of the genetic variance, results are averages of 200 replicates)
1
Standard errors were between 0.005 and 0.021 for QTL_EBV, between 0.002 and 0.003 for polygenic and total EBV;
2
in the first scenario sires
from generation 101-104 and males in generation 105 were genotyped (1,200 genotyped animals); in scenario 2 all males were genotyped
(5,000 genotyped animals) and in the last scenario all animals are genotyped (10,000 genotypes)
Mulder et al. Genetics Selection Evolution 2010, 42:10
/>Page 9 of 15
cM. The accuracy of QTL-EBV increased with increasing
heritability, as expected. However, the increase in accu-
racy of total EBV of MABLUP methods in comparison to
CONBLUP was largest with a low heritability. For
ungenotyped animals, the increase in accuracy with
MABLUP in comparison to CONBLUP was smaller, e.g.
from 0.35 to 0.37 with HAP4 at a heritability of 0.03, but
the increase in accuracy was negligible when the herita-
bility was 0.30. HAP4 had in all cases the highest accura-
cies for QTL-EBV, polygenic EBV and total EBV, i.e. the
ranking of the methods did not change.
Table 7 shows the regression of true on estimated
breeding values for different values of heritability for the
three MABLUP methods when the marker distance was
0.1 cM for genotyped males and ungenotyped females.
The regressions for QTL-EBV were substantially lower
Figure 3 Accuracy of QTL-EBV and total EBV as a function of marker distance for genotyped males and ungenotyped females. Accuracy of
QTL-EBV and total EBV for marker-assisted BLUP with neighboring marker (NM), 2-marker haplotype (HAP2) and 4-marker haplotype (HAP4), gene-
assisted BLUP (GABLUP) when all animals are genotyped and conventional BLUP (CONBLUP); panels A and B: accuracy of QTL-EBV; panels C and D
accuracy of total EBV; for MABLUP, sires and males in the last generation were genotyped, the rest was not genotyped, heritability is 0.30, the QTL
explains 15% of the genetic variance, results are averages of 200 replicates.
Mal es
0.00
0.20
0.40
0.60
0.80
1.00
012345
Distance between SNP markers
in cM
Accuracy QTL-EBV
GABLUP
NM
HAP2
HAP4
A
Females
0.00
0.20
0.40
0.60
0.80
1.00
012345
Distance between SNP markers
in cM
Accuracy QTL-EBV
GABLUP
NM
HAP2
HAP4
B
Mal es
0.58
0.60
0.62
0.64
012345
Distance between SNP markers
in cM
Accuracy total EBV
GABLUP
CONBLUP
NM
HAP2
HAP4
C
Females
0.58
0.60
0.62
0.64
012345
Distance between SNP markers
in cM
Accuracy total EBV
GABLUP
CONBLUP
NM
HAP2
HAP4
D
Mulder et al. Genetics Selection Evolution 2010, 42:10
/>Page 10 of 15
Figure 4 Frequency distribution of accuracy of QTL-EBV of genotyped animals. Proportion of replicates per 0.1-bin-class for accuracy of QTL-EBV
of genotyped animals for neighboring marker (NM), 2-marker haplotype (HAP2) and 4-marker haplotype (HAP4); sires and males in last generation are
genotyped, distance between markers is 0.1 cM, heritability is 0.3, the QTL explains 15% of the genetic variance, average of 200 replicates.
0
0.1
0.2
0.3
0.4
0.5
0.6
0.7
0.8
-0.25 -0.15 -0.05 0.05 0.15 0.25 0.35 0.45 0.55 0.65 0.75 0.85 0.95
Accuracy QTL-EBV genotyped animals (bin mid-point)
Proportion of replicates
NM HAP2 HAP4
Table 6: Accuracies of QTL-EBV, polygenic EBV and total EBV for genotyped males and ungenotyped females
Genotyped Ungenotyped
EBV
h
2
CONBLUP NM HAP2 HAP4 NM HAP2 HAP4
QTL 0.03 0.568 0.723 0.796 0.371 0.475 0.524
0.10 0.542 0.770 0.865 0.349 0.493 0.554
0.30 0.534 0.775 0.912 0.336 0.491 0.580
Polygenic 0.03 0.333 0.336 0.336 0.335 0.339 0.339
0.10 0.444 0.452 0.456 0.454 0.444 0.452
0.30 0.567 0.576 0.583 0.566 0.575 0.582
Total 0.03 0.351 0.387 0.407 0.418 0.362 0.368 0.371
0.10 0.465 0.488 0.508 0.516 0.468 0.471 0.472
0.30 0.594 0.605 0.616 0.622 0.595 0.596 0.596
Accuracies
1
of QTL-EBV, polygenic EBV and total EBV for different values of heritability for marker-assisted BLUP with neighboring marker
(NM), 2-marker haplotype (HAP2) and 4-marker haplotypes (HAP4) and conventional BLUP (CONBLUP) (sires and males in last generation are
genotyped; distance between markers is 0.1 cM, the QTL explains 15% of the genetic variance, results are averages of 200 replicates)
1
Standard errors were between 0.007 and 0.022 for QTL-EBV, between 0.002 and 0.006 for polygenic EBV and between 0.002 and 0.005 for
total EBV
Mulder et al. Genetics Selection Evolution 2010, 42:10
/>Page 11 of 15
Table 7: Regression coefficients of estimated breeding values for genotyped males and ungenotyped females
Genotyped Ungenotyped
EBV
h
2
CONBLUP NM HAP2 HAP4 NM HAP2 HAP4
QTL 0.03 0.867 1.115 1.143 0.797 1.109 1.165
0.10 0.772 0.899 0.955 0.809 0.889 0.953
0.30 0.869 0.909 0.917 0.744 0.884 0.910
Polygenic 0.03 0.945 0.962 0.970 0.948 0.965 0.975
0.10 0.950 0.973 0.985 0.951 0.973 0.985
0.30 0.951 0.966 0.976 0.954 0.965 0.973
Total 0.03 0.972 0.954 0.991 0.986 0.989 0.997 0.989
0.10 0.987 0.981 0.975 0.974 1.022 1.014 1.011
0.30 0.966 1.000 0.988 0.979 1.032 1.029 1.026
Regression
1
of true on estimated breeding values for QTL-EBV, polygenic EBV and total EBV for genotyped males and ungenotyped females
for different values of heritability for marker-assisted BLUP with neighboring marker (NM), 2-marker haplotype (HAP2) and 4-marker
haplotypes (HAP4) and conventional BLUP (CONBLUP) (sires and males in last generation are genotyped; distance between markers is 0.1 cM,
the QTL explains 15% of the genetic variance, results are averages of 200 replicates)
1
Standard errors were between 0.015 and 0.060 for QTL_EBV, between 0.004 and 0.015 for polygenic EBV and between 0.004 and 0.014 for
total EBV; regressions where the variance of the predicted nhc was smaller than 0.0001 were omitted (denominator of regression coefficient)
Table 8: Bias in estimated breeding values for genotyped males and ungenotyped females
Genotyped Ungenotyped
EBV
h
2
CONBLUP NM HAP2 HAP4 NM HAP2 HAP4
QTL 0.03 -0.008 -0.007 -0.001 -0.009 -0.007 -0.001
0.10 -0.022 -0.013 0.000 -0.023 -0.014 -0.002
0.30 -0.057 -0.028 0.008 -0.060 -0.032 0.003
Polygenic 0.03 0.006 0.002 -0.003 0.006 0.001 -0.003
0.10 0.064 0.049 0.035 0.064 0.049 0.035
0.30 0.125 0.086 0.053 0.126 0.087 0.055
Total 0.03 0.007 -0.002 -0.005 -0.004 -0.003 -0.006 -0.005
0.10 0.042 0.041 0.035 0.034 0.041 0.035 0.034
0.30 0.036 0.068 0.058 0.061 0.067 0.055 0.058
Bias
1
(estimated - true breeding value) in QTL-EBV, polygenic EBV and total EBV for genotyped males and ungenotyped females for different
values of heritability for marker-assisted BLUP with neighboring marker (NM), 2-marker haplotype (HAP2) and 4-marker haplotypes (HAP4)
and conventional BLUP (CONBLUP) (sires and males in last generation are genotyped; distance between markers is 0.1 cM, the QTL explains
15% of the genetic variance, results are averages of 200 replicates)
1
Standard errors were between 0.003 and 0.012 for h
2
= 0.03, between 0.005 and 0.025 for h
2
= 0.10 and between 0.009 and 0.037 for h
2
= 0.30
Mulder et al. Genetics Selection Evolution 2010, 42:10
/>Page 12 of 15
than 1.0 in the majority of the situations, except when the
heritability was 0.03. This indicated that the variance of
the QTL-effect was overestimated when the heritability
was 0.10 and 0.30. HAP4 had regression coefficients clos-
est to 1.0 indicating that in this case, overestimation was
the smallest. Regressions for polygenic and total EBV
were in most cases close to one. The variances of the
polygenic EBV were slightly overestimated in all cases.
The variances of the total EBV were slightly overesti-
mated for genotyped males for CONBLUP and MABLUP
and slightly underestimated for ungenotyped females
with MABLUP, but overestimated with CONBLUP. Over-
all, the variance of total EBV was less biased with MAB-
LUP than with CONBLUP.
Table 8 shows the bias in estimated breeding values for
different values of heritability using the three MABLUP
methods and CONBLUP for genotyped males and
ungenotyped females when the marker distance was 0.1
cM. The polygenic EBV were on average biased upwards
and the QTL-EBV were biased downwards, or in other
words the QTL-effects were underestimated, but the
polygenic EBV absorbed this effect. The total EBV were
biased upwards for all methods when the heritability was
0.10 and 0.30, due to the shift of the estimated mean in
the model, which was caused by genetic trend due to
selection and the change in allele frequency of the QTL.
Bias was largest for NM, whereas HAP2 and HAP4 were
similar. Without selection total EBV were unbiased
(results not shown). There was hardly any difference in
bias between genotyped males and ungenotyped females.
Adding the overall mean to the EBV removed the bias in
total EBV. It can be concluded that total EBV of MABLUP
and EBV of CONBLUP were biased due to selection, but
this bias did no affect the ranking of animals.
Discussion
In this study we developed a method to predict haplo-
types of ungenotyped animals using pedigree information
of genotyped animals in mixed model equations and we
evaluated the use of these predicted haplotypes in
marker-assisted BLUP. The method is an extension of
Gengler et al. [14,15] to multi-allelic markers or haplo-
types. The method was evaluated with Monte Carlo sim-
ulation. Clearly the predicted number of haplotype copies
was regressed towards the mean and more so than the
gene contents in Gengler et al. [14,15], especially when
the frequency of a certain haplotype was low, which is
more likely with longer haplotypes because of an increas-
ing number of haplotypes. When using only a neighbor
marker, the predicted gene contents were in the same
range as in Gengler et al. [14,15]. Because of the almost-
unity heritability the number of haplotype copies is
hardly regressed towards the mean for genotyped ani-
mals. The accuracy of the predicted haplotypes was lower
for HAP4 than for HAP2 and decreased with increasing
marker distance due to the increased probability of
recombination. Lowering the heritability might be an
option, taking into account that the number of haplotype
copies from parent to offspring is not fully heritable but
subject to recombination. However, BLUP is very robust
against changes in heritability and preliminary results
showed no effect when the heritability was changed to
0.95.
The 4-marker haplotype gave the best results in
marker-assisted breeding value estimation. It captured
90% of the QTL-variance when markers were separated
by 0.1 cM. Because of this high proportion of explained
QTL-variance, the proportion of QTL-variance explained
by the haplotype can not increase much, and therefore we
did not consider longer haplotypes. Furthermore, longer
haplotypes are more subject to recombination, decreas-
ing the accuracy of predicted number of haplotype cop-
ies. Hayes et al. [6] found that 6-marker haplotypes
explained more QTL-variance than 4-marker haplotypes,
but had much lower proportions of QTL-variance
explained by the markers due to lower marker density
and lower LD. Hayes et al. [6] found that the increase in
accuracy was much higher with haplotypes than with
using a neighbor marker in agreement with this study.
Calus et al. [22] investigated the use of different defini-
tions of haplotypes on the accuracy of genomic selection
and found that with a high marker density the regression
on single SNP worked almost as well as haplotypes with
two markers. In their study all SNP were used for a single
SNP regression, whereas in this study only one SNP was
used to estimate the QTL-effect. This disfavored the
neighbor marker method in our study, although the rank-
ing of the alternatives is the same as in Calus et al. [22]. In
the context of QTL fine-mapping, Grapes et al. [23]
found that single marker regression with 10 markers per-
formed worse than an IBD-method using linkage disequi-
librium and linkage analysis information with a haplotype
window of 10 markers, but single marker regression per-
formed similarly when 20 markers were used. Zhao et al.
[24] found that the power of a model with regression on
two or four SNP yielded higher power to detect QTL than
2- or 4-marker haplotypes. This suggests that ranking of
methods for QTL mapping might be different than for
accuracy of marker-assisted or genomic selection [25].
The proportion QTL-variance explained by the haplo-
types or the neighbor marker (r
2
) was higher than in
Hayes et al. [6]. At marker distances ranging from 0.1 to
1.0 cM, estimated r
2
in cattle populations have been
found lower (~0.05 - 0.27) than those found in this simu-
lation study [6,26-28]. However, in pig and poultry popu-
lations higher r
2
have been estimated (~0.20-0.50 in pigs
and poultry) [29,30], resembling the observed r
2
in our
study. The r
2
between neighbor marker and QTL or
Mulder et al. Genetics Selection Evolution 2010, 42:10
/>Page 13 of 15
between pairs of markers followed the expected r
2
based
on distance in cM and the effective population size [31].
The lower r
2
values found at short distance in cattle popu-
lations is probably due to much higher effective popula-
tion sizes in the past, because LD at short distances
reflects more the past effective population size [32]. As a
consequence of lower LD at short distances in cattle, a
higher SNP density than that used in this study is neces-
sary to achieve in cattle the same accuracy of QTL-EBV
as presented here.
Haplotypes were assumed to be unrelated in this study
and it was assumed that the same QTL-allele is linked to
a certain haplotype (identity-by-state = IBS). Due to
recombination, linkage phases between haplotypes and
QTL may be different in different families. In the context
of genomic selection, Calus et al. [22] compared 2-
marker IBS-haplotypes with 2- and 10-marker identity-
by-descent haplotypes using combined linkage disequi-
librium linkage analysis information (LDLA) to construct
the inverse IBD-matrices. They found that IBD-haplo-
types yielded higher accuracies, especially when using 10-
marker windows, but at the cost of much higher comput-
ing time. The difference between IBS and IBD-haplotypes
decreased with increasing marker density. Therefore, in
our study it is unlikely that IBD-haplotypes would
increase accuracy significantly when the distance
between the markers is less than 0.1 cM.
A major disadvantage of using haplotypes is the need to
phase the data. Hayes et al. [6] estimated the effect of
haplotyping errors on the proportion of QTL-variance
explained by the haplotypes in their data set and found a
limited effect, but suggested that phasing errors are
dependent on the data structure used. Accurate and fast
algorithms are available for use in livestock populations
[33,34,28]. Windig and Meuwissen [34] have shown that
their algorithm is very fast and yields almost perfect hap-
lotype reconstruction with dense marker maps in pedi-
greed populations. Its performance was similar to that of
SIMWALK2 [35] in terms of accuracy, but with a much
lower computing time. Furthermore, the presented
method can accommodate haplotyping errors, e.g. by
adjusting the heritability of nhc to a lower value, albeit at
the expense of a lower accuracy.
The major advantage of the method used in this study
is its computing efficiency, because optimized BLUP soft-
ware can be used to predict haplotypes. The computation
time was respectively ~4, 6 and 10 s for neighboring
marker (NM), 2-marker haplotypes (HAP2) and 4-
marker haplotypes (HAP4) to predict the genotypes/hap-
lotypes on a dual-processor 64-bit Windows PC with 2.40
GHz and 36 GB of RAM; programs were compiled for 32-
bit. Therefore, breeding companies do not need other
software for imputing genotypes, which is usually much
slower and much more memory intensive, prohibiting its
use for large populations, e.g. with more than a million
animals. An additional advantage is that no assumptions
are needed on where ungenotyped animals should appear
in the pedigree, it can handle all possible scenarios.
Therefore, the proposed method is very suitable for appli-
cation of marker-assisted breeding value estimation in
large populations, such as national evaluations in cattle.
Also for genomic selection purposes the method is very
useful, e.g. for 50,000 SNP-markers it would take only
about two days on a single processor to predict all SNP-
genotypes or haplotypes for a similar number of animals
as in this study.
The use of 4-marker haplotypes (HAP4) increased the
accuracy of marker-assisted breeding value estimation
substantially in comparison to conventional breeding
value estimation for genotyped animals, but the benefit
for ungenotyped animals was small in agreement with
Mulder et al. [8]. However, with a low heritability,
ungenotyped animals gained considerably in accuracy.
This can be visualized by approximating the accuracy of
the total EBV (r
totalEBV
) as:
where q
2
is the proportion of genetic variance explained
by the haplotypes (= , where is the accu-
racy of the QTL-EBV and Q
2
is the amount of genetic
variance explained by the QTL), is the accuracy of
the polygenic EBV and r
h
is the accuracy of the predicted
number of haplotype copies. If we take the situation
where the heritability is 0.03, the distance between mark-
ers is 0.1 cM and the QTL explains 15% of the genetic
variance, is 0.34 (Table 6) and we assume that q
2
is
0.10 (assuming = 0.8 (Table 6)), then Equation (5)
yields r
totalEBV
= 0.374, close to the value in Table 6. Using
Equation (5), we can also quantify the benefit of genome-
wide EBV for ungenotyped animals. Lets assume that we
can explain 90% of the genetic variance by markers (q
2
=
0.9), then we can increase r
totalEBV
up to 0.58 assuming
that is constant. So even for ungenotyped animals
genome-wide EBV can increase accuracy in comparison
to conventional BLUP, especially for low heritability
traits, when their paternal ancestors are genotyped.
rqrqr
totalEBV A h
pol
=− +()1
22 22
(5)
rQ
A
qtl
22
×
r
A
qtl
r
A
pol
r
A
pol
r
A
qtl
r
A
pol
Mulder et al. Genetics Selection Evolution 2010, 42:10
/>Page 14 of 15
Conclusions
In this study we show that mixed model equations can be
used to predict number of haplotype copies for ungeno-
typed animals and these predicted number of haplotype
copies can be used in marker-assisted breeding value esti-
mation. Four-marker haplotypes give the highest accu-
racy for total estimated breeding values. The accuracy of
the total EBV increases for genotyped animals, but for
ungenotyped animals the increase is marginal unless the
heritability is smaller than 0.1. The method works best
when the distance between the markers is less than 1 cM.
The proposed method is computationally very efficient
and suitable to apply for marker-assisted breeding value
estimation in large livestock populations including effects
of a number of known QTL. Marker-assisted breeding
value estimation using predicted haplotypes increases
accuracy especially for traits with low heritability. It is
expected that genomic selection for ungenotyped animals
using predicted haplotypes or marker genotypes will be
beneficial especially for low heritable traits.
Appendix
Derivation of haplotype variance used in mixed models
Assuming that the haplotypes explain 100% of the QTL-
variance, the variance of haplotype effects used in
Equation (4) can be calculated similarly to the variance
when regressing on one bi-allelic marker/QTL:
where α is the allele substitution effect, p is the allele
frequency of one of the two SNP-alleles. Extrapolating
the result of Equation (A1) to n haplotypes yields:
where m
i
is the frequency of haplotype i. Assuming
equal frequencies of all n haplotypes yields:
The limit of Equation (A3) is:
showing that the variance of haplotype i is half the
additive genetic variance of the QTL with an infinite
number of haplotypes. Although the result in Equation
(A2) depends on haplotype frequencies and number of
haplotypes, preliminary analyses showed that using the
result of Equation (A4) yields high accuracies of QTL-
EBV. Furthermore, these preliminary analyses showed
that the accuracy of the QTL-EBV is insensitive to .
Competing interests
The authors declare that they have no competing interests.
Authors' contributions
HAM developed the method, ran the simulations and evaluations and drafted
the manuscript. MPLC and RFV discussed the method and results and helped
to draft the manuscript. All authors read and approved the final manuscript.
Acknowledgements
Egbert Knol, Dieuwke Roelofs-Prins, Marc Rutten, Chris Schrooten, Addie Ver-
eijken, Martin Lidauer, Ismo Stranden and Robin Thompson are thanked for
helpful discussions about this study. We would like to thank two anonymous
reviewers for giving constructive suggestions for improving the manuscript.
The work was financially supported by CRV, Hendrix Genetics, IPG and the
European Commission, within the 6th Framework project SABRE, contract No.
FOOD-CT-2006-016250. The text represents the authors' views and does not
necessarily represent a position of the Commission who will not be liable for
the use made of such information.
Author Details
Animal Breeding and Genomics Centre, Wageningen UR Livestock Research,
PO Box 65, 8200 AB Lelystad, The Netherlands
References
1. Dekkers JCM: Commercial application of marker- and gene-assisted
selection in livestock: Strategies and lessons. J Anim Sci 2004, 82(E
Suppl):E313-E328.
2. Grisart N, Coppieters W, Farnir F, Karim L, Ford C, Berzi P, Cambisamo N,
Mni MRS, Simon P, Spelman R, Georges M, Snell R: Positional candidate
cloning of a QTL in dairy cattle: identification of a missense mutation in
the bovine DGAT1 gene with major effect on milk yield and
composition. Genome Res 2002, 12:222-231.
3. Winter A, Kramer W, Werner FAO, Kollers S, Kata S, Durstewitz G, Buitkamp
J, Womack JE, Thaller G, Fries R: Association of a lysine-232/alanine
polymorphism in a bovine gene encoding acyl-CoA:diacylglycerol
acyltransferase (DGAT1) with variation at a quantitative trait locus for
milk fat content. Proc Nat Acad Sci USA 2002, 99:9300-9305.
4. Van Laere A-S, Nguyen M, Braunschweig M, Nezer C, Collete C, Moreau L,
Archibald AL, Haley CS, Buys N, Tally M, Andersson G, Georges M,
Andersson L: A regulatory mutation in IGF2 causes a major QTL effect
on muscle growth in pigs. Nature 2003, 425:832-836.
5. Villanueva B, Pong-Wong R, Woolliams JA: Marker assisted selection with
optimised contributions of the candidates to selection. Genet Sel Evol
2002, 34:679-703.
6. Hayes BJ, Chamberlain AJ, McPartlan H, Macleod I, Sethuraman L,
Goddard ME: Accuracy of marker-assisted selection with single markers
and marker haplotypes in cattle. Genet Res Camb 2007, 89:215-220.
s
h
2
21 21
22 2
22
pp pp
hA
h
qtl
() ()−==−
=
ss a
sa
(A1)
s
a
h
pp
m
i
m
i
i
in
2
21
2
21
1
=
−
−
=
=
∑
()
()
(A2)
s
a
a
h
pp
n
n
n
n
n
n
pp
22
21
2
2
11
1
1=
−
−
=
−
−
()
** *
().
(A3)
Received: 21 October 2009 Accepted: 22 March 2010
Published: 22 March 2010
This article is available from: 2010 Mulder et al; licensee BioMed Central Ltd. This is an Open Access article distributed under the terms of the Creative Commons Attribution License ( by/2.0), which permits unrestricted use, distribution, and reproduction in any medium, provided the original work is properly cited.Genetics Selection Evolution 2010, 42:10
lim lim ( ) .
n
h
n
A
n
n
pp
qtl
→∞ →∞
=
−
−=
sas
222
1
105
(A4)
s
h
2
BioMed Central
Mulder et al. Genetics Selection Evolution 2010, 42:10
/>Page 15 of 15
7. Fernando RL, Grossman M: Marker assisted selection using best linear
unbiased prediction. Genet Sel Evol 1989, 21:467-477.
8. Mulder HA, Meuwissen THE, Calus MPL, Veerkamp RF: The effect of
missing marker genotypes on the accuracy of gene-assisted breeding
value estimation: a comparison of methods. Animal 2010, 4:9-19.
9. Meuwissen THE: Determining haplotypes and IBD-probabilities from
dense-marker genotypes in large complex pedigrees. Proceedings 8th
World Congress Genetics Applied to Livestock Production; Belo Horizonte,
Brazil. Communication 2006:20-12.
10. Van Arendonk JAM, Smith C, Kennedy BW: Method to estimate genotype
probabilities at individual loci in farm livestock. Theor Appl Genet 1989,
78:735-740.
11. Fernando RL, Stricker C, Elston RC: An efficient algorithm to compute the
posterior genotypic distribution for every member of a pedigree
without loops. Theor Appl Genet 1993, 87:89-93.
12. Thallman RM, Bennett GL, Keele JW, Kappes SM: Efficient computation of
genotype probabilities for loci with many alleles: I. Allelic peeling. J
Anim Sci 2001, 79:26-33.
13. Thallman RM, Bennett GL, Keele JW, Kappes SM: Efficient computation of
genotype probabilities for loci with many alleles: II. Iterative method
for large, complex pedigrees. J Anim Sci 2001, 79:34-44.
14. Gengler N, Mayeres P, Szydlowski M: A simple method to approximate
gene content in large pedigree populations: application to the
myostatin gene in dual-purpose Belgian Blue cattle. Animal 2007,
1:21-27.
15. Gengler N, Abras S, Verkenne C, Vanderick S, Szydlowski M, Renaville R:
Accuracy of prediction of gene content in large animal populations
and its use for candidate gene detection and genetic evaluation. J
Dairy Sci 2008, 91:1652-1659.
16. Haldane JBS: The combination of linkage values and the calculation of
distances between the loci of linked factors. J Genet 1919, 8:299-309.
17. Bulmer MG: The effect of selection on genetic variability. Am Nat 1971,
105:201-211.
18. Meuwissen THE, Luo Z: Computing inbreeding coefficients in large
populations. Genet Sel Evol 1992, 24:305-313.
19. Lidauer M, Stranden I: Fast and flexible program for genetic evaluation
in dairy cattle. Interbull Bull 1999, 20:20-25.
20. Hill WG, Robertson A: Linkage disequilibrium in finite populations.
Theor Appl Genet 1968, 38:226-231.
21. Zhao H, Nettleton D, Soller M, Dekkers JCM: Evaluation of linkage
disequilibrium measures between multi-allelic markers as predictors of
linkage disequilibrium between markers and QTL. Genet Res Camb
2005, 86:77-87.
22. Calus MPL, Meuwissen THE, De Roos APW, Veerkamp RF: Accuracy of
genomic selection using different methods to define haplotypes.
Genetics 2008, 178:553-561.
23. Grapes L, Dekkers JCM, Rothschild MF, Fernando RL: Comparing linkage
disequilibrium-based methods for fine mapping quantitative trait loci.
Genetics 2004, 166:1561-1570.
24. Zhao HH, Fernando RL, Dekkers JCM: Power and precision of alternate
methods for linkage disequilibrium mapping of quantitative trait loci.
Genetics 2007, 175:1975-1986.
25. Calus MPL, Meuwissen THE, Windig JJ, Knol EF, Schrooten C, Vereijken ALJ,
Veerkamp RF: Effects of the number of markers per haplotype and
clustering of haplotypes on the accuracy of QTL mapping and
prediction of genomic breeding values. Genet Sel Evol 2009, 41:11.
26. De Roos APW, Hayes B, Spelman R, Goddard ME: Linkage disequilibrium
and persistence of phase in Holstein-Friesian, Jersey and Angus cattle.
Genetics 2008, 179:1503-1512.
27. Khatkar MS, Nicholas FW, Collins AR, Zenger KR, Cavanagh JAL, Barris W,
Schnabel RD, Taylor JF, Raadsma HW: Extent of genome-wide linkage
disequilibrium in Australian Holstein-Friesian cattle based on a high-
density SNP panel. BMC Genomics 2008, 9:187-194.
28. Sargolzaei M, Schenkel FS, Jansen GB, Schaeffer LR: Extent of linkage
disequilibrium in Holstein cattle in North America. J Dairy Sci 2008,
91:2106-2117.
29. Du F-X, Clutter AC, Lohuis MM: Characterizing linkage disequilibirum in
pig populations. Int J Biol Sci 2007, 3:166-178.
30. Andreescu C, Avendano S, Brown SR, Hassen A, Lamont SJ, Dekkers JCM:
Linkage disequilibrium in related breeding lines of chickens. Genetics
2007, 177:2161-2169.
31. Sved JA: Linkage disequilibrium and homozygosity of chromosome
segments in finite populations. Theor Pop Biol 1971, 2:125-141.
32. Hayes BJ, Visscher PM, McPartlan HC, Goddard ME: Novel multilocus
measure of linkage disequilibrium to estimate past effective
population size. Genome Res 2003, 13:635-643.
33. Scheet P, Stephens M: A fast and flexible statistical model for large-scale
population genotype data: applications to inferring missing
genotypes and haplotypic phase. Am J Hum Genet 2006, 78:629-644.
34. Windig JJ, Meuwissen THE: Rapid haplotype reconstruction in pedigrees
with dense marker maps. J Anim Breed Genet 2004, 121:26-39.
35. Sobel E, Lange K: Descent graphs in pedigree analysis: applications to
haplotyping, location scores, and marker-sharing statistics. Am J Hum
Genet 1996, 58:1323-1337.
doi: 10.1186/1297-9686-42-10
Cite this article as: Mulder et al., Prediction of haplotypes for ungenotyped
animals and its effect on marker-assisted breeding value estimation Genetics
Selection Evolution 2010, 42:10