Báo cáo sinh học: "The complete linkage disequilibrium test: a test that points to causative mutations underlying quantitative traits" ppt
Bạn đang xem bản rút gọn của tài liệu. Xem và tải ngay bản đầy đủ của tài liệu tại đây (889.28 KB, 8 trang )
RESEARCH Open Access
The complete linkage disequilibrium test: a test
that points to causative mutations underlying
quantitative traits
Eivind Uleberg
1,2*
and Theo HE Meuwissen
1
Abstract
Background: Genetically, SNP that are in complete linkage disequilibrium with the causative SNP cannot be
distinguished from the causative SNP. The Complete Linkage Disequilibrium (CLD) test presented here tests
whether a SNP is in complete LD with the causative mutation or not. The performance of the CLD test is
evaluated in 1000 simulated datasets.
Methods: The CLD test consists of two steps i.e. analysis I and analysis II. Analysis I consists of an association
analysis of the investigated region. The log-likelihood values from analysis I are next ranked in descending order
and in analysis II the CLD test evaluates differences in log-likelihood ratios between the best and second best
markers. Under the null-hypothesis distribution, the best SNP is in greater LD with the QTL than the second best,
while under the alternative-CLD-hypothesis, the best SNP is alike-in-state with the QTL. To find a significance
threshold, the test was also performed on data excluding the causative SNP. The 5
th
,10
th
and 50
th
highest T
CLD
value from 1000 replicated analyses were used to control the type-I-error rate of the test at p = 0.005, p = 0.01
and p = 0.05, respectively.
Results: In a situation where the QTL explained 48% of the phenotypic variance analysis I detected a QTL in 994
replicates (p = 0.001), where 972 were positioned in the correct QTL position. When the causative SNP was
excluded from the analysis, 714 replicates detected evide nce of a QTL (p = 0.001). In analysis II, the CLD test
confirmed 280 causative SNP from 1000 simulations (p = 0.05), i.e. pow er was 28%. When the effect of the QTL
was reduced by doubling the error variance, the power of the test reduced relatively little to 23%. When sequence
data were used, the power of the test reduced to 16%. All SNP that were confirmed by the CLD test were
positioned in the correct QTL position.
Conclusions: The CLD test can provide evidence for a causative SNP, but its power may be low in situations with
closely link ed markers. In such situations, also functional evidence will be needed to definitely conclude whether
the SNP is causative or not .
Background
QTL mapping efforts often result in the detection of
genomic regions t hat explain quantitative trait variation,
but seldom in the detection of the causative mutation
underlying the trait variation. Recently, methods devel-
oped to genotype high numbers of SNP have permitted
to reduce the size of the genomic regions detected. High
density SNP genotyping enables the detection of QTL
regions of up to 2 cM in size. Availability of genome
sequences and/or comparative maps make it possible to
set up a shortlist of positional candidate genes. These
candidate genes can be sequenced by second-generation
sequencing technologies, leading to the detection of
many potentially causative SNP that probably include
the causative mutat ion. However, genetic approaches
cannot distinguish between SNP in complete linkage
disequilibrium (CLD) with the QTL and the QTL itself
and at best, they can test whether a SNP is in complete
LD with the QTL or not. Because false discovery rate
and power are tightly connected when dealing with
* Correspondence:
1
Department of Animal and Aquacultural Sciences, Norwegian University of
Life Sciences, 1432 Ås, Norway
Full list of author information is available at the end of the article
Uleberg and Meuwissen Genetics Selection Evolution 2011, 43:20
/>Genetics
Selection
Evolution
© 2011 Uleberg and Meuwissen; lic ensee BioMed Central Ltd. This is an Open Access arti cle distributed under the terms of the Cre ative
Commons Attribution License (ht tp://creativecommons.org/licenses/by/2.0), which permits unrestricted use, distributio n, and
reproduction in any medium, provided the original work is properly cited.
complex traits [1], the challenge is to find methods that
provide sufficient power to discover a comp lete LD SNP
and simultaneously keep the false discovery rate under
control.
Recently, we investigate d the effect of precision and
power obtained by including the causative mutation
among the markers in a QTL mapping experiment [2].
Both power and precision were increased and the results
indicated that it would be possible to identify causative-
or CLD-SNP. In this paper, we propose a test to identify
SNP that are in complete LD with the QTL, in order to
maximise the genetic evidence for the SNP that is the
causative mutation. We evaluate the performance of this
test using simulated data where the causative SNP is
unequivocally known.
Methods
The simulated datasets
The simulated data used in this study have been p re-
viously de scribed in Uleberg and Meuwissen [2]. Briefly,
the SNP marker data wer e generated by Hudson’scoa-
lescence tree simulation program, “ms” [3] using a 2 cM
long segment and 100 individuals (200 haplotypes). In
practical situations, the size of the region depends on
the confidence interval of the previous QTL mapping
study. The assumed effective population size was 100,
and the mutation rate was 10
-8
per b p (10
6
bp per cM
was assumed). The size of the effective population did
not exceed that o f the sample, which is usually the case
in livestock and which makes the continuous time
approximation of the coalescence process somewhat
unrealistic. In spite of this, we expected the resulting
genealogies to resemble those in QTL mapping experi-
ments involving unrelated individuals, such as Genome
Wide Association Studies (GWAS). In addition to the
100 replications previously analysed by Uleberg and
Meuwissen [2], 900 new replications were performed
resulting in a total number of replicates of 1000. From
the numerous markers generated by the “ ms” simula-
tions, 21 were selected based on positio n and allele fre-
quency. The selected markers had minor allele
frequencies ( MAF) > 0.1 and were close to equidistant
over the region, so that the average distance between
two markers was 0.1 cM. The 11
th
SNP was selected as
the c ausative SNP and the effect of the QTL genotype
was 0, 1 or 2. Phenotypic records were obtained b y
summing the QTL genotype effect and an environmen-
tal effect, which was sampled from N(0, 0.5). The aver-
age g enetic variance (from the first 100 replicates) was
0.48, leading to a heritability of 0.54. Two datasets were
selected for each of the 1000 simulations i.e. one con-
taining 20 markers but not the causative SNP and one
containing 21 markers including the causative SNP as
the 11
th
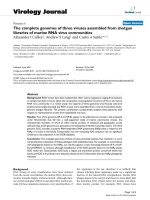
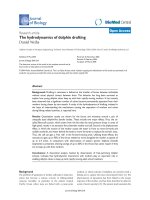
marker. Figure 1 shows the average linkage
disequilibrium measured by r
2
[4] be tween the caus ative
SNP and the other 20 SNP as a function of their dis-
tance to the causative SNP.
Statistical analysis
The analysis consisted of two steps: analysis I and analy-
sis II.
In analysis I, a QTL analysis of the region was per-
formed using a statistical model that regressed directly
on marker effects, as in associa tion mapping, calculating
the log-likelihood of effects of the different markers.
The model assumed additive inheritance and was:
Y =
µ
1 +Zm +
e
where μ is an overall mean, 1 is a vector of ones, m is
a vector of two random SNP allelic effects and e is a
vector of random sampling errors; Z is a design matrix
indicating which marker alleles are carried by the ani-
mals. The correlation matrix of m is the identity matrix,
I. The variance of the random effects m and e and the
log-likelihood of the model were estimated using the
ASREML package [5]. A model containing the marker
alleles was tested against a model excluding the marker
alleles. The log-likelihood ratio, i.e. the difference of log-
likelihoods between the two models, was used as a cri-
terion for evidence of a QTL at t he putative marker
position. Next, the SNP were ranked for their log-likeli-
hood values, where the most likely SNP was denoted
(1), the second most likely (2), etc.
In Analysis II, the two SNP that gave the highest log-
likelihood values in analysis I were compared by the
CLDtest.Theideaisthat,ifthemaximum-likelihood-
SNP is in complete LD with the QTL, it will not only
have a high Identity-By-Descent (IBD) probability with
the QTL but also be alike-in-state (AIS) and thus will
explain substantially more variance than a SNP that is
only in partial LD with the QTL, such as the second
highest log-likelihood SNP. The test statistic is thus:
T
CLD
= LogLik(m
(
1
)
) − LogLik(m
(
2
)
)
where LogLik(m
(i)
) is the log-likelihood of the model
including the i-th ranking marker. The T
CLD
values are
a measure of the relative importa nce of the best SNP
compared to the second best SNP. Since the best SNP is
expected to explain more variance than the second best
SNP, the null-hypothesis distribution differed from the
usual one, i.e. the best SNP was expected to explain
more variance. Thus, under the null-hypothesis distribu-
tion, the best SNP is in so mewhat more LD with the
QTL than the second best SNP, whereas under the
alternative-hypothesis the best SNP is in complete LD
with the causative mutation and thus also alike-in-stat e
with the QTL. In order to establish a significance
Uleberg and Meuwissen Genetics Selection Evolution 2011, 43:20
/>Page 2 of 8
threshold for the CLD test, the test was also performed
on data where the causative SNP was excluded. The 5
th
,
10
th
and 50
th
highest T
CLD
value out of 1000 replicated
analyses excluding the causative SNP were taken as the
p = 0.005, p = 0.01 and p = 0.05 significance threshold,
respectively.
Results
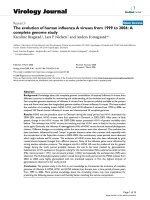
Figure 2 shows mean log-likelihood ratio values from
the analysis including or excluding the causative SNP.
The average log-likeli hood ratio for the most likely SNP
position was ~ 6 when the causative SNP was excluded
and ~ 23 when the causative SNP was included. Based
on 100 replicates, the LD, measured by r
2
, was 0.33
between the QTN and the best adjacent marker. The
average r
2
between all markers was 0.2.
Analysis I: causative SNP included
Table 1 shows that analysis I detected a QTL in 994
replicates (p = 0.001) when the causative SNP was
included in the analysis. In 972 replicates, the detected
QTL was positioned in the 11
th
marker position, which
was the correct position.
For 59 of the replicates, the best log-likeli hood value
was shared between two SNP. In 58 cases, this was the
causative SNP and a SNP positioned 1-3 posit ions away
from the causative SNP. For the 58 replicates when the
causative SNP was amongst the SNP with equal log-like-
lihood values, the replicate was defined as correctly
positioned in Table 1. The 59 simulations that found
equal log-likelihood values for two SNP positions were
not included in analysis II, because our ultimate aim
was to find evidence for the causal SNP, and in these 59
cases, the genetic evidence is clearly inconclusive and
more data is needed. The six replicates that did not find
evidence of a QTL were also excluded from analysis II.
Analysis I: causative SNP excluded
When the causative SNP was excluded from the analy-
sis, evidence for a QTL at p = 0.001 was detected for
714 replicates. Four hundred and forty-seven of these
were positioned adjacent to the masked causative SNP.
The results from the first 100 simulations of analysis I
have been presented by Uleberg and Meuwissen [2].
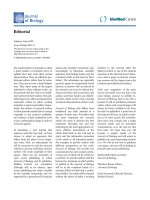
Analysis II
Figure 3 shows the distribution of the T
CLD
values for
the analysis when the causative SNP was included or
excluded. T
CLD
values were generally higher when the
causative SNP was included. The average T
CLD
value
Figure 1 Average r
2
between the causative and the 20 other SNP (from the first 100 replicates).
Uleberg and Meuwissen Genetics Selection Evolution 2011, 43:20
/>Page 3 of 8
was 4.84 when the causative SNP was excluded and
12.45 when the causative SNP was included.
Table 2 shows that in analysis II, the CLD test con-
fir med 88 causative SNP for the 1000 simulations when
the significance level was p = 0.005. When the signifi-
cance level was reduced to p = 0.05, the CLD test con-
firmed 280 causative SNP. All confirmed S NP were
positio ned correctly by the initial analys is I. Thus, none
of the 22 significant SNP that were not correctly posi-
tioned was confirmed by the CLD test. It should be
notedthattheCLDtestinvolvesonlyasingletestfor
the entire segment, such that higher p-value thresholds
can be used than when testing every SNP individually,
and performing 21 tests.
Effect of decreasing the size of the QTL
Additional analyses w ere performed to investigate the
behaviour of the CLD test when the QTL effect size was
reduced. The relative effect of the QTL was r educed by
doubling the error variance from 0.5 to 1. In analysis I,
the reduced QTL effect led to a decrease in average log-
likelihood values for the most likely QTL position from
Figure 2 Average log-likelihood ratios for 1000 simulations when the causative SNP was included or excluded from the analysis.
Table 1 Precision of QTL position estimates in 1000 replicate simulations
Original size of QTL
Number of brackets or marker positions between estimated and correct position (P = 0.001)
0 1 2 3 4 5 > 5 No significant QTL found
QTL between markers* 447 132 59 26 22 28 286
QTL included as marker 972 14 4 3 1 6
Reduced size of QTL
Number of brackets or marker positions between estimated and correct position (P = 0.001)
0 1 2 3 4 5 > 5 No significant QTL found
QTL between markers* 344 84 32 11 13 21 495
QTL included as marker 855 27 9 6 1 1 101
*since the QTL is not included there is no correct position; the two marker positions surrounding the QTL are considered to be one position away from the
correct position.
Uleberg and Meuwissen Genetics Selection Evolution 2011, 43:20
/>Page 4 of 8
~ 6 to ~ 3 when the causative SNP was excluded from
the analysis and from ~ 23 to ~ 12 when the causative
SNP was included in the analysis. The number of
detected causative SNP was reduced from 972 to 8 99
(Table 1). Eight hundred and fifty-five of the detected
SNP were positioned at the position of the causative
SNP. For 49 of the replicates, the best log-likelihood
value was shared between twoSNP.Again,theserepli-
cates were excluded from analysis II, as the evidence for
a causative mutation was not concl usive. The 101 repli-
catesthatdidnotfindevidenceofaQTLwerealso
excluded from analysis II.
Table 1 also shows that when the causative SNP was
excluded from analysis I, the number of replicates that
detected evidence for a causative SNP was reduced from
714 t o 505 when the QTL effect was reduced. The
results from the first 100 simulations of analysis I have
been presented by Uleberg and Meuwissen [2].
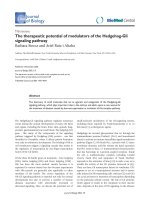
Figure 4 shows that, when the size of the QTL effect
was reduced, the average T
CLD
values were reduced
from 4.84 to 2.91 if the causative SNP was excluded and
from 12.45 t o 6.66 if it was included. T able 2 shows
that, with a reduced QTL effect, the CLD test confirmed
fewer causative SNP from the 1000 simulations. The
number of confirmed causative SNP was reduced from
88 to 48 with a significance level of p = 0.005 and from
280 to 231 with a significance level of p = 0.05. Again,
the position of all confirmed SNP was the same as that
of the causative SNP determined by the initial analysis I.
Relationship between T
CLD
values and marker statistics
We investigated the relationship between the T
CLD
value
and the LD between the best and second be st SNP: for
the 50 highest T
CLD
values, the average r
2
was 0.23 and
for the 50 lowest it was 0 .85. This shows that a low r
2
between the best and second best SNP favours a high
test statistic and thus produces a significant result.
Figure 3 T
CLD
test statistics when the causative SNP was included or excluded in the analysis.T
CLD
values are ranked in descending order
Table 2 Power of the CLD test based on the number of
significant associations in 1000 simulations for three
threshold levels
Original size of QTL
Significance threshold
p = 0.005 p = 0.01 p = 0.05
88 121 280
Reduced size of QTL
Significance threshold
p = 0.005 p = 0.01 p = 0.05
48 99 231
Uleberg and Meuwissen Genetics Selection Evolution 2011, 43:20
/>Page 5 of 8
Thus, if the causative SNP is among the SNP being
tested, there is a greater chance to obtain a positive
result if the r
2
value between adjacent SNP is low and
thus if marker density is low. The datasets with t he 50
highest and 50 lowest T
CLD
values had an average
minor allele frequency (MAF) for the causative SNP of
0.38 and 0.24, respectively, indicating that a higher MAF
value favours a significant test result, although this effect
is relatively small.
Discussion
The proposed CLD test confirmed 280 out of 1000 causal
SNPatap-valueof0.05(231whentheQTLeffectsize
was reduced). The power of the CLD test is thus 23-28%
and is much lower than when the SNP are used to detect
QTL-S NP associations. This relatively low power reflects
the fact that proving that a SNP is in complete LD is
more difficult than showing that it is merely associated
with the QTL. Thus, as previously reported [1], avoiding
false discoveries results in lower power when trying to
confirm causal SNP. Reducing the size of the QTL effect
did not affect dramatically the power of the test, indicat-
ing that other factors, such as the LD structure in the
region, are more important to the power of the test. The
stringent threshold for the CLD test is the result of
strong LD between the SNP in these data. Thus, the CLD
test accounts for the background LD when trying to dis-
tinguish complete LD from associated SNP.
An alternative approach to find the causative SNP is
the concordance test [6] in which the candidate SNP are
genotyped in the parents of the families involved in the
linkage mapping design. For this test, the QTL genotypes
of the parents should be based on m any offspring and be
quite certain. If t he SNP genotypes agree with that of the
inferred QTL genotypes, it provides evidence for the SNP
being causative. However, if a SNP is in strong LD with
the QTL, t he SNP genotypes are also expected to agree
with the QTL genotypes, especially when there are only a
few parents with ‘almost’ certain QTL genotypes. For
example, in a coat colour mapping study in dogs, 37% of
the candidate genes past the concordanc e test [7]. More-
over, if some of the QTL genotypes are wrongly inferred,
this test results in a type-I-error [8]. The data used in this
paper did not have the structure of a linkage mapping
study, and thus QTL genotypes could not be inferred
with high accuracy. The current data resembled that of
an association study and, thus, the presented approach is
suited to follow-up upon GWAS results.
Figure 4 T
CLD
test statistics when the causative SNP was included or excluded in the analysis and the QTL effect was reduced.T
CLD
values are ranked in descending order
Uleberg and Meuwissen Genetics Selection Evolution 2011, 43:20
/>Page 6 of 8
The test-statistic of the CLD test is based on the
assumption that, under the null-hypothesis distribution,
the best SNP explains more variance of the phenotype
than the second best, whereas under the alternative
hypothesis the best SNP is also alike- in-state with the
QTL and explains much more of the phenotypic var-
iance. Based on the average log-likelihood values for all
1000 simulations, the difference between the best and
second best SNP in these data is ~17 log-likelihood
units when the causative SNP is includ ed and only ~ 0.5
log- likelihood units when the causa tive SNP is excluded
fromtheanalysis.However,thevariancebetweenrepli-
cates is large, leading to a relatively low power when all
replicates are evaluated.
In GWAS, isolated significant SNP are often dis-
trusted, because none of the neighboring SNP confirms
the presence of a QTL. In such a case of an isolated sig-
nificant SNP, the CLD test would provide a positive
result since its signal is so much higher than that of
neighboring SNP. Here, we assumed that the previous
QTL mapping study unequivocally detected a QTL in
the studied region, so that regions with spurious signifi-
cant SNP will not be subjected to the test.
QTL mapping cannot distinguish between a causative
SNP and a SNP that is in perfect LD with the causative
SNP [9]. Thus, if two SNP are found with equally high
log-likelihood values, it is not clear which of the SNP is
the causative mutation, and the CLD test statistic would
be zero and should not be performed. The latter effect
of having a low CLD statistic if one or more SNP are in
very high LD with the causative SNP appears to protec t
the CLD test from pointing to non-causative SNP when
the causative SNP is included in the analysis. This is
demonstrated by the result that none of the 22 and 44
incorrectly positioned significant SNP in Table 1 are
confirmed by the CLD test.
Since higher T
CLD
-statistics were found for SNP with
alowr
2
with their nearest marker, we investigated the
effect of SNP density on the power of the test. Here, we
considered the highest possible density, namely
sequence data, which is becoming increa singly availabl e.
We reran 1000 “ ms"-simulations as described in the
Methods section, but retained all the SNP that resulte d
from t he simulated mutations. This resulted in an aver-
age of 470 SNP in the 2 cM segment, with an average r
2
between adjacent markers of 0.12. The average r
2
was
rather low due to the often low MAF, but for 6% of the
marker pairs r
2
was equal to 1. The SNP closest to the
middle of the 2 cM segment was designated as the QTL
and an environmental effect sampled from N(0,0.5) was
added to obtain phenotypes. Out of 1000 rep licates, 545
had a single most significant QTL, and 402 of these had
the QTL correctly identified. Out of these 402 replicates,
63 had a significant T
CLD
statistic (P < 0.05), resulting in
a power of 16% (= 63/402). Thus, the power was sub-
stantially reduced if the marker density was increased to
that of sequence data, but some level of power
remained. Again none of the misplaced QTL positions
passed the CLD test.
The fact that high marker densities, such as in
sequence data, results in a reduction of the power of the
test, may suggest that removing some SNP from the
data (obviously not the putative causative SNP) will
improve power. However this invalidates the CLD test,
since the test assumes that some SNP from the QTL
region were obtained through a SNP discovery process
that is not related to the phenotypic data. Moreover,
this artificial reduction of SNP density can result in false
positive test results, because the T
CLD
statistic will be
artificially increased if the second best SNP is removed
and, e.g., replaced by the i-th best.
In 59 replicates, analysis I found two or more SNP
with equal log- likelihood values for the most likely SNP.
This was t ypically the cau sative SNP and a SNP located
1 to 3 positions away from the causative SNP. Evaluat-
ing five of these replicates showed equal haplotype com-
binations f or every animal for the two most likely SNP,
thus the two SNP were in perfect LD. Other replicates
produced similar results, with the causative SNP and
one close SNP returning log-likelihood values at a
higher level than the rest of the SNP, although not
equal. In these replicates, the analysis excluding the cau-
sative SNP returned large T
CLD
values and resulted in
the stringent significance threshold that was used here.
As explained by Goddard and Hayes [10], causative
SNP might be expected to show different properties to
common SNP, because causative SNP may be subject to
selection such that polymorphisms will typically be
recent and ha ve lo w minor allele frequencies. Thus they
may show less LD with markers than common SNP. As
a consequence, causative SNP may be expected to show
less LD to common SNP in real data than in these
simulations, which may improve the power of the CLD
test in real data, if the causative SNP is included. How-
ever, since we tend to choose common markers for SNP
genotyping experiments, the causative SNP will less
likely be included in real data as long as selection is
based on the mi nor allele freque ncy. Hence, all SNP in
the promising regions will have to be genotyped in
order to improve the probability of inclusion of the cau-
sative SNP.
When SNP are evaluated, a number of these will be
coding SNP that change amino acids [9]. The number
of coding SNP is substantially smaller than the overall
total number of common SNP. So far little effort has
been placed on identifying coding SNP, but for the
future, knowledge on which SNP are coding could be
valuable when trying to identify causative mutations.
Uleberg and Meuwissen Genetics Selection Evolution 2011, 43:20
/>Page 7 of 8
Information a bout coding SNP will reduce the number
of candidate SNP and thus improve the power o f tests
for causal SNP by removing the signal from non-coding
SNP in LD with the causative SNP. How ever, non-cod-
ing SNP in regulatory regions of the genes may also be
causative. If the candidate region contains several genes,
information on gene function could also be used to
increase the power of the test.
Including the causative SNP as a mark er increased the
average log-likelihood values about four times in these
simulations (Figure 2). Although these simulations were
quite simple, this large increase appears to be quite gen-
eral, although its size may be modified by different fac-
tors, such a s family structure, marker density, dataset
size and QTL effect sizes. Given our general concl usion
that the inclusion of the causative SNP is expected to
increase the log-likelihood ratios, these factors are
expected to affect mainly the power of the test.
To apply the CLD test to real data, the significance
threshold must be estimated from the real data. The
basic approach that is proposed is to perform a QTL ana-
lysis (i.e. analysis I), and to calculate the T
CLD
statistic
(T
CLD(real )
). Then, records are simulated assuming that
the SNP detected by the QTL analysis is causative, with
simul ated QTL variances equal to the estimates obtained
from the real data analysis, where every SNP i will in
turn be assigned as causative, and will be masked when
analysing the data. This simulates replicated data under
the null-hypothesis with an LD structure a s found in the
QTL region. Analysing these null-hypothesis data with-
out including the assumed causative SNP will provide a
significance threshold for the analysed data. A signifi-
cance level can be obtained by counting how many of the
null-hypothesis T
CLD
values exceed the real data T
CLD
(real)
-va lue. For example, if 100 out of 1000 null-hypoth-
esis datasets have T
CLD
values exceeding T
CLD(real)
,the
p-value of the real data CST is 0.1 (= 100/1000).
The relatively low power of the CLD test does not
imply that it should not be used, since it is not very
costly to perform and, depending on its p-value, it may
provide substantial statistical evidence for a causative
SNP. However, because of the low power of the test, the
p-value of the real data T
CLD
(as described in the pre-
vious paragraph) w ill in mos t situations be quite high.
Ron and Weller [6] suggested that the quest for the cau-
sativeSNPhadtobewononpointsratherthanby
knockout. Their criteria for validating causality included
linkage analysis and LD mapping, positional cloning,
selection of candidate genes, DNA sequencing, and sta-
tistical analysis. Their conclus ion was that only an array
of evidence can establish proof of causality. The criti cal
test will be concordance and functional validation. In
this setting, the CLD test may provide considerable evi-
dence for a causative SNP, especially when a
concordance test cannot be applied, but due to its high
p-value, functional evidence will be needed to defini tely
conclude whether the SNP is causative or not.
Acknowledgements
The authors gratefully acknowledge the helpful comments of two
anonymous reviewers.
Author details
1
Department of Animal and Aquacultural Sciences, Norwegian University of
Life Sciences, 1432 Ås, Norway.
2
Norwegian Institute for Agricultural and
Environmental Research, Arctic Agriculture and Land Use Division, 9269
Tromsø, Norway.
Authors’ contributions
EU carried out data analysis and drafted the manuscript. THEM participated
in the design of the study and statistical analysis and helped draft the
manuscript.
Both authors have read and approved the final manuscript.
Competing interests
The authors declare that they have no competing interests.
Received: 23 April 2010 Accepted: 23 May 2011 Published: 23 May 2011
References
1. Pérez-Enciso M: Emerging tools in quantitative trait loci detection. Acta
Agric Scand, Section A - Animal Sciences 2007, 57:202-207.
2. Uleberg E, Meuwissen THE: Fine-mapping and detection of the causative
mutation underlying Quantitative Trait Loci. J Anim Breed Genet 2010,
127:404-410.
3. Hudson RR: Generating samples under a Wright-Fisher neutral model of
genetic variation. Bioinformatics 2002, 18:337-338.
4. Hill WG, Robertson A: Linkage disequilibrium in finite populations. Theor
Appl Genet 1968, 38:226-231.
5. Gilmour AR, Gogel BJ, Cullis BR, Welham SJ, Thompson R: ASReml User
Guide Release. Hemel Hempstead, UK: VSN International Ltd; 2002.
6. Ron M, Weller JI: From QTL to QTN identification in livestock - winning
by points rather than knock-out: a review. Anim Genet 2007, 38:429-439.
7. Karlsson EK, Baranowska I, Wade CM, Salmon Hillbertz NH, Zody MC,
Anderson N, Biagi TM, Patterson N, Pielberg GR, Kulbokas EJ, Comstock KE,
Keller ET, Mesirov JP, von Euler H, Kämpe O, Hedhammar A, Lander ES,
Andersson G, Andersson L, Lindblad-Toh K: Efficient mapping of
mendelian traits in dogs through genome-wide association. Nat Genet
2007, 39:1321-1328.
8. Farnir F, Grisart B, Coppieters W, Riquet J, Berzi P, Cambisano N, Karim L,
Mni M, Moisio S, Simon P, Wagenaar D, Vilkki J, Georges M: Simultaneous
mining of linkage and linkage disequilibrium to fine map quantitative
trait loci in outbred half-sib pedigrees: revisiting the location of a
quantitative trait locus with major effect on milk production on bovine
chromosome 14. Genetics 2002, 161:275-287.
9. Carlson CS, Eberle MA, Kruglyak L, Nickerson DA: Mapping complex
disease loci in whole-genome association studies. Nature 2004,
429:446-452.
10. Goddard ME, Hayes BJ: Mapping genes for complex traits in domestic
animals and their use in breeding programmes. Nat Rev Genet 2009,
10:381-391.
doi:10.1186/1297-9686-43-20
Cite this article as: Uleberg and Meuwissen: The complete linkage
disequilibrium test: a test that points to causative mutations underlying
quantitative traits. Genetics Selection Evolution 2011 43:20.
Uleberg and Meuwissen Genetics Selection Evolution 2011, 43:20
/>Page 8 of 8