Báo cáo sinh học: "Genetic structure of Balearic honeybee populations based on microsatellite polymorphism" potx
Bạn đang xem bản rút gọn của tài liệu. Xem và tải ngay bản đầy đủ của tài liệu tại đây (103.17 KB, 12 trang )
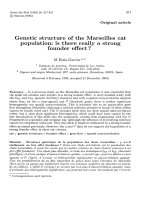
Genet. Sel. Evol. 35 (2003) 339–350
339
© INRA, EDP Sciences, 2003
DOI: 10.1051/gse:2003012
Original article
Genetic structure
of Balearic honeybee populations
based on microsatellite polymorphism
Pilar D
ELA
R
ÚA
a∗
,JoséG
ALIÁN
a
,
José S
ERRANO
a
, Robin F.A. M
ORITZ
b
a
Departamento de Biología Animal, Facultad de Veterinaria, Apdo. 4021,
Universidad de Murcia, 30071 Murcia, Spain
b
Institute of Zoology, Martin-Luther-University Halle-Wittenberg,
Kröllwitzer Str. 44, 06099 Halle/Saale, Germany
(Received 2 January 2002; accepted 21 November 2002)
Abstract – The genetic variation of honeybee colonies collected in 22 localitieson the Balearic
Islands (Spain) was analysed using eight polymorphic microsatellite loci. Previous studies have
demonstrated that these colonies belong either to the African or west European evolutionary
lineages. These populations display low variability estimated from both the number of alleles
and heterozygosity values, as expected for the honeybee island populations. Although genetic
differentiationwithin the islands is low, significant heterozygote deficiency is present, indicating
a subpopulation genetic structure. According to the genetic differentiation test, the honeybee
populations of the Balearic Islands cluster into two groups: Gimnesias (Mallorca and Menorca)
and Pitiusas (Ibiza and Formentera), which agrees with the biogeography postulated for this
archipelago. The phylogenetic analysis suggests an Iberian origin oftheBalearichoneybees,thus
confirming the postulated evolutionary scenario for Apis mellifera in the Mediterranean basin.
The microsatellite data from Formentera, Ibiza and Menorca show that ancestral populations
are threatened by queen importations, indicating that adequate conservation measures should be
developed for protecting Balearic bees.
honeybee / microsatellites / population structure / genetic diversity / Balearic Islands
1. INTRODUCTION
The honeybeeApismellifera L. has been the object of numerous studies from
different points of view. Ruttner [32] morphologically characterised 24 sub-
species, and grouped them into four branches according to their geographical
distribution. The Mediterranean branch shows a complex pattern of mitochon-
drial DNA haplotypes [14,18,21] and microsatellite loci [11,16,22], since the
∗
Correspondence and reprints
E-mail:
340 P. De la Rúa et al.
west Mediterranean/north European lineage has two haplotypes with numerous
variants (M and A), whereas that from the central Mediterranean/southeast
Europe shows the C haplotype except for A. mellifera sicula, which bears A
haplotypes. The latest scenario proposed for A. mellifera evolutionary lineages
defined by molecular approaches, considers two more lineages, one called O
which includes the Near and Middle Eastern subspecies and another lineage
called Y including the A. m. yemenitica subspecies from Ethiopia [16].
The Iberian honeybee, Apis mellifera iberica, has been extensively analysed
through morphometrical [4,25,27,32] and molecular studies (enzyme electro-
phoresis [3,38], mtDNA variation [5,14,18–21,34,37], and microsatellites [9,
11,14,22]). Morphometrical and mitochondrial data indicate the hybrid status
of this subspecies between the African A. m. intermissa and the west European
A. m. mellifera, since the African (A) haplotypes decreased gradually from the
South to North while the European (M) haplotypes increased. On the contrary,
Franck et al. [14] found that Spanish and Portuguese honeybee populations are
verysimilar to the Frenchpopulationswhenconsidering microsatellitemarkers,
although recent analyses of different Iberian populations do not completely
support these findings [9].
It is expected that honeybee populations from the Balearic Islands are
related to those of the Iberian Peninsula, according to the faunistic connec-
tions already known between both areas [2]. However, recent analyses have
shown that African haplotypes predominate in honeybees from the Balearic
archipelago [7], as reported for southern Iberia and other Mediterraneanislands
(Greek Islands: [19]; Malta: [35]; Sicily: [15,36]).
The purpose of this study was to determine the genetic structure of Balearic
honeybeepopulationsthrough the analysis of microsatellites,andtoassesstheir
evolutionary relationships to Iberian and African populations. Microsatellites
are nuclear DNA markers that show a remarkable polymorphism in the number
ofallelesperlocus and havebeenextensivelyused inpopulationgenetic studies.
In Apis mellifera they have also been applied in investigations on lineage evol-
ution [11], theoretical models of mutations [11,12] and reproductive behaviour
and socio-biology (reviewed in [39]).
2. MATERIALS AND METHODS
2.1. Sampling
A total of 98 colonies were sampled from 22 different localities distributed
on Mallorca, Menorca, Ibiza and Formentera during August 1999 and February
2000 (Fig. 1). The hives were opened and the bees were trapped from the inner
frames to prevent the collection of drifting bees. The bees were immediately
killed by immersion in absolute ethanol and kept at −20
◦
C until laboratory
Genetic structure of Balearic honeybees 341
Ibiza
6/24
Formentera
3/7
Mallorca
6/25
Menorca
7/42
Figure 1. Sampling location of Apis mellifera from the Balearic Islands for the
microsatellite analysis. Number of sampled localities (left) and colonies (right) are
indicated below the island name.
processing. All these colonies have been previously characterised by analysing
the mtDNA variation [7] and some of them by morphometric analysis [29].
2.2. Molecular analysis
Total DNA was extracted from one worker thorax per colony (N = 98) after
rinsing the bees in insect buffer for one hour according to Garnery et al. [19].
DNA isolation was performed following the Chelex method [40] with slight
modifications. Thesame samples were usedforbothmtDNAand microsatellite
analyses.
Eight polymorphic microsatellite loci were analysed: B124, A113, A7,
A35, A24, A28 and A88 [10,11] and A8 [14]. Multiplex PCR reactions
were performed when the annealing temperature and the MgCl
2
concentration
coincided. The reactions were done with fluorescent labelled primers and
separated on a DNA automated sequencer (ABI 310, Applied Biosystems).
2.3. Statistical analyses
Microsatellite allele sizes were scored by comparing the length of the PCR
fragments to the standard 100 bp TAMRA (Perkin-Elmer). Population para-
meters and estimates of gene diversity [26] were calculated with the POPGENE
package(vers.1.31). The exact testforHardy-Weinbergequilibrium,genotypic
linkage disequilibrium and genetic structure (genotypic differentiation) were
342 P. De la Rúa et al.
computed with GENEPOP version 1.2 ( />[30]). Microsatellite variation within and between populations was analysed
with FSTAT [23]. The significance value for multiple comparisons was calcu-
lated using the sequential Bonferroni procedure [31].
2.4. Phylogenetic analysis
The results of seven microsatellite loci (B124, A113, A7, A24, A28, A8
and A88) in the Balearic populations were combined with the data from
other geographically close populations (Castilla, Andalucia and Portugal in the
IberianPeninsulaand southern and northernRifandsouthernMorocco in North
Africa; data from Franck et al. [14]) to analyse their phylogenetic relationships.
The neighbour-joining method [33] and the chord distance of Cavalli-Sforza
and Edwards [1] were used to obtain an unrooted tree with bootstrap values
over 2000 iterations of the data set [24]. Programmes included in the PHYLIP
package (version 3.5c; [13]) were used for this purpose.
3. RESULTS
3.1. Genetic diversity
The number of alleles detected and the observed and expected heterozygos-
ities (Ho and He) per microsatellite locus are shown in Table I (detailed data
for allele frequencies at each locus are available upon request). The overall
population parameters per island are shown in Table II. The gene diversity
varied between 0.589 ± 0.247 (Mallorca) and 0.349 ± 0.331 (Formentera).
The Fisher method was used to test whether the honeybees sampled in one
island could be considered as a single population. Genotypic differentiation
within the islands was not significant (P > 0.706) whereas it was significant
when the four islands were compared (P < 0.05).
Seven significant departures of the Hardy-Weinberg equilibrium were detec-
ted among 32 (8 × 4) locus per population combinations, when only two were
expected by chance at the 5% level. Five tests were significant in Menorca, one
in Ibiza and one in Mallorca. The Fis estimates as a measure of heterozygote
deficiency or excess, gave values ranging between 0.329 (Menorca) and 0.149
(Formentera), thus indicating a heterozygote deficiency in all the islands.
Exact tests for linkage disequilibrium resulted in one significant value out of
82 pairwise comparisons, which is expected to occur by chance at the 5% level.
3.2. Population relationships
The Fisher exact test for multilocus genic and genetic differentiation indic-
ated that each island population was significantly differentiatedfrom the others.
Genetic structure of Balearic honeybees 343
Table I. Number of alleles detected, and observed and expected heterozygosities (Ho
andHe)per microsatellitelocus inApis melliferapopulations fromthe Balearic Islands.
The sample size from each island and locus is indicated in brackets.
Locus/alleles Mallorca Menorca Ibiza Formentera
B124 (28) (42) (24) (7)
alleles 12 15 9 4
Ho 0.643 0.667 0.458 0.286
He 0.862 0.866 0.770 0.643
A113 (21) (42) (23) (6)
alleles 14 6 8 7
Ho 0.857 0.714 0.696 1.000
He 0.853 0.743 0.798 0.792
A24 (19) (40) (23) (6)
alleles 3 6 3 3
Ho 0.105 0.100 0.217 0.500
He 0.101 0.311 0.199 0.403
A28 (25) (43) (24) (7)
alleles 5 3 1 1
Ho 0.600 0.372 0.000 0.000
He 0.678 0.414 0.000 0.000
A35 (24) (42) (23) (6)
alleles 5 5 8 5
Ho 0.625 0.548 0.696 0.833
He 0.707 0.581 0.764 0.681
A7 (20) (21) (17) (4)
alleles 5 6 3 1
Ho 0.400 0.191 0.059 0.000
He 0.529 0.601 0.164 0.000
A8 (30) (37) (23) (5)
alleles 7 8 4 1
Ho 0.200 0.405 0.652 0.000
He 0.519 0.763 0.717 0.000
A88 (19) (37) (23) (6)
alleles 5 7 2 2
Ho 0.368 0.216 0.044 0.000
He 0.468 0.415 0.043 0.278
Multilocus Fst values (Tab. III) varied between 0.049 (Mallorca and Men-
orca) and 0.276 (Mallorca and Formentera), the highest values being between
Mallorca and Formentera (0.276) and between Mallorca and Ibiza (0.219). The
lowest multilocus Fst values are in agreement with the geographical grouping
344 P. De la Rúa et al.
Table II. Multilocus microsatellite variation in the Balearic honeybee populations. N
is the mean sample size, n is the mean and standard error of the observed number of
alleles, Ho and He are the observed and the expected heterozygosity respectively. The
Fis values are also shown.
Population N n Ho He Fis
Mallorca 30 7.00 ± 3.89 0.475 ± 0.251 0.589 ± 0.247 0.217
Menorca 43 7.00 ± 3.55 0.402 ± 0.226 0.587 ± 0.196 0.329
Ibiza 24 4.75 ± 3.11 0.353 ± 0.307 0.432 ± 0.359 0.205
Formentera 7 3.00 ± 2.20 0.327 ± 0.408 0.349 ± 0.331 0.149
Table III. Pairwise Fst values between pairs of honeybee populations from the
Balearic Islands (
∗
P > 0.05).
Mallorca Menorca Ibiza
Mallorca
Menorca 0.049
Ibiza 0.219 0.149
Formentera 0.276 0.197 0.065
∗
of the islands: Gimnesias (Mallorca and Menorca) and Pitiusas (Ibiza and
Formentera).
3.3. Phylogenetic analysis
In the unrooted neighbour-joiningtree (Fig. 2) there were twowell-separated
groups, the Iberian populations together with the Balearic Islands and the
African populations. Within the Balearic populations, Mallorca and Menorca
formed a cluster whereas Ibiza branched together with Formentera, confirming
the result provided by the analysis of the genetic distance.
4. DISCUSSION
4.1. Honeybee population structure in the Balearic Islands
The comparison of the genetic variability between the Balearic populations
and other continental (Spanish and African, data from Franck et al. [14,17] and
De la Rúa et al. [9]) or island populations (data from De la Rúa et al. [6]), shows
that the heterozygosity values and the microsatellite allele number are similar
to those in the Iberian and the Canarian populations, and thus lower than those
from northern Morocco. The lowest values were observed in Formentera, the
smallest island with the smallest population (there are only four apiaries).
Genetic structure of Balearic honeybees 345
Castilla
Portugal
Andalucia
Menorca
Mallorca
Formentera
Ibiza
Southern Morocco
Nothern Rif
Southern Rif
100
100
70
98
99
58
54
Figure 2. Phylogenetic relationships (unrooted tree) of the Balearic, Iberian, and
African honeybee populations based on the neighbour-joining method and Cavalli-
Sforza and Edwards chord distance obtained from the microsatellite data. Bootstrap
values are noted as percentages and were computed over 2000 replicates of the data
set.
The low degree of heterozygosity in Formentera is indicative of a recent
bottleneck caused by massive losses of colonies in the early nineties due to
a Var ro a infection and followed by the recovery of the population from a few
colonies imported from Ibiza and the mainland, according to the information
given by the local beekeepers. The mitochondrial variation detected in the
island is also very low (De la Rúa et al. [7]).
The test for population differentiation indicates that there are not significant
genotypic differences within each island. However, Fis values were high
in every island population (Tab. III) suggesting that honeybee colonies have
been divided into subpopulations or demes within the islands, leading to a
deficit in heterozygotes in the pooled population due to the Wahlund effect.
The existence of subpopulations within the islands may be the result of at
least two factors, the existence of more than one mating area in the islands
and the propagation of selected colonies by the beekeepers through repeated
and controlled swarming. These factors would contribute to (i) the observed
genotypic homogenisation throughout a given island, and (ii) at the same time
a heterozygote deficiency.
Such a genetic structure was not expected in Mallorca, which in spite of
being the largest island is very homogeneous for the African mitochondrial A2
haplotype (100%). As noted by De la Rúa et al. [7], this finding suggests that
346 P. De la Rúa et al.
honeybee populations from Mallorca descend from a “natural” colonisation,
that is, are derived from ancestors that colonised the Mediterranean islands and
Europe after the last glaciation period [33,36] and have not undergone further
introgression events.
On the contrary, the microsatellite genetic homogeneity within Menorca and
Ibiza, contrasts with the presence of mtDNA haplotypes from two evolutionary
lineages A and M [7]. This result is indicative of recent introgression events,
apparently caused by the local beekeepers. As stated in a former paper dealing
with the mitochondrial haplotype variation [7], this molecular marker indicates
the introduction of the west European A. mellifera mellifera (with the M
haplotype) in Menorca – perhaps during the XVIII and XIX centuries when
French and British settlements were present on the island – and in Ibiza. Local
beekeepers from Ibiza have confirmed the importation of colonies from Iberia
during the last decades, especially from Valencia in eastern Spain where the
proportion of M haplotypes is about 50% (De la Rúa et al., unpubl. data). A
similar situation has been found in the honeybee population of Tenerife [6,8],
where recent importations of south-eastern Mediterranean races with the C
haplotype have occurred.
4.2. Evolutionary history of the Balearic honeybees
The results of the pairwise Fst significance test based on microsatellite
allele frequencies, indicate that the Balearic archipelago can be divided into
two groups, one including Mallorca and Menorca (the Gimnesias islands)
and the other Ibiza and Formentera (the Pitiusas islands). This clustering is
in agreement with the known biogeography of the archipelago [2] and the
grouping obtained with mitochondrial [7] and morphological [29] data, and
reflects the separate history of both island groups. Mallorca and Menorca
became separated from the Iberian Peninsula before Ibiza and Formentera,
and underwent several episodes of geographical separation and subsequent
connection during recent geological times. This grouping is also mirrored
in the N-J population tree, since the two clades made up by the Balearic
populations are supported by high bootstrap values. All other animal groups of
the Balearic Islands (except birds) show the same pattern of geographic affinity
depicted by honeybee populations [28].
The microsatellite data of Balearic honeybees suggest that a population
bottleneck occurred when the islands were colonised by ancestors coming from
Iberia or North Africa, thus giving rise to the observed reduction in the number
and the levels of heterozygosity of microsatellite alleles. This hypothesis
has also been invoked for explaining a similar reduction in microsatellite
variability in western European populations (from Iberia to France) in com-
parison to African ones [15]. Such a reduction was observed in honeybee
populations from southeast Spain as well [10]. In the Canary Islands [6]
Genetic structure of Balearic honeybees 347
there is also low microsatellite variability in spite of their geographic related-
ness to the African mainland, perhaps due to a founder effect during island
colonisation.
The clade formed by the Iberian and the Balearic populations support the
close biogeographic relatedness of the islands to the Iberian Peninsula [2],
which indicates a peninsular origin of the Balearic honeybee populations. The
presence of African haplotypes in other Mediterranean islands [15,19,35,36],
as well as in Iberian and Balearic honeybee populations suggests colonisation
events in the southern Mediterranean basin by African stocks. Ruttner [32]
and Sheppard et al. [35] have postulated that the distribution of honeybee
populations of African origin (A. m. iberica, A. m. sicula and A. m. ruttneri)in
the Mediterranean islands is a consequence of successive colonisation events
during the Pleistocene glaciations.
4.3. Conservation of Balearic honeybees
The conclusions derived from microsatellite and mitochondrial data indic-
ate that Balearic honeybee populations still have a natural genome worth of
being protected for conservation and applied purposes. In particular, Mallorca
seems to harbour the best preserved population. On the contrary, the case of
Formentera clearly shows the threats to the local Balearic populations due to a
combination of the effect of diseases and low population size. Most local bees
likely disappeared from Formentera and have been replaced by imported colon-
ies fromIbizaorValencia (East Spain). Ibizaand–toa lesserextent – Menorca,
show clues of recent introgression events that have substantially changed the
genetic pool of the ancestral local populations. Therefore, beekeepers and the
Balearic Government must be aware of the effects of queen importations if
protection policies are to be developed.
ACKNOWLEDGEMENTS
Special thanks are given to José A. Acosta for his help and advice dur-
ing the sampling travel to Mallorca and Menorca. We are indebted to the
beekeepers Jaume Martorell, Joan Massanet, Tomeu Gual, Gabriel Vicens,
Baltasar Pons and Antonio Cerdá from Mallorca, Sebastiá Pons, José Llufriú,
Antoni Truyol and Miquel Truyol from Menorca, Francisco Clapés and José
Suñer from Ibiza and Vicente Ribas and Pascual Mayans from Formentera, for
providing samples. This study has been supported by the DAAD-Acciones
Integradas Hispano-Alemanas HA 1998–0043, and the projects RZ00–013
(Spanish National Institute of Agricultural Investigation, INIA) and BABE
(EVK-2000–00628, European 5th Framework).
348 P. De la Rúa et al.
REFERENCES
[1] Cavalli-Sforza L.L., Edwards A.W.F., Phylogenetic analysis models and estima-
tion procedures, Evolution 3 (1967) 550–557.
[2] Colom G., El medio y la vida en las Baleares, Gráfica Miramar, Palma de
Mallorca, 1964.
[3] Cornuet J M., The MDH polymorphism in some West Mediterranean honeybee
populations, in: Breed M.D., Michener C.D., Evans H.E. (Eds.), Proceedings of
the IX Congress IUSSI, Westview Press, Boulder, CO, 1982, pp. 415–416.
[4] Cornuet J M., Fresnaye J., Étude biométrique de colonies d’abeilles d’Espagne
et du Portugal, Apidologie 20 (1989) 93–101.
[5] De la Rúa P., Galián J., Serrano J., Variabilidad mitocondrial en poblaciones
de abejas de la miel del Sureste Peninsular, Invest. Agr. Prod. Sanid. Anim. 14
(1999) 24–30.
[6] De la Rúa P., Galián J., Serrano J., Moritz R F.A., Genetic structure and dis-
tinctness of Apis mellifera L. populations from the Canary Islands, Mol. Ecol. 10
(2001) 1733–1742.
[7] De la Rúa P., Galián J., Serrano J., Moritz R.F.A., Molecular characterization
and population structure of the honeybees from the Balearic Islands, Apidologie
32 (2001) 417–427.
[8] De la RúaP., GaliánJ., Serrano J., Biodiversityof Apis melliferapopulations from
Tenerife (Canary Islands) and hybridisation with East European races, Biodiv.
Conserv. 11 (2002) 59–67.
[9] De la Rúa P., Galián J., Serrano J., Moritz R.F.A., Microsatellite analysis of
non-migratory colonies of Apis mellifera iberica from south-eastern Spain, J.
Zool. Syst. Evol. Res. 40 (2002) 164–168.
[10] Estoup A., Solignac M., Cornuet J M., Precise assessment of the number of
patrilines and of genetic relatedness in honeybee colonies, Proc. R. Soc. London
B 258 (1994) 1–7.
[11] Estoup A., Garnery L., Solignac M., Cornuet J M., Microsatellite variation in
honeybee (Apis mellifera L.) populations: hierarchical genetic structure and test
of theinfiniteallele and stepwisemutation models, Genetics 140(1995) 679–695.
[12] EstoupA.,TaillezC., CornuetJ M., SolignacM., Sizehomoplasyand mutational
processes of interrumped microsatellites in Apidae species, Apis mellifera and
Bombus terrestris, Mol. Biol. Evol. 12 (1995) 1074–1084.
[13] Felsenstein J., PHYLIP, phylogeny inference package, Version 3.5., University
of Washington, Seattle, 1993.
[14] Franck P., Garnery L., Solignac M., Cornuet J M., The origin of west European
subspecies of honeybees (Apis mellifera): new insights from microsatellite and
mitochondrial data, Evolution 52 (1998) 1119–1134.
[15] Franck P., Garnery L., Celebrano G., Solignac M., Cornuet J M., Hybrid origin
of honeybees from Italy (Apis mellifera ligustica) and Sicily (A. m. sicula), Mol.
Ecol. 9 (2000) 907–921.
[16] Franck P., Garnery L., Solignac M., Cornuet J M., Molecular confirmation of a
Middle East lineage in Apis mellifera, Apidologie 31 (2000) 167–180.
[17] Franck P., Garnery L., Loiseau A., Oldroyd B.P., Hepburn H.R., Solignac M.,
Cornuet J M., Genetic diversity of the honeybee in Africa: microsatellite and
mitochondrial data, Heredity 86 (2001) 420–430.
Genetic structure of Balearic honeybees 349
[18] Garnery L., Cornuet J M., Solignac M., Evolutionary history of the honey bee
Apis mellifera inferred from mitochondrial DNA analysis, Mol. Ecol. 1 (1992)
145–154.
[19] Garnery L., Solignac M., Celebrano G., Cornuet J M., A simple test using
restricted PCR-amplified mitochondrial DNA to study the genetic structure of
Apis mellifera L., Experientia 49 (1993) 1016–1021.
[20] Garnery L., Mosshine E.H., Cornuet J M., Mitochondrial DNA variation in
Moroccan and Spanish honey bee populations, Mol. Ecol. 4 (1995) 465–471.
[21] Garnery L.,Franck P., BaudryE., VautrinD., CornuetJ M., Solignac M.,Genetic
biodiversity of the west European honeybee (Apis mellifera mellifera and A. m.
iberica). I. Mitochondrial DNA, Genet. Sel. Evol. 30 (1998) 31–47.
[22] Garnery L.,Franck P., BaudryE., VautrinD., CornuetJ M., Solignac M.,Genetic
biodiversity of the west European honeybee (Apis mellifera mellifera and A. m.
iberica). II. Microsatellite DNA, Genet. Sel. Evol. 30 (1998) 49–74.
[23] Goudet J., FSTAT (version 1.2): A Computer Program to Calculate F-Statistics,
J. Hered. 86 (1995) 485–486.
[24] Hedges S.B., The number of replications needed for accurate estimation of the
bootstrap P value in phylogenetic studies, Mol. Biol. Evol. 9 (1992) 366–369.
[25] Hepburn H.R., Radloff S.E., Morphometric and pheromonal analyses of Apis
mellifera L. along a transect from the Sahara to the Pyrenees, Apidologie 27
(1996) 35–45.
[26] Nei M., Analysis of gene diversity in subdivided populations, Proc. Natl. Acad.
Sci. USA 70 (1973) 3321–3323.
[27] Orantes-Bermejo F.J., García-Fernández P., Morphological variability of Apis
mellifera iberica in different apiaries of southern Spain, J. Apic. Res. 34 (1995)
23–30.
[28] Palmer M., Pons G.X., Cambefort Y., Alcover J.A., Historical processes and
environmental factors as determinants of inter-islands differences in endemic
faunas: The case of the Balearic islands, J. Biogeogr. 26 (1999) 813–824.
[29] Radloff S.E., Hepburn H.R., Hepburn C., De la Rúa P., Morphometric affinities
and population structure of honeybees of the Balearic Islands in the Mediter-
ranean Sea, J. Apic. Res. 40 (2001) 97–103.
[30] Raymond M., Rousset F., GENEPOP (version 1.2): population genetics software
for exact test and ecumenism, J. Hered. 86 (1995) 248–250.
[31] Rice W.R., Analyzing tables of statistical tests, Evolution 43 (1989) 223–225.
[32] Ruttner F., Biogeography and Taxonomy of Honeybees, Springer Verlag, Berlin,
1988.
[33] Saitou N.,Nei M.,The neighbourjoining methoda newmethod forreconstructing
phylogenetic trees, Mol. Biol. Evol. 4 (1987) 406–425.
[34] Sheppard W.S., Rinderer T.E., Meixner M.D., Yoo H.R., Stelzer J.A., Schiff
N.M., Kamel S.M., Krell R., HinfI variation in mitochondrial DNA of old world
honey bee subspecies, J. Hered. 87 (1996) 35–40.
[35] Sheppard W.S., Arias M.C., Grech A., Meixner M.D., Apis mellifera ruttneri,a
new honey bee subspecies from Malta, Apidologie 28 (1997) 287–293.
[36] Sinacori A., Rinderer T.E., Lancaster V., Sheppard W.S., A morphological and
mitochondrial assessment of Apis mellifera from Palermo, Italy, Apidologie 29
(1998) 481–490.
350 P. De la Rúa et al.
[37] Smith D.R., Palopoli M.F., Taylor B.R., Garnery L., Cornuet J M., Solignac
M., Brown M., Geographical overlap of two mitochondrial genomes in Spanish
honeybees (Apis mellifera iberica), J. Hered. 82 (1991) 96–100.
[38] Smith D.R., Glenn T.C., Allozyme polymorphism in Spanish honeybees (Apis
mellifera iberica), J. Hered. 86 (1995) 12–16.
[39] Strassmann J., The rarity of multiple mating by females in the social Hymenop-
tera, Ins. Soc. 48 (2001) 01–13.
[40] Walsh P.S., Metzqer D.A., Higuchi R., Chelex 100 as a medium for simple
extraction of DNA for PCR-based typing from forensic material, Biotechniques
10 (1991) 506–512.
To access this journal online:
www.edpsciences.org