Wireless Networks dor Dummies phần 8 pps
Bạn đang xem bản rút gọn của tài liệu. Xem và tải ngay bản đầy đủ của tài liệu tại đây (1.6 MB, 41 trang )
Estimating network performance
A lot of things can negatively impact network performance, from poor device
drivers to competing traffic to inconsiderate users downloading gigabytes’
worth of MP3s on your network. All this makes for poor relations between the
users and your technical staff. You need a method of determining that traffic
and balancing sufficient load with your business needs.
To estimate the performance of your network, you need to understand the
traffic that it will sustain. Are your users able to connect to the Internet and
download MP3- or AVI-type files? Are network people using the wireless spec-
trum to download large patches and configuration files? How many users are
on the network at a given time and what are their main job functions?
The performance of your wireless network depends on factors such as dis-
tance to an access point, structural interference of buildings and walls, and
placement and orientation of devices, especially antennae. You really need
expert advice to do this well. Sites such as
www.csm.ornl.gov/~dunigan/
netperf/netlinks.html
can provide you with tons of detailed information
on performance issues and calculations. Another interesting site is the
Cooperative Association for Internet Data Analysis (
www.caida.org), which
offers specialized advice on Internet network traffic analysis. You might use
this to determine the speed of your Internet connections.
You can use a rough formula, though, to calculate an estimate of traffic load
on your network. Appendix C contains a table that provides frequencies and
their data rates. Using 802.11b as an example, you see that data transfer can
occur at up to 11 Mbps. Of course, the likelihood of you achieving anywhere
near that speed is remote, so taking a conservative estimate of 5 Mbps, you
can begin to calculate traffic load. Next, you need to know what you might be
using over the network, such as e-mail or file transfer. If you are transferring
a 1MB file, then divide that by 5 Mbps to get a transfer time of about 200 milli-
seconds (ms), assuming nothing else is going on. E-mail or other traffic may
only consume perhaps 100 Kb, or roughly 10 e-mails for each megabyte. So,
all things being equal, you can do a very rough estimate by deciding how many
e-mails and file transfers will occur on the wireless network and then adding
the number of users who might be connected to determine a threshold. You
can use similar numbers for your 802.11g or 802.11a networks. But this is so
elementary that it might not give you any real basis for determining overall
performance.
To really get anywhere using real statistics, you need some form of toolkit. You
can purchase network simulation tools for this task, such as OPNET Modeler
(
www.opnet.com/products/modeler/home.html) or their ServiceProvider
266
Part IV: Keeping Your Network on the Air — Administration & Troubleshooting
21_575252 ch15.qxd 9/2/04 4:09 PM Page 266
Guru. If these are too pricey, perhaps Dummynet (pi.
it/~luigi/ip_dummynet
), a free BSD-based product, might be useful. A good
thing about this software is that you don’t need to install BSD to run it; it
comes on a bootable floppy disk. Plug it in and begin testing your bandwidth.
Okay, it isn’t quite that simple — you may need to add your wireless network
adapters.
Other tools include the AirMagnet Handheld by Airmagnet, Inc. (
www.air
magnet.com
), which runs on Pocket PC devices. This tool can detect and
send out alerts for over 80 wireless security and performance conditions. It
also offers built-in tools for site surveying, connection troubleshooting, and
coverage mapping. All that and you can wander around with it in your back
pocket. Naturally, they also offer a version that runs on a laptop, for those of
you with other needs or without Pocket PCs.
Another tool, Fluke Network’s OptiView Series II Network Analyzer (
www.fluke
networks.com/us/LAN/Handheld+Testers/OptiView/Overview.htm
) not
only analyzes the traffic, but also offers traffic generation capabilities, so you
can flood the network and see how it responds.
If these do not appeal to you, try Airopeek (
www.wildpackets.com/products/
airopeek
), which does a similar level of performance analysis as the others,
analyzing signal strength and channel and data rates. You see in Chapter 16
how to use Airopeek to discover rogue APs. Windows NT Magazine (
www.
winnetmag.com/Files/25953/25953.pdf
) offers a long list of such analyzers
along with some general information about them. They include more of the
high-end versions than we do in this book; so if you are flush with cash and
think you need something stronger and more powerful, check it out.
With these tools, you want to find out how busy your network is at any given
point. You do this by checking the traffic throughout a given time period and
determining whether it meets your expectations. What expectations, you say?
Well, that depends on you and what the wireless network is used for in your
business. Is it a mission-critical application network? Is it merely offering a
few Tablet PC users access during boardroom meetings? Do customers rely
on it? All these need consideration to determine whether you care if the net-
work gets busy and bogs down. Hopefully, you answered these questions
when you developed your plan. You did develop a plan, didn’t you? (If not,
hurry to Chapter 2.)
To determine whether your network is operating at sufficient capacity, you
can use CommView for WiFi from Tamosoft (
www.tamos.com/products/
commwifi
), which is a wireless network packet analyzer. This tool is specific
to wireless networks and offers many capabilities besides packet sniffing. One
267
Chapter 15: Dealing with Network Throughput Issues
21_575252 ch15.qxd 9/2/04 4:09 PM Page 267
of its features is statistical analysis, which you can use to determine how
busy your network is at any given time. Running this over several different
time periods in a week can provide you with valuable information. You must
know where you are in order to know where you are going.
When CommView for WiFi is running on your machine, it places the adapter
in a passive mode. This means it cannot connect to the wireless network as
a functioning client, so you cannot perform your regular business while also
running the program. This is unfortunate, but setting up a machine specifi-
cally for monitoring is not necessarily a bad thing. The installation is fairly
straightforward, like most Windows software these days. Once installed, it
offers a number of options, as you can see in Figure 15-1.
We discuss many of the settings later on in this chapter. For now, if you select
View➪Statistics, you see a page like that shown in Figure 15-2. This is where
you can determine how well your network is running. It offers a number of
options.
As you see, the Statistics menu offers Packets per Second analysis as well as
Bytes per Second. The Bytes per Second can be changed to show Bits per
Second. For each of these fields, the program shows the current average. Using
this, you quickly see the overall impact your users are having on the network
and can determine whether that impact is high or reasonable.
Within the Statistics page, there are seven tabs to select from, starting with
the General tab that appears when you first open the statistics page. This tab
offers the overall statistics, as mentioned previously. The next six tabs are
shown in Table 15-1.
Figure 15-1:
Viewing the
CommView
for WiFi
main menu.
268
Part IV: Keeping Your Network on the Air — Administration & Troubleshooting
21_575252 ch15.qxd 9/2/04 4:09 PM Page 268
Table 15-1 Options Available in the Statistics View
Tab Description
IP Prot. This tab shows you the IP protocols.
IP Sub-prot. In this tab, you see the other protocols, such as FTP and HTTP.
Sizes Here you can easily see the packet sizes in use across the
network.
LAN Hosts (MAC) This shows the hosts on your system using their MAC
addresses.
LAN Hosts (IP) This shows the hosts on your system using their IP addresses.
Report On this tab, you can set the parameters for your reports.
All these can be used to provide a fairly detailed view of your network, show-
ing you trouble spots and overall utilization.
You cannot obtain data if the system is using WEP or WPA unless you add the
proper keys because all packets are being encrypted. You add the keys to
CommView for WiFi by selecting Settings➪WEP/WPA Keys and entering the
keys in the space provided.
Figure 15-2:
Viewing the
CommView
for WiFi
Statistics
menu.
269
Chapter 15: Dealing with Network Throughput Issues
21_575252 ch15.qxd 9/2/04 4:09 PM Page 269
To start using all these tabs, you need to begin capturing packets so you can
obtain some actual data. After you identify and input the proper keys, you
need to start the capture process. Simply follow these steps:
1. Open the CommView program if it is not already open.
2. Click the Start icon, or select File➪Start.
A new screen called Scanner appears. This screen locates the wireless
networks in the vicinity. In the Scanner section, click Start Scanning.
3. The program will scan all channels for wireless signals and show them
to you under the Access Points and Hosts section. Selecting one of the
networks shown produces details about that network under Details.
You see this in Figure 15-3.
4. Choose one of the networks and click Capture.
CommView begins to capture packets.
5. Select View➪Statistics to see how your network is handling the band-
width load.
Another window shows the current data from the network you chose in
Step 4. We chose a very large download from Microsoft, and in this exam-
ple, we are using only one machine on the wireless network. You can see
from Figure 15-4 that this creates a bandwidth load of about 4 or 5 percent
Figure 15-3:
Viewing the
CommView
for WiFi
Scanner
page.
270
Part IV: Keeping Your Network on the Air — Administration & Troubleshooting
21_575252 ch15.qxd 9/2/04 4:09 PM Page 270
(the figure is showing 4.6 percent). With a few more users on the network,
each downloading files or sending e-mails, this small network will quickly
be overloaded.
As you can see, the tool allows for some useful data collection. In the
other tabs, you can parse this data in a number of ways. In the IP Prot.
tab, you see the number and type of packets (TCP, UDP, etc). In the IP
Sub-prot. tab, the data is divided by the lower or sub protocols in use,
such as HTTP, FTP, or POP. This can be especially useful to help you
determine what your users are doing with the bandwidth. You can review
the use of the other settings using Table 15-1.
6. You can run a report using the Report tab and provide details in either
HTML format or comma-delimited format depending on your needs
This enables you to produce an informative report for your management
on overall performance of the network. Stop the program at any time by
selecting File➪Stop Capture.
The program offers a solid method for determining overall network perfor-
mance at any given time. Running it at different times of the day and different
days of the week and capturing the results in logs enables you to compare the
data over time periods that you might feel are busy or indicative of the over-
all state of your network. Now you can determine whether one particular user
is abusing the bandwidth, or whether a particular protocol is being heavily
used, and take appropriate action.
Figure 15-4:
CommView
Statistics
page
showing
utilization
figures.
271
Chapter 15: Dealing with Network Throughput Issues
21_575252 ch15.qxd 9/2/04 4:09 PM Page 271
You might also use the data gathered in this program to ensure that staff are
abiding by any policies and standards you might be enforcing across your
network. Chapter 10 discusses the types of standards you may want to use.
Sniffing your traffic
It’s not polite to sniff in public, is it? It may not be polite to sniff your network
traffic, either, but there are sometimes good reasons for doing that. You can
look into packets and see what is happening. You can check for cleartext pass-
words and use that information to press for changes to systems still using
such weak authentication. Other reasons include checking for wrong syntax
of http requests or POP3 and ftp commands, or seeing what ports an applica-
tion is using.
We use packet sniffers with clients on a regular basis when they need to allow
an application to pass through a firewall but don’t know which ports are
needed. Sniffing the packets while the application runs is a simple way to
determine that. We can recall one instance in which a service provider was
confident that a particular application only needed one specific port to be
open on the firewall, and was therefore not at risk. Using a packet sniffer, we
discovered that the application actually opened different ports each time it
ran, meaning we would have to open the entire range between our client and
the other organization. This was just not acceptable, and we proved it with
the sniffer. A newer version that acted properly eventually resolved the issue,
allowing us to permit one open port and no more.
There are other reasons for using such applications. We discuss a few of them
in previous chapters in discussions about hacking. We also provide you with
a number of such tools in Chapter 17.
So how do you use a network sniffer? Continuing on with our example of
CommView for WiFi, you select some of the other tabs shown on the main
page. The following steps show you how to view data and other information
found in a network packet.
1. Click the Start icon or select File➪Start. A Scanner screen appears.
This screen locates the wireless networks in the vicinity. Under the
Scanner section, click Start Scanning.
The program scans all channels for wireless signals and shows them to
you under the Access Points and Hosts section. Selecting one of the net-
works shown produces details about that network under Details. (Refer
to Figure 15-3.)
272
Part IV: Keeping Your Network on the Air — Administration & Troubleshooting
21_575252 ch15.qxd 9/2/04 4:09 PM Page 272
2. Choose the network you wish to view, if more than one choice is avail-
able, and select Capture.
The program starts capturing packets.
3. Click the Packets tab.
A screen will appear looking something like the one in Figure 15-5. Note
that by dragging the mouse over the lines separating each section of the
page, you can resize each section.
Three sections are shown:
• In the first section, you see each packet on one line with high-level
information about it, such as the protocol, MAC address, IP address,
the ports in use, and other fields. This alone provides enough infor-
mation for tracking rogue applications to determine what source
and destination ports they require.
• The second section shows the actual data within the packet. It is
here you will see cleartext passwords when any are passing across
the network, as well as any other information, such as Web sites
being visited or file transfers.
Figure 15-5:
CommView
showing
packet
details.
273
Chapter 15: Dealing with Network Throughput Issues
21_575252 ch15.qxd 9/2/04 4:09 PM Page 273
• The third section provides detailed information on the actual packet,
delving deeply into each one to show the SSID, WEP parameters, the
band (a, b, or g), the channel, and a whole pile of other information.
This section is only for network administrators who truly under-
stand how TCP/IP works and can make sense of things like the ACK
and SYN and ARP response. If you dig around, you’ll find the BSSID
and other useful data you should recognize from the various chap-
ters in this book.
4. When you have collected a reasonable amount of information, stop
the collection by selecting File➪Stop Capture. You can then save this
data to a file for later viewing and analysis using the options found
under the File menu.
Don’t let your network packet capture run for hours on a large network with-
out checking to see whether you need that amount of information and ensur-
ing you have enough hard drive space to hold it. It will quickly amount to tens
of megabytes. It may also considerably increase your CPU usage and make
the application less responsive. Consider filtering out packets you don’t need
for your analysis.
You see from these steps that the amount of data collected and the detail you
can get from each packet is prodigious. You may want to read the book, TCP/IP
For Dummies, 5th Edition, by Candace Leiden and Marshall Wilensky (Wiley), to
find out more about this protocol.
We warned you that the amount of data you can collect can be huge. You may
want to filter out those packets that aren’t useful to the purpose of your col-
lection. If all you want is statistical information, the green histograms, pie
charts, and hosts tables, then use the Suspend Packet Output menu command,
which allows you to collect statistical data without real-time packet display.
You do this by selecting File➪Suspend Packet Output after selecting the Start
Capture option. This stops showing the packets, but keeps the statistical
information for your charts.
You may want to select the Rules tab and then select options that will limit
what is collected. The options on the left side allow you to select an impres-
sive level of detail. You can see from Figure 15-7 that you can select traffic
going to or coming from only certain MAC or IP addresses. You can specify
specific ports to collect only certain application data, like FTP (23) or HTTP
(80). You could also capture packets containing certain text information. This
could be very useful in an investigation following up complaints of sexual
harassment or other inappropriate use of your e-mail system. Naturally, you
need to be sure that you follow any laws governing such access, and that you
do not cross any privacy boundaries.
274
Part IV: Keeping Your Network on the Air — Administration & Troubleshooting
21_575252 ch15.qxd 9/2/04 4:09 PM Page 274
In Figure 15-6, you see that we have selected only ports 21 and 23 because we
want to know what Telnet and FTP sessions are crossing the network.
This merely touches on the use of this powerful tool, and we recommend that
you study the documentation intensely to discover its full potential. Whether
you use CommView or any of the other fine tools available, learning the details
will allow you to respond quickly and effectively to any need you may have in
your business.
One of the useful items that we will mention is the ability to reconstruct a ses-
sion. This is useful because you certainly won’t want to wade through every
packet one by one, trying to see specific Web site or FTP session details. By
right-clicking on the initial packet, you can select the Reconstruct This TCP
Session option. You see this option in Figure 15-7.
If you select that option, the program reads all the packets pertaining to that
session and provides you with a clearer look. You see the results in Figure 15-8.
Note that you can modify the results to appear in ASCII (shown), HTML, or
other display types depending upon your need. When you view FTP, Telnet,
or Web site logins, or even that rogue application, this brings it all to bear
and allows you to see the big picture.
Figure 15-6:
Setting
CommView
to collect
specific
packet
information.
275
Chapter 15: Dealing with Network Throughput Issues
21_575252 ch15.qxd 9/2/04 4:09 PM Page 275
Notice that the Web page we visited is www.msn.com. You will see other infor-
mation, of course. This is a powerful capability and is not to be underestimated.
These tools offer you the ability to manage and monitor your network effec-
tively, and they belong in all companies’ toolkits.
Figure 15-8:
The
resulting
recon-
structed
session.
Figure 15-7:
Recon-
structing
a session.
276
Part IV: Keeping Your Network on the Air — Administration & Troubleshooting
21_575252 ch15.qxd 9/2/04 4:09 PM Page 276
Traffic management and analysis
What do we mean by traffic management? Are we suggesting you enter an inter-
section and begin directing cars? No. We mean ensuring that your network
functions well. The main goals of network management consist of the following:
ߜ Improving network availability
ߜ Centralizing control of the network components
ߜ Reducing complexity
ߜ Reducing the operational and maintenance costs
A network management system can reduce the cost and complexity of net-
works by providing integrated tools, allowing the network manager to quickly
isolate and diagnose network issues before they become a major nuisance.
Typically, it provides an ability to do this from a central location, removing net-
work administrators’ need to roam around in order to see and resolve issues.
The general areas network management systems deal with include those
shown in Table 15-2.
Table 15-2 Key Network Management Functions
Function Description
Fault management This consists of detecting, isolating, and correcting
any abnormal network operation. It includes getting
the fault indication, determining the cause, isolating
it, and performing corrective action.
Performance management This consists of the tools used to recognize
performance issues causing problems. It includes
the ability to monitor the network for acceptable
performance and collect and analyze statistics to
help prevent future issues.
Configuration management These include configuring and maintaining the
network components.
Accounting management This area involves measuring network utilization
parameters to allow you to regulate each user’s
network use appropriately.
Security management This encompasses all activities involved in
controlling and monitoring access to the network.
277
Chapter 15: Dealing with Network Throughput Issues
21_575252 ch15.qxd 9/2/04 4:09 PM Page 277
Performing all this is a task your network people are charged with, and how
they do it determines how well your network runs. You can use tools like
Ipswitch WhatsUp Gold (
www.ipswitch.com) or one we have used recently
called SolarWinds Network Management Tools (
www.solarwinds.net). You
find a list of different vendor products in Chapter 16.
Using tools like Ipswitch WhatsUp Gold allows you to map out all the devices
on your network and monitor them for availability, as well as monitoring indi-
vidual services such as HTTP, DNS, or SMTP, or monitoring such things as disk
space or memory utilization. Knowing that an object is having difficulty, how-
ever, requires notification, and the product performs this in many different
ways. It can send a message to a pager, send an e-mail, or issue a pop-up on a
console. Like CommView, this product can be used for performance statistics,
reports on availability and errors, and a host of other options. Combining
Ipswitch WhatsUp Gold with the efforts of a company called Wavelink Corpo-
ration (
www.wavelink.com), you can use the product across both wired and
wireless networks.
Organizations today rely heavily on such management tools to help ensure
that their networks remain functional, and for quickly detecting and resolving
problems. You should be using these tools on your network, as well.
Outsourcing your network management
If you outsource your network management, you need a service level agree-
ment that indicates the precise degree of network availability and bandwidth
utilization that is expected and over what time frame. A service level agree-
ment (SLA) is a written agreement between your service provider and your
company that clearly outlines the expected performance level of network ser-
vices. This agreement should include specific metrics agreed upon by both
parties. The values set for the metrics must be realistic, meaningful, and mea-
surable. That data might include
ߜ Interface statistics collected from the network devices, such as number
of packets and ignored or dropped packets
ߜ Size and type of network devices in use, including number of access
points, stations, and switches
ߜ Bandwidth utilization statistics
ߜ Emergency response times and equipment upgrade or patch manage-
ment implementation time frames
278
Part IV: Keeping Your Network on the Air — Administration & Troubleshooting
21_575252 ch15.qxd 9/2/04 4:09 PM Page 278
Using distinct, measurable, and quantifiable numbers increases the chance
that you and your service level provider will be keenly aware of what is hap-
pening on the network and stick to the prescribed rates. Don’t forget to
include security metrics as well.
We have worked with an organization whose SLA was pitiable in its lack of
distinct and measurable security metrics. This was to the point at which the
firm was ripe for being taken advantage of, given that it would have no leg to
stand on where opinions on measurement differed enough to impact the com-
pany in a negative way. For example, on a simple SLA that a service provider
issued, they stood to be inundated with security audits because they placed
no restrictions on their largest customer on how many audits they could
request in a year. Typically, a service level agreement will spell out a reason-
able approach, including using a standard audit that all customers would see,
rather than specific ones for each customer.
Ensure that when your network is outsourced, your SLA is prepared with all
your needs in mind and offers reasonable and qualitative metrics for measur-
ing success.
Monitoring the Network for Trouble Spots
One key thing to look out for in your wireless network is rogue access points.
You can do this by using a number of the management tools we mention. In
CommView for WiFi, you use the Alarms icon on the main page. Other items
you can look for include unknown IP or MAC addresses. These require more
work, however, because most organizations use DHCP and not static address-
ing and few organizations know all the MAC addresses it uses. If you do know
all of the MAC addresses your company uses, however, you can set alarms to
go off when aberrations occur. Other uses include setting the alarm to look
for bandwidth hogs and taking action when you find excessive use.
To scan for rogue access points, you need to know the MAC address for each
access point on your network. Armed with this information, follow these
steps:
1. Open the program and select the Alarms tab. Then click Add.
You see a screen like that shown in Figure 15-9.
2. Select the check box next to Rogue APs.
3. You need to configure the alarm. Click Configure.
279
Chapter 15: Dealing with Network Throughput Issues
21_575252 ch15.qxd 9/2/04 4:09 PM Page 279
4. Enter the MAC addresses of your access points, and then click OK.
5. At the top of the page, enter a name for your rule in the Name field.
6. Select the type of action you would like to occur using the items listed
on the right side of the page, and then click OK.
For instance, check the box for Display Message and enter a message
such as Rogue AP Detected. After you click OK, you see your rule listed
along with a check mark to indicate that it is active.
7. If another access point is running on the channel you are scanning,
your event is triggered and you see your message, as shown in Fig-
ure 15-10.
This ability alone is a good reason to purchase CommView or other similar
tools. While we set the event to trigger a message on the console running
CommView, recall that you can send an e-mail, play a sound, or do any
number of other things to attract attention.
Figure 15-9:
Configuring
CommView
to detect
rogue
access
points.
280
Part IV: Keeping Your Network on the Air — Administration & Troubleshooting
21_575252 ch15.qxd 9/2/04 4:09 PM Page 280
Figure 15-10:
Commview
detecting
a rogue
access
point.
281
Chapter 15: Dealing with Network Throughput Issues
21_575252 ch15.qxd 9/2/04 4:09 PM Page 281
282
Part IV: Keeping Your Network on the Air — Administration & Troubleshooting
21_575252 ch15.qxd 9/2/04 4:09 PM Page 282
Chapter 16
It’s Ten O’Clock: Do You
Know Where Your
Access Points Are?
In This Chapter
ᮣ Discovering the extent of your network
ᮣ Using tools for discovery
ᮣ Detecting wireless intrusions
ᮣ Building an incident handling program
ᮣ Auditing your wireless network
A
big part of managing and protecting your network is knowing your net-
work. Identifying your 802.11 and 802.15 gear will help you understand
the magnitude of your problem. Many companies have emphatically stated
that they had no wireless networks, only to find out they did. This chapter is
for those who acknowledge that they have wireless networks installed (and
for those who don’t).
Discovering the Extent of
Your Wireless Network
You have many ways to discover that you have wireless networks. You could
send a survey out to your employees. We know that not everyone will respond
to a survey. And those who do will probably not admit to having wireless if
you have a policy against it. You could always participate in management by
walking around: Take a stroll and look for access points and antennae. Look
for people using computers in places that you know are not wired. Again, this
is not 100 percent foolproof. If you have software inventory or configuration
22_575252 ch16.qxd 9/2/04 4:10 PM Page 283
management software, you could look for client utilities. You could also supple-
ment these methods with another automated one. After you have a wireless
network up and running, you want to run a post-implementation site survey.
To do so, you walk around with a laptop or handheld and do one or all of the
following to discover wireless networks:
ߜ Use the programs that came with your operating system.
ߜ Use the utilities that came with your network adapter.
ߜ Use war driving or network discovery tools.
ߜ Use traffic management and analysis software.
ߜ Use network management software.
ߜ Use network vulnerability software.
Using programs that came with
your operating system
As we point out in Chapter 6, you can use the built-in functionality of Windows
XP and Mac OS X to discover networks. These operating systems are wireless
network–aware. If you cannot remember how to use these utilities, go to that
chapter and read up on using the tools to connect to a network.
Using utilities that came with
your network adapter
Even though newer operating systems are wireless network–aware, your manu-
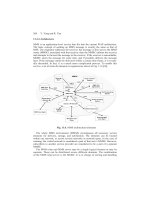
facturer will provide a utility to help you discover networks. In Figure 16-1,
you can see the information you can gather by using the Client Manager that
comes with ORiNOCO Silver and Gold cards. Use the pull-down arrows in the
various boxes to change what you can display. The ORiNOCO tool also pro-
vides an excellent Link Test dialog box as well.
In Chapter 11, we show you another utility that comes with the Proxim
802.11a/b/g Gold PC Card. Try these manufacturers’ utilities to test signal
strength and more:
ߜ Site survey tools: Discover networks, identify MAC addresses of access
points, and quantify signal strength and SNR ratios.
ߜ Spectrum analyzer: Find interference and overlapping channels.
284
Part IV: Keeping Your Network on the Air — Administration & Troubleshooting
22_575252 ch16.qxd 9/2/04 4:10 PM Page 284
ߜ Power and speed monitoring tools: Monitor throughput and current
connection capacity.
ߜ Profile configuration utilities: Configure profiles for different networks.
ߜ Link status monitor with link testing functionality: View packets, suc-
cessful transmissions, connection speed, and link viability.
Use these tools but don’t forget to use free network discovery tools, such as
Boingo (
www.boingo.com) as well.
Using war driving or network
discovery tools
Several times in the book (for instance, Chapters 2, 5, 9, 15, and 17), we refer
to war driving software. War driving software is the equivalent of the Swiss
Army knife for network and security administrators alike. Of the many genre
of this software, start with the following list:
ߜ AirMagnet:
www.airmagnet.com
ߜ AirSnort:
ߜ AirTouch Network Security System War Driving Kit:
www.airtouchnetworks.com
Figure 16-1:
ORiNOCO
Client
Manager –
Site
Monitor.
285
Chapter 16: It’s Ten O’Clock: Do You Know Where Your Access Points Are?
22_575252 ch16.qxd 9/2/04 4:10 PM Page 285
ߜ dstumbler: www.dachb0den.com/projects/dstumbler.html
ߜ kisMac: www.binaervarianz.de/projekte/programmieren/kismac
ߜ kismet: www.kismetwireless.net
ߜ MacStumbler: www.macstumbler.com
ߜ MiniStumbler: www.netstumbler.com
ߜ NetStumbler: www.netstumbler.com
ߜ WaveStumbler: www.cqure.net/tools.jsp?id=08
As you can see from the preceding list, several platforms and operating sys-
tems have software support. You have Mac OS X, Pocket PC, Windows NT/
2000/XP, GNU/Linux, and FreeBSD support. NetStumbler for Windows and
Kismet for GNU/Linux are the most popular of the network discovery genre.
MacStumbler for Mac OS X and dstumbler for BSD are popular in their spheres.
Using traffic management
and analysis tools
Wireless networks are broadcast networks, and broadcast networks are great
for packet analyzers or sniffers. Sniffer is a trade name of Network General
(which later became Network Associates). Unfortunately for Network Associ-
ates, the term sniffer became generic. Take out a tissue and cry for them. Okay,
maybe not. But rather than offend anyone, we use the more generic name of
packet analyzer (although some may prefer the term protocol analyzer).
Packet analyzers go beyond detecting the existence of a wireless network. By
turning your wireless adapter into a promiscuous device, packet analyzers
capture the frames you want, which may be all of them. You can set filters to
determine what frames the packet analyzer will collect. With these tools, you
can look at the contents of the captured frames right down to the bit level.
You can fix existing problems or understand potential ones through analysis.
The following products support wireless packet analysis:
ߜ Ethereal:
www.ethereal.com
ߜ Berkeley Varitronics Grasshopper and Yellowjacket:
www.bvsystems.com
ߜ Epiphan CENiffer: www.pocketpccity.com/software/pocketpc/
CENiffer-2001-11-16-ce-pocketpc2002.html
ߜ Fluke Networks WaveRunner: www.fluke.com
ߜ Gulpit: www.crak.com/gulpit.htm
286
Part IV: Keeping Your Network on the Air — Administration & Troubleshooting
22_575252 ch16.qxd 9/2/04 4:10 PM Page 286
ߜ Netintact PacketLogic: www.netintact.com
ߜ Network Associates Sniffer Wireless: www.sniffer.com
ߜ Network Instruments Network Observer:
www.networkinstruments.com
ߜ Tamosoft CommView: www.tamos.com/products/commview
ߜ WildPackets AiroPeek NX: www.wildpackets.com
You can find more information about wireless sniffers at www.personaltelco.
net/index.cgi/WirelessSniffers
and www.blacksheepnetworks.com/
security/resources/wireless-sniffers.html
.
If you use the GNU/Linux version of Ethereal, it supports wireless packet
analysis. The same is not true for the Windows version. With the Windows
version, you have to grab the packets for analysis from the wired segment.
You can find further information on Ethereal in Chapter 17 and on AiroPeek
NX later in this chapter. Berkeley’s Grasshopper is a handheld, wireless, 2.4
GHz receiver that measures and displays RF power and narrowband receive
signal strength indicator (RSSI) total channel power. What’s more, you can use
Grasshopper to measure packet error rate and channel usage. A dedicated
tool such as Grasshopper is nice, but it may cost you as much as or more
than a good laptop with packet analyzer software installed.
Several companies offer an appliance, as well. For example, Network Chemistry
offers a Neutrino Sensor bundled with the freeware Packetyzer (
www.network
chemistry.com/products/packetyzer
) software, which allows you to cap-
ture and analyze 802.11 packets. The sensor captures all 802.11 packets and
then forwards the captured packets over the wired network to Packetyzer for
analysis and display. Packetyzer can decode WEP, WPA, LEAP, 802.1X, IPSec,
and many other authentication protocols.
Using network management tools
You may already have some software in your organization that you can also
use to locate authorized or unauthorized APs. Network management software
can help you map out known and unknown devices.
Following is a short list of network management products:
ߜ 3Com Network Director:
www.3com.com
ߜ AdRem Software NetCrunch: www.adremsoft.com
ߜ Castle Rock Computing SNMPc: www.castlerock.com
287
Chapter 16: It’s Ten O’Clock: Do You Know Where Your Access Points Are?
22_575252 ch16.qxd 9/2/04 4:10 PM Page 287
ߜ Cisco CiscoWorks: www.cisco.com
ߜ Computer Associates UniCenter Application Performance Monitor:
www.ca.com
ߜ Enterasys Networks NetSight Atlas: www.enterasys.com
ߜ HP OpenView: www.hp.com
ߜ IBM Tivoli: www.ibm.com
ߜ Ipswitch WhatsUp Gold: www.ipswitch.com
ߜ Netintact PacketLogic: www.netintact.com
ߜ Netplex Technologies SNIPS: www.netplex-tech.com/software/snips
ߜ Opalis Software OpalisRobot: www.opalis.com
ߜ SolarWinds Network Management Tools: www.solarwinds.net
ߜ Symbol Technologies AirBeam: www.symbol.com
The term network management system (NMS) means different things to differ-
ent people. But basically, a good NMS provides what the ISO defines as FCAPS,
which stands for the following:
ߜ Fault management: Detection, isolation, and correction of abnormal net-
work operation
ߜ Configuration management: Configuration, documentation, maintenance,
and updating of network components
ߜ Accounting or administration management: Detecting inefficient network
use, or abusing network privileges or usage patterns
ߜ Performance management: Monitoring and maintenance of acceptable
network performance, and collection and analysis of statistics critical to
network performance
ߜ Security management: Controlling and monitoring the access to network
and associated network management information
Regardless of your organization’s size, you will find that a network manage-
ment system or tool effectively reduces the cost and complexity of your net-
work. The NMS provides an integrated set of tools that allows you to quickly
isolate and diagnose network issues. Sure, you can spend hundreds of thou-
sands of dollars on IBM’s Tivoli, but you will only spend hundreds of dollars
to get WhatsUp Gold.
288
Part IV: Keeping Your Network on the Air — Administration & Troubleshooting
22_575252 ch16.qxd 9/2/04 4:10 PM Page 288
Using vulnerability testing software
If you have Internet access, chances are that you’ve used vulnerability scan-
ners before. eEye (
www.eeye.com/html), GFI (www.gfi.com/languard),
Harris (
www.stat.harris.com), ISS (www.iss.net), and Symantec (www.
symantec.com
) market some of the more popular commercial products. You
may have heard of some of the more famous freeware ones: nessus and nmap.
There are even database and application scanners, and now wireless scan-
ners. Vulnerability scanners work by doing a point-in-time review, looking for
known problems and reporting them to you.
Among the wireless vulnerability scanners are
ߜ AirMagnet:
www.airmagnet.com
ߜ ISS Wireless Scanner: www.iss.net
ߜ WaveSecurity Wavescanner: www.wavesecurity.com
Figure 16-2 shows you access points that Wireless Scanner found.
Click the Vulnerabilities tab, and you see a list like the one in Figure 16-3.
Figure 16-2:
ISS
Wireless
Scanner.
289
Chapter 16: It’s Ten O’Clock: Do You Know Where Your Access Points Are?
22_575252 ch16.qxd 9/2/04 4:10 PM Page 289
You see two different icons in the view. The Yield (yellow) icon is a medium
risk, and the Do Not Enter (red) icon is high risk. Don’t know what the high risk
vulnerability means? Simple. Just right-click any one, select What’s this vuln?
from the menu, and you see a description like the one shown in Figure 16-4.
The tools listed in all these categories cannot find any WAP or bridge that is
not left turned on, so you need to supplement the tools above with one addi-
tional step. You need to check out the Web sites that document wireless LANs
that other people have found. You can find these lists at
ߜ Nakedwireless.ca:
www.nakedwireless.ca
ߜ NetStumbler: www.netstumbler.com/nation.php
ߜ Wi-Fi Zone: www.wifizone.org
ߜ Wifinder.com: www.wifinder.com
ߜ WiGLE: www.wigle.net
We hope you won’t find any of your access points on these sites!
Figure 16-3:
ISS
vulnerabil-
ities tab.
290
Part IV: Keeping Your Network on the Air — Administration & Troubleshooting
22_575252 ch16.qxd 9/2/04 4:10 PM Page 290