Báo cáo y học: "Wound healing and inflammation genes revealed by array analysis of ''''macrophageless'''' PU.1 null mice" ppt
Bạn đang xem bản rút gọn của tài liệu. Xem và tải ngay bản đầy đủ của tài liệu tại đây (5.39 MB, 17 trang )
Genome Biology 2004, 6:R5
comment reviews reports deposited research refereed research interactions information
Open Access
2004Cooperet al.Volume 6, Issue 1, Article R5
Research
Wound healing and inflammation genes revealed by array analysis
of 'macrophageless' PU.1 null mice
Lisa Cooper
*§
, Claire Johnson
†
, Frank Burslem
†
and Paul Martin
*‡
Addresses:
*
Department of Anatomy and Developmental Biology, University College London, London, WC1E 6BT, UK.
†
Pfizer Global Research
and Development, Sandwich, Kent, CT13 9NJ, UK.
‡
Departments of Physiology and Biochemistry, University of Bristol, Bristol, BS8 1TD, UK.
§
Current Address: Molecular Neuroscience Group, School of Medicine, University of Birmingham, Birmingham, B15 2TH, UK.
Correspondence: Paul Martin. E-mail:
© 2004 Cooper et al.; licensee BioMed Central Ltd.
This is an Open Access article distributed under the terms of the Creative Commons Attribution License (
which permits unrestricted use, distribution, and reproduction in any medium, provided the original work is properly cited.
Wound healing and inflammation genes revealed by array analysis of 'macrophageless' PU.1 null mice<p>To define the events in wound healing that are independent of inflammation, gene expression during wound healing was profiled in wild-type mice and PU.1 null mice, which cannot raise the standard inflammatory response but which can repair skin wounds rapidly.</p>
Abstract
Background: Wound healing is a complex process requiring the collaborative efforts of different
tissues and cell lineages, and involving the coordinated interplay of several phases of proliferation,
migration, matrix synthesis and contraction. Tissue damage also triggers a robust influx of
inflammatory leukocytes to the wound site that play key roles in clearing the wound of invading
microbes but also release signals that may be detrimental to repair and lead to fibrosis.
Results: To better define key cellular events pivotal for tissue repair yet independent of
inflammation we have used a microarray approach to determine a portfolio of over 1,000 genes
expressed across the repair response in a wild-type neonatal mouse versus its PU.1 null sib. The
PU.1 null mouse is genetically incapable of raising the standard inflammatory response, because it
lacks macrophages and functioning neutrophils, yet repairs skin wounds rapidly and with reduced
fibrosis. Conversely, by subtraction, we have determined genes that are either expressed by
leukocytes, or upregulated by fibroblasts, endothelial cells, muscle cells and others at the wound
site, as a consequence of inflammation. To determine the spatial expression pattern for several
genes in each cluster we have also performed in situ hybridization studies.
Conclusions: Cluster analysis of genes expressed after wounding wild-type mice versus PU.1 null
sibs distinguishes between tissue repair genes and genes associated with inflammation and its
consequences. Our data reveal and classify several pools of genes, giving insight into their likely
functions during repair and hinting at potential therapeutic targets.
Background
Much is known about the sequence of cell and tissue behavior
that leads to repair of a mammalian skin wound [1,2] but we
still have a rather incomplete knowledge of the portfolio of
genes that drives these events. From late fetal stages onwards,
tissue repair is always accompanied by a robust inflammatory
response and this intimate association between wound heal-
ing and inflammation has made it difficult to dissect out the
key elements of the repair process from those that are simply
a consequence of inflammation and not necessary for healing.
For this reason, and because adult skin healing is a complex
process drawn out over several days to weeks, no systematic
microarray analysis has yet been undertaken to encompass all
Published: 23 December 2004
Genome Biology 2004, 6:R5
Received: 2 September 2004
Revised: 29 October 2004
Accepted: 24 November 2004
The electronic version of this article is the complete one and can be
found online at />R5.2 Genome Biology 2004, Volume 6, Issue 1, Article R5 Cooper et al. />Genome Biology 2004, 6:R5
those episodes from initial injury to the final sealing of the
wound.
The compelling argument for performing such a study comes
from microarray investigations of genes upregulated in
fibroblasts in response to serum exposure. Cluster analysis of
these results hints at the roles of hundreds of genes by the
similarity of their temporal profile with genes whose function
as part of the serum response cascade is well characterized
[3,4]. To overcome the problems of extended wound repair
time course and to distinguish repair genes from those
involved in, or a consequence of, inflammation, we have
developed an incisional wound model in neonatal mice where
healing is rapid and largely complete by 24 hours and we have
used this model to compare wound-expressed genes in wild-
type mice versus PU.1 null sibs which are genetically incapa-
ble of raising an inflammatory response because they lack key
leukocyte lineages.
PU.1 is an ETS family transcription factor that is crucial for
several lineage decisions in hematopoetic cells; consequently,
PU.1 null mice lack a number of hematopoetic cell types [5].
They are born with no macrophages or osteoclasts, and there
is a late onset of neutrophil and T-cell development [5]. How-
ever, although there are no neutrophils or macrophages for
recruitment to sites of tissue damage, neonatal PU.1 null mice
can efficiently heal skin wounds [6]. Indeed, repair in the
PU.1 null mice results in less indication of fibrosis and an
altered cytokine and growth-factor profile compared to wild-
type. For example, interleukin 6 (IL6) mRNA, which is
robustly expressed at wild-type wound sites, is almost unde-
tectable in PU.1 null wounds, and TGFβ1 mRNA, previously
implicated in several fibrosis scenarios, is significantly
reduced in PU.1 null wounds, as revealed by RNase protection
analyses [6].
In this study we use Affymetrix GeneChip analysis of mRNAs
collected at various time points after wounding of wild-type
versus PU.1 null skin, to distinguish those key transcriptional
events that are part of the tissue repair process but independ-
ent of whether or not there is an accompanying inflammatory
response, from those genes that are 'inflammation depend-
ent'. The latter are expressed either by inflammatory cells
recruited to the wound, or upregulated by fibroblasts,
endothelial cells, muscle cells and others at the wound site, as
a consequence of inflammation.
Using cluster analysis we have grouped more than 1,000
wound-induced genes according to their temporal profiles,
with each cluster having a unique temporal profile of expres-
sion that correlates with a clear physiological episode during
the repair process. For a small sample of genes from each of
these clusters, we show in situ hybridization data that also
reveals spatial resolution.
Results and discussion
For our wound model we chose neonatal mouse back skin
which raises a robust inflammatory response to wounding
that is not dissimilar to that seen at sites of tissue damage in
adult skin, but which heals rapidly, such that incisional
lesions are generally fully re-epithelialized by 24 hours. This
compression of the repair process reduces the temporal
'noise' and thus the potential loss of gene-expression syn-
chrony between wild-type and PU.1 null animals, which nat-
urally will increase with time after the initial wound insult.
Wounding of neonatal back skin results in rapid healing
with or without an associated inflammatory response
Resin histology of healing incisional wounds in neonatal
mouse skin reveals closure of the wound commencing within
3 hours of the lesion; by 24 hours, the epidermal wound edges
have generally met and fused along much, if not all, of the
length of the wound. This is true for both wild-type neonates
and for PU.1 null sibs, with the only obvious differences
apparent in the histology being an absence of inflammatory
cells in the PU.1 null wounds (Figure 1c-j). As previously
described, in situ hybridization studies using a c-fms macro-
phage-specific probe reveal large numbers of these cells
drawn to the wound connective tissue just beneath the epi-
dermal fusion seam at 24 hours after wounding wild-type
skin, but their complete absence in PU.1 null equivalent
wound sections (Figure 1k,l). The same difference, although
with an earlier temporal profile, is observed if wounds of
wild-type and PU.1 null skin are probed with histochemical
stains that reveal neutrophil influx (data not shown). These
wound dynamics lead us to believe that the neonatal mouse
skin wound model provides a good opportunity to analyze the
transcriptional events that regulate the various tissue-repair
episodes from initial activation steps through to the 'stopping'
signals that occur when the tissue defect has been filled in,
both in the presence and absence of an inflammatory
response.
More than 1,000 genes are differentially expressed
post-wounding
For microarray comparison, a consistent series of horizontal
and vertical incisional (criss-cross) wounds were made to the
back skin of 2-day-old neonatal PU.1 null mice and their wild-
type littermates. Each time-matched pair (PU.1 null and wild-
type) were chosen from the same litter to reduce the possibil-
ity of differential expression 'noise' due to environmental dif-
ferences. Wound tissues were harvested at either 30 minutes
to identify immediate early genes, 3 hours for early tissue
repair effector genes, and 12 or 24 hours to reveal later tissue
repair effectors as well as inflammatory genes. Total RNA was
then extracted and hybridized to Affymetrix GeneChips, and
differentially expressed genes were identified by comparison
of expression levels for each time point with unwounded skin
samples that served as baseline controls. Genes were selected
if transcript levels exceeded a twofold increase over either the
unwounded baseline, or between time points, or between the
Genome Biology 2004, Volume 6, Issue 1, Article R5 Cooper et al. R5.3
comment reviews reports refereed researchdeposited research interactions information
Genome Biology 2004, 6:R5
wild-type and PU.1 null wounds. On the basis of these criteria,
1,001 genes were identified as wound-induced (see Additional
data file 1 for an annotated database of all these genes
together with full details of expression levels at all time
points).
Cluster analysis to group these genes reveals temporal
profiles that correlate with distinct physiological
episodes in the repair process
Cluster analysis with Spotfire Array Explorer 3.0 software
was used to organize the 1,001 wound-induced genes into
groups according to the cosine coefficient similarity measure-
ment; this includes within a group all those genes that have a
similarly shaped temporal profiles, regardless of the levels of
gene expression. Nine clusters were identified in this way,
and of these, seven correlated with clear episodes in the repair
process. The other two had profiles that, as far as we can tell,
do not correspond to any currently understood step in the
repair process and so were discarded for further analysis,
although they appear in our supplementary data (see Addi-
tional data file 2 for median graphs of these clusters). Of the
seven clusters associated with known repair episodes, five
contain one or more known genes with good functional asso-
ciations to that repair episode, and this encourages us to
name each cluster according to that physiological episode.
This does not provide definitive proof of function for any gene
in that cluster, but it gives the best opportunity to predict
function, particularly for expressed sequence tags (ESTs)
with no further sequence information.
Four clusters have profiles that are independent of an
inflammatory response
Four clusters of genes have profiles that are largely independ-
ent of inflammation. Genes in these clusters are expressed
with similar profile whether wounds are in wild-type skin,
where there is an influx of inflammatory cells, or in PU.1 null
skin, where there is none. In both these situations there is full
and complete repair, and so we propose that these four clus-
ters represent the basic repertoire of repair genes that are
activated during the repair response. Figure 2 shows line
graphs that display the temporal profile of the median expres-
sion levels at each time point to give a representation of that
cluster and these have been termed the 'activation' (Figure
2a), 'early effector' (Figure 2b), 'late effector' (Figure 2c) and
'stop' (Figure 2d) clusters. The number of genes found in each
cluster is displayed on each graph.
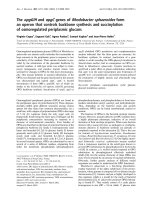
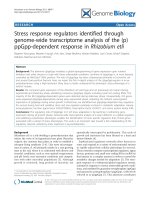
Wound histologyFigure 1
Wound histology. The location of skin wounds on the back of a neonatal
mouse is shown. (a) For the array studies a series of criss-cross wounds
were made so that all the skin cells were as close as possible to a wound
edge for collection of wound RNA. (b) For in situ hybridization studies and
immunohistochemistry we made a series of three incisional wounds, so
that transverse sections (broken line) contained the profiles of several
wounds. Resin histology through wild-type (left-hand column) and PU.1
null wounds (right-hand column) at (c,d) 0.5 h, (e,f) 3 h, (g,h) 12 h and
(i,j) 24 h post-wounding. At all stages, arrows mark the epidermal wound
edges, which are seen to have met and fused in both genotypes by 24 h.
An asterisk (*) marks the migrating epithelial edge. (k,l) In situ
hybridization using a macrophage-specific C-fms probe reveals large
numbers of macrophages recruited to the granulation tissue in frozen
sections through 24 h wounds in wild-type skin (k), while none are present
in equivalent tissues of the PU.1 null mouse (l). Scale bars = (c-j) 400 µM;
(k,l) 250 µM.
Microarray
In situ
1 cm
0.5 cm
PU.1 null
c-fms
30 min
3 h
12 h
24 h
Wild-type control
(a) (b)
(c) (d)
(e) (f)
(g) (h)
(i) (j)
(k) (l)
R5.4 Genome Biology 2004, Volume 6, Issue 1, Article R5 Cooper et al. />Genome Biology 2004, 6:R5
Three gene clusters correlate with various phases of
the inflammatory response
Three further clusters of genes represent expression profiles
that correlate with the onset of inflammation and thus we
consider them inflammation-associated genes. In neonatal
animals, the inflammatory response is generally induced by
12 hours and is well established by 24 hours post-wounding.
Two of these inflammation-associated gene clusters contain
genes that are not expressed in unwounded skin or at early
stages of repair; rather, they are upregulated in wild-type skin
directly coincident with the onset of the wound inflammatory
response but are generally not upregulated in the PU.1 null
wound site at any stage. We have called these two groups of
genes, the 'early inflammatory' cluster (Figure 2e) and the
'late inflammatory' cluster (Figure 2f). A third cluster does
not display the standard inflammatory response profile as
typified by the early and late inflammatory clusters. Rather,
this cluster contains genes that are expressed at early stages
of repair in both PU.1 null and wild-type mice but, whereas
expression appears to increase in the wild-type wound
coincident with the inflammatory response, the same genes
are downregulated in the PU.1 null wound, where there is no
inflammatory response; we have called this group of genes
the 'inflammation-maintained' cluster (Figure 2g).
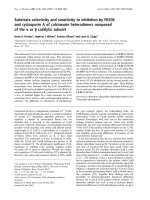
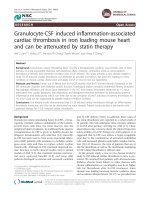
Median temporal profile graphs of identified repair and inflammation clustersFigure 2
Median temporal profile graphs of identified repair and inflammation clusters. Line graphs displaying the median level of absolute mRNA expression (y-axis)
at each time point: 0, 0.5, 3, 12 and 24 h (x-axis), for genes within each of the four repair clusters and the three inflammation clusters, giving representative
temporal profiles for the cluster. Pink lines represent the temporal profiles of expression for the PU.1 null wound site, blue lines those for the wild-type
wound site. (a-d) The inflammation-independent gene clusters: (a) activation; (b) early effector; (c) late effector; (d) stop. (e-g) The inflammation-
dependent clusters: (e) early inflammatory; (f) late inflammatory; (g) inflammation-maintained. The scale of absolute expression levels along the y-axis
varies according to the maximum levels of expression in each cluster.
Activation Early effector
Stop
Early inflammatory Late inflammatory
Inflammation-maintained
n=90
n=138
n=172
n=38 n=131 n=17
Late effector
n=46
0
100
200
300
400
500
600
700
800
0
50
100
150
200
250
300
350
400
0
200
400
600
800
1000
1200
0
50
100
150
200
250
300
0
50
100
150
200
250
300
350
400
0
50
100
150
200
250
300
0
100
200
300
400
500
600
700
0 hours
0.5 hours
3 hours
12 hours
24 hours
0 hours
0.5 hours
3 hours
12 hours
24 hours
0 hours
0.5 hours
3 hours
12 hours
24 hours
0 hours
0.5 hours
3 hours
12 hours
24 hours
0 hours
0.5 hours
3 hours
12 hours
24 hours
0 hours
0.5 hours
3 hours
12 hours
24 hours
0 hours
0.5 hours
3 hours
12 hours
24 hours
(a) (b)
(c)
(e) (f) (g)
(d)
Genome Biology 2004, Volume 6, Issue 1, Article R5 Cooper et al. R5.5
comment reviews reports refereed researchdeposited research interactions information
Genome Biology 2004, 6:R5
Nearly 100 genes are expressed with an immediate
early gene profile at the wound site
One of the most clear-cut clusters of genes is of those whose
temporal expression profiles are suggestive of a transient,
immediate early response to wounding. These genes show
almost identical profiles, whether in the wild-type or PU.1
null situation, and thus are independent of an inflammatory
response. We have named this group the activation cluster, as
many will be kick-start activators of the various cell behaviors
that together comprise the wound-healing process. This clus-
ter is dominated by transcription factors and contains several
well known immediate early genes, such as Egr1 (Krox 24),
JunB, Myc, and I-Kappa-B
α
(Nfkbia). We present a heatmap
for the 90 genes in this cluster arranged with the most highly
expressed at the top of the map (Figure 3a). Heatmaps pro-
vide a visual representation of temporal profiles only, and so
for a small sample of these genes we also include in situ
hybridization data on wounded skin sections to illustrate
which cells and tissues express that particular gene. This spa-
tial expression profile reveals expression in the in vivo set-
ting, giving clues to the function of that gene during repair.
Krox24 (Figure 4a) has previously been shown to be tran-
siently induced in both embryonic and adult mouse wounds
[7]. In situ hybridization reveals Krox24 to be expressed by
those epidermal cells extending back 10-12 cell diameters
from the cut edge of neonatal wounds and all the associated
hair follicles within this zone also (Figure 4b).
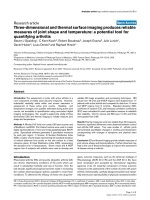
Heatmaps for activation and effector clustersFigure 3
Heatmaps for activation and effector clusters. Color depiction of the temporal profiles of mRNA intensity during the 24 h repair period for genes in (a)
the activation cluster, (b) the early effector cluster and (c) the late effector cluster. Higher levels of expression are indicated by progressively brighter
shades of red, and lower expression levels by increasingly brighter shades of green. The scale bar indicates absolute expression as a measure of
fluorescence units. Genes are ordered with the most highly expressed first. Gene names are shown to the right of the maps and further bioinformatics
data for each can be found in Additional data file 1. Expression levels for the PU.1 null wound site at 0, 0.5, 3, 12 and 24 h are shown on the right and the
equivalent expression levels for the wild-type (WT) wounds on the left.
(b) Early effector cluster (c) Late effector cluster
0.5 3 0.5 3
Alox15b
MMP13
Ctsb
Gsta4
Hellcard
Usp18
Cyp1b1
Gyk
Sic2a1
Tm4sf7
Procr
Osmr
Psmb8
Ifl204
Cxcl5
MMP9
EST M74123
IIgp
Isgf3g
MMP3
IL1rl1
EST AA689670
Defb1
Isg15
Saa1
Lrg
Sipl
Prssi8
EST AI848825
Chl3l1
Sprr2c
Sp12-2
Saa3
Sprr2f
Tnc
Sprr2a
Sprr2d
Krt2-6b
Timp
Anxa8
Sprr2h
Krt1-16
Hp
Sprr1b
S100a8
Krt2-6a
S100a6
Fth
EST C85523
Mll
Tubb5
Ly6e
Sprr2b
Hifla
LamC2
Mapk5
EST AW123754
EST AW080684
Thy1
Pplia
EST AI852001
EST AI121305
EST AI842277
Fgfrp
Serpinb2
Sgk
Lgala9
Integrin B4
IL1r2
Lamb3
TGFb induced
Gpx3
Hnrpdl
Saa1
Serpina3c
EST AI852933
Stat3
Ta pb p
Gp38
Rbp1
Rnase4
Lfbr
EST AI853172
Serping1
Xdh
Gjb6
Scaa2
EST AW211780
Acad1
S3-12
EST AW227650
Sod2
Ptges
IL4ra
H2-T22
Lbp
Tgm3
Gjb6
EST AI852581
EST AI846382
Map4k4
Fgl2
Sod3
Sphk1
Ifgab
Fin14
Car4
EST C78850
Lsnax
Fxyd5
Myd88
Lama3
Hmgcr
Proa1
Crabp2
Ddef1
Cenbp
Trim25
Kcnk7
Adcy4
EST AW046124
Myf6
Osp94
Plaur
Fv1
EST AI536457
Ctla2a
EST AA008387
Pex5
Map3k1
EST AA867778
Ptgls
Pld1
EST AW046150
Car2
Kic1
Ppt2
EST AA960657
Hck
EST AI852148
Gaigt1
Igh-8
Mal
IL8rb
Spf12
Rmga2
Dnajc3
Thbd
Serpine1
Tgm2
Areg
Aldh1a3
Nfh
Stk2
Gch
Stal1
EST AW123729
EST AI882555
Vdr
EST AA881294
EST AI845009
EST AW123223
Rock2
EST AA259683
EST AI839611
EST AI849305
Klkbp
Ereg
Sdcbp1
Mmp11
Alrp
Ta c1
EST AA276948
Eps8
EST AA738776
Nat2
Pfkp
Vcam1
Sh3yt3
EST AW107463
EST AW047207
Ly6a
Pdgfrs
Sprr2a
Col6a3
Actc1
Serpinh1
Nfkb1a
Col5a2
MKP-1
Col6a2
Fosb
Mfap2
Ler2
Egr1
Junb
Junb
EST AI853531
EST AI642048
Mest
EST AI596710
Tnni1
Adh1
EST AW049031
Cirbp
Nr4a1
Fkbp5
Tgfb1la
EST X67664
Gsto1
Atf3
Zfp36
P2rx5
Gro1
MalI
EST AI854154
Gro1
EST AW212475
ALAS2
H1f2
KLf9
Tieg
Ccr4
EST AI844626
Has1
Bcl10
Csf3
Alox12b
EST AA795541
Atf3
Csf1
Capn6
Irs2
Tieg
Csrp3
Fosl1
Per
Csrp2
Cish2
EST AA710439
EST AI851599
Rgs16
Icam1
AK1
Ccne1
Adrb1
Irf1
Bhihb2
Hexa
Fbin1
Bpgm
Pscd3
Hegf1
Cyr61
EST AW120586
EST AW047643
EST AI553024
Myc
EST AI843571
EST AW125800
Prom
EST AW048883
Gem
Gins
Casp7
Figf
EST AA673486
EST AW125284
Ptgs2
Sele
Agxt
Snca
Per2
EST AA414993
(a) Activation cluster
WT control
PU.1 null
0
12 24 0 12 24
WT control
PU.1 null
0.5 3 0.5 3
0
12 24 0 12 24
WT control PU.1 null
0.5 3 0.5 3
0
12 24 0 12 24
Absolute expression
(fluoresence units)
3,000 400 0
R5.6 Genome Biology 2004, Volume 6, Issue 1, Article R5 Cooper et al. />Genome Biology 2004, 6:R5
MKP-1 (Figure 4c) is a dual-specificity phosphatase with close
homology to Drosophila puckered, which has been shown
genetically to be key in braking the Jun N-terminal kinase
(JNK) cascade activated during morphogenetic episodes such
as dorsal closure in the fly embryo [8]. In situ hybridization
shows that the front few rows of wound epidermis express
MKP-1, although expression extends less far back from the
wound edge than for Krox24 (Figure 4d). By analogy to Dro-
sophila morphogenetic episodes, it may be that MKP-1 oper-
ates as suppressor of MAP kinase (MAPK) signaling by
phosphorylation of extracellular-regulated kinases 1 and 2
(ERK1 and 2), and so may actually function as a brake on the
earliest tissue movements activated at the wound site.
Expression of Fos-like antigen 1 (Fosl1, Fra1), has previously
been associated with epithelial migrations during tumorigen-
esis but has not been analyzed in a wound-repair model
[9,10]. Fosl1 has a classic activator temporal profile (Figure
4e) and a similar spatial profile to Krox24, with high levels of
expression in wound-margin epidermal cells but somewhat
weaker expression in damaged hair follicles at the wound site
(Figure 4f). Its close relative c-fos has previously been shown
to be upregulated during repair of embryonic skin wounds
[11], and in vitro studies show that blocking wound-induced
fos induction may hinder cell migration [12].
Because cluster analysis allows us to group genes together
that are likely to have similar functions [13], the temporal
profiles of, as yet, uncharacterized ESTs in the activation
cluster implicates them as having an immediate-early activa-
tor function during repair. A good example of such a gene is
EST GenBank accession number AI853531 (Figure 4g), which
is weakly homologous to human Mitogen-Inducible-Gene-6
(Mig-6, Gene 33). The exact function of Mig-6 remains elu-
sive but it has been shown to interact with Cdc42, a member
of the Rho family of GTPases, via the activation of stress-acti-
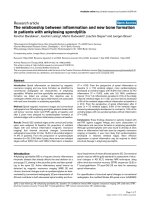
Temporal and spatial expression profiles of sample genes from the activation and effector clustersFigure 4
Temporal and spatial expression profiles of sample genes from the activation and effector clusters. Temporal and spatial profiles of the (a-h) activation and
(i-p) effector clusters. The line graphs display temporal expression: absolute expression levels (y-axis) at each time point (x-axis) with both PU.1 null (pink)
and wild-type profiles (blue). The y-axis range varies depending on the expression levels for each gene. The photomicrographs show in situ hybridization on
3 h (b,d,f,h) and 12 or 24 h (j,l,n,p) frozen wild-type wounds. (a,c,e,g) Temporal profiles of each of the activation genes show a rapidly induced but transient
expression peak at 3 h in both PU.1 null and wild-type wounds. (b) Krox24 is expressed by wound margin epidermal cells extending back 10-12 cell
diameters from the wound edge and also by associated hair follicles (arrows). (d) MKP-1 is expressed by the first 5-8 front-row keratinocytes and a subset
of dermal fibroblasts (arrows). (f) High levels of Fosl1 expression in wound margin epidermal cells and weaker expression in damaged hair follicles
(arrows). (h) EST GenBank accession number AI853531 appears to be expressed by wound fibroblasts (arrows). (i,k,m,o) The early and late effector gene
samples all exhibit expression profiles with upregulation either at 12 h (i,k), or 24 h (m,o), whether in PU.1 null or wild-type wound tissues. (j) Map4k4 is
expressed up to 10-12 cell diameters from the wound edge and in dermal fibroblasts (arrows). (l) Rbp1 is expressed in epidermal cells approximately 15
cell diameters from the wound site. (n) K6 expression is restricted to 10-12 rows of wound edge keratinocytes. (p) MRP8 has a rather similar keratinocyte
expression to K6, but is also expressed to a lesser extent in leukocytes in wild-type wounds (arrows). Scale bar = 400 µm.
(f)
MKP1 (c)
Egr1 (Krox 24) (a)
Fosl1 (e)
EST AI853531 (g)
(d)
(h)
(b)
(l)
Map4k4 (i)
Rbp1 (k)
(j)
K6 (m)
MRP8 (o)
(n)
(p)
0
500
1000
1500
2000
2500
3000
0
1000
2000
3000
4000
5000
6000
0 hours 0.5 hours 3 hours 12 hours 24 hours
0 hours 0.5 hours 3 hours 12 hours 24 hours
0 hours 0.5 hours 3 hours 12 hours 24 hours
0 hours 0.5 hours 3 hours 12 hours 24 hours
0 hours 0.5 hours 3 hours 12 hours 24 hours
0 hours 0.5 hours 3 hours 12 hours 24 hours
0 hours 0.5 hours 3 hours 12 hours 24 hours
0 hours 0.5 hours 3 hours 12 hours 24 hours
0
100
200
300
400
500
600
0
300
600
900
1200
1500
1800
0
400
800
1200
1600
2000
0
200
400
600
800
1000
0
1000
2000
3000
4000
5000
6000
7000
0
1000
2000
3000
4000
5000
6000
WT
KO
WT
KO
WT
KO
WT
KO
WT
KO
WT
KO
WT
KO
WT
KO
Genome Biology 2004, Volume 6, Issue 1, Article R5 Cooper et al. R5.7
comment reviews reports refereed researchdeposited research interactions information
Genome Biology 2004, 6:R5
vated protein kinases (SAPKs) [14]. In situ hybridization
reveals clear expression of this gene in wound fibroblasts
(Figure 4h); together with its potential Cdc42 effector status
and its induction in quiescent fibroblasts upon mitogenic
stimulation and expression in many human cancer cell lines
[15], this suggests that Mig-6 may mediate a fibroblast migra-
tion signal. The remaining genes in the activation cluster all
have very similar temporal profiles, suggesting that they too
may have important roles in activating or modulating early
cell behavior at the wound edge.
A further 200 genes are also expressed independently
of inflammation, but with later onset and a less
transient time course
Two further clusters of genes have increased expression levels
post-wounding in a manner that is also inflammation-inde-
pendent but where expression occurs at a later time than with
the activation genes. The profiles of these two clusters are
temporally distinct from one another and so we have called
them the early effector and late effector clusters. Between
them they contain 184 genes that fit the expected profile of
genes that might direct re-epithelialization and granulation
tissue assembly events. The temporal profiles of all these
genes can be seen by heatmap in Figure 3b (early effector
cluster) and Figure 3c (late effector cluster). These two clus-
ters contain varied types of tissue repair effectors such as tis-
sue remodelers, genes encoding extracellular matrix (ECM)
proteins, those involved in the signaling machinery and struc-
tural genes required for cell migration. Again, we provide
here several examples of genes within these clusters with
accompanying in situ hybridization data to provide an insight
into the spatial localization of some genes in these clusters.
Map4k4, a member of the serine/threonine protein kinase
family that activates the JNK and MAPK signaling pathways
in response to stress signals, cytokines and growth factors
[16], is a member of the early effector cluster. The temporal
profile (Figure 4i) and expression of Map4k4, in both kerati-
nocytes up to 10-12 cell diameters from the wound edge and a
subset of dermal fibroblasts extending a similar distance back
from the wound edge (Figure 4j), confirms the activation of
this intracellular signaling cascade at sites of tissue repair.
The JNK pathway has recently been shown to have a role in
Paxillin regulation during fibroblast migrations triggered by
in vitro scratch wounds [17], and so expression of Map4k4 is
also suggestive of a cell migratory regulatory role for this sig-
naling pathway in keratinocytes and fibroblasts during in
vivo repair.
Also in the early effector cluster, retinol binding protein-1
(Rbp1), a Fabp/p2/Crbp/Crabp family retinol transporter is
expressed in wound epidermal cells approximately 15 cell
diameters back from the wound site (Figure 4k and 4l). This
suggests a role for retinoids in re-epithelialization of the
wound, and indeed, there is some evidence that these mole-
cules can trigger epidermal proliferation via heparin-binding
epidermal growth factor (HB-EGF) expression in suprabasal
epidermal cells [18].
Typifying the late effector profile is Keratin 6 (K6), a classic
wound-induced gene [19] (Figure 4m). K6 encodes a noncon-
ventional keratin which is thought to facilitate the packaging
up of other intermediate filaments in activated keratinocytes,
so that these cells can migrate forward to re-epithelialize the
wound [19]. High levels of expression of K6 by the front 10-12
rows of wound-edge keratinocytes were confirmed by in situ
hybridization (Figure 4n).
Interestingly, another member of the late effector cluster, the
intracellular Ca
2+
-binding protein MRP8 (S100A8) is
expressed in a similar temporal and spatial pattern to K6
(Figure 4o and 4p). MRP8 binds to keratin filaments as an
MRP8/14 heterodimer in a Ca
2+
dependent manner [20,21]
and is postulated to interact with these keratin filaments and
guide cytoskeletal rearrangements during tissue repair [22].
The temporal and spatial coexpression of K6 with MRP8 may
highlight a relationship between them and as such reveals
another advantage of cluster analysis - the ability to identify
potential interactions between genes and genetic pathways
within the same cluster.
Not all functionally related genes cluster together, however.
The heterophilic binding partner of MRP8 is MRP14, which
does not appear in the same cluster but rather is expressed
within the early inflammation cluster (see later), since, in
addition to keratinocyte expression, it is expressed at high
levels by wound leukocytes. As both the MRP8/MRP14 het-
erodimer and a homodimer, MRP8 is a potent chemoattract-
ant [22,23] and, interestingly, the MRP8/14 heterodimer also
has an entirely different role, operating as a wound antimi-
crobial factor, although the MRP14 subunit seems to be
responsible for this activity [24]. The pleiotropic activities of
MRP8/MRP14 may reflect different functions of monomeric
versus complexed subunits.
A final cluster of inflammation-independent genes may
indicate players in the 'contact inhibition' stopping
process
At the end of the repair process many of the cell behaviors
that drive repair - such as migration and proliferation - clearly
need to cease as tissues re-establish approximately their pre-
wound state. This will be a gradual process and yet we might
expect to see such genes depressed during the repair period
and becoming upregulated as wound edges meet and closure
is finishing. We see a cluster of genes with exactly this profile,
suggesting that some of these genes are re-expressed to con-
trol the later stages of repair. We have loosely termed this the
stop cluster. Because of their known biology, several genes in
this cluster make ideal candidates for players in the processes
of contact inhibition and epithelial fusion that occurs as cells
from the two epidermal wound fronts confront one another.
R5.8 Genome Biology 2004, Volume 6, Issue 1, Article R5 Cooper et al. />Genome Biology 2004, 6:R5
The Eph receptors and their ligands, the ephrins, have fea-
tures that might make them ideal for sensing and responding
to stop cues. In vitro studies show that both ligand- and
receptor-bearing cells become activated upon cell-cell contact
[25,26], and this interaction leads to a repulsive response by
receptor-expressing growth cones during the developmental
wiring of the nervous system [27]. Further evidence for
ephrin-mediated control of epithelial sheet movement and
fusion comes from studies in Caenorhabditis elegans, where
Eph receptor mutants display defects in the movement of epi-
dermal cells over neuroblasts, and in Eph knockout mice,
where various morphogenetic epithelial fusions fail, leading,
for example, to cleft palate and hypospadius [28,29]. All these
results suggest that the transcriptional regulation of EphB1
revealed in the heatmaps for our stop cluster (Figure 5a) may
reflect a functional role in the stopping or final fusion epi-
sodes of wound re-epithelialization.
Similarly, the expression levels of the receptor Notch also dip
and rise during the repair period, and in situ hybridization
studies reveal that this transcriptional regulation is also
occurring within leading wound-edge epidermal cells (Figure
5b-e). Notch has exceptionally complex biology with several
ligands, including Delta and Serrate, and is a widely used as a
signaling cassette at various stages of embryogenesis, and has
been shown to be downregulated in several invasive tumors
[30]. In Drosophila, Notch signaling has been implicated in
the contact inhibition and fusion events that occur during
dorsal closure at the end of embryogenesis (A. Martinez-
Arias, personal communication), and during gut cell migra-
tory episodes, which are also dependent on transcriptional
activation of the short stop gene [31], the mammalian ortho-
logue of which, Actin crosslinking family 7 (ACF7), is another
member of our wound stop cluster.
Several other genes within the stop cluster have characteris-
tics that indicate they may be involved in sensing contact-
inhibition cues or be downstream of these signals and operate
to adhere epidermal fronts together. They include genes for
Plexin 3 (Plxn3), a member of the plexin family of sema-
phorin receptors [32], Desmocollin 3 (Dsc3), which is a cad-
herin component of intercellular desmosomal junctions [33]
and ACF7, a cytoskeletal linker protein [34].
As with the other clusters, suggestive biology is no proof of
function, and it is worth noting that several other genes with
this temporal profile do not have biology suggestive of a role
in these late stages of wound healing. We feel that this cluster,
more than any other, can only hint at function, and definitive
function testing using knockout or knockdown assays will be
necessary to investigate any speculative roles in the repair
process.
Expression of 200 genes at the wound site is dependent
on the inflammatory response
A comparison of those genes expressed during the repair
process in wild-type versus PU.1 null mice reveals most
clearly genes that are dependent on the presence of an inflam-
matory response at the wound site. The heatmaps for early
and late inflammatory gene clusters strikingly reveal robust
expression in wild-type wounds, but little or no expression in
the PU.1 null mice for these genes (Figure 6). Together, the
early and late inflammatory clusters comprise 169 genes that
are not expressed in unwounded wild-type skin or at early
stages of repair but appear to be upregulated in the wild-type
wound directly, coincident with the onset of the inflammatory
response. The early inflammatory cluster typically contains
genes whose expression is upregulated rapidly in the wild-
type, often reaching a peak by 12 hours (Figure 6a), coinci-
dent with the influx of neutrophils to the wound site. In the
late inflammatory cluster, expression typically peaks a little
later, at 24 hours post-wounding (Figure 6b), more sugges-
tive of a link to the later influx of macrophages. A further 17
genes are initially expressed at both the wild-type and PU.1
wound site, but are maintained at high level only in the wild-
type wound, where there is an influx of leukocytes. In PU.1
null wounds, where there is no such influx, these genes are
only transiently expressed. We assume that expression of
these inflammation-maintained genes (Figure 6c) is directly
or indirectly dependent on signals released by inflammatory
cells.
Inflammation-dependent genes may be expressed by
leukocytes or by host cells as a 'response signature' to
inflammatory signals
Genes that are expressed only in wild-type wounds and whose
temporal expression patterns are coincident with the influx of
neutrophils and/or macrophages will include those genes
that are constitutively expressed by one or both of these line-
ages, or genes that are upregulated as part of the leukocyte
activation state, or may be expressed by cells other than the
invading leukocytes as a downstream consequence of host
fibroblast, endothelial and muscle cells being exposed to sig-
nals from these leukocytes. We present a selection of in situ
hybridization studies to illustrate each of these scenarios as
revealed by very distinct classes of spatial expression pattern.
Early inflammatory cluster
L-plastin (Lcp1) is a pan-leukocyte, calcium-dependent,
actin-bundling protein that has previously been implicated in
macrophage activation and migration, although it is also
overexpressed in many types of malignant human tumors
[35]. It is first expressed in the wild-type wound coincident
with the early stages of the wound inflammatory response,
with a peak of expression at 12 hours post-wounding; our
temporal data indicate no expression at any stage in PU.1 null
wounds (Figure 7Aa). In situ hybridization studies reveal
intense expression by leukocytes clustered within the wild-
type wound site but no expression in surrounding skin (Fig-
Genome Biology 2004, Volume 6, Issue 1, Article R5 Cooper et al. R5.9
comment reviews reports refereed researchdeposited research interactions information
Genome Biology 2004, 6:R5
Heatmap and in situ hybridization data for genes in the stop clusterFigure 5
Heatmap and in situ hybridization data for genes in the stop cluster. (a) The temporal expression profiles of genes of the cluster are represented by a
heatmap. The highest levels of expression are indicated by the brightest shades of red, while lower expression levels are represented by progressively
brighter shades of green, as indicated by the scale bar. Genes are ordered with the most highly expressed first, and gene names are shown to the right of
the maps. (b-e) A temporal series of in situ studies revealing expression of one gene in this class, Notch, at 0.5 h (b), 3 h (c), 12 h (d) and 24 h (e), showing
how mRNA levels in the leading-edge keratinocytes appear to dip during the period of re-epithelialization and then increase again coincident with the time
at which epidermal fronts contact one another. Arrows highlight region of gene expression. Scale bar = 100 µm.
WT control
PU.1 null
0.5 3 0.5 3
0
12 24 0 12 24
WT control
PU.1 null
0.5 3 0.5 3
0
12 24 0 12 24
Absolute expression
(fluoresence units)
3,000 400 0
Hbb-b1
Krt2-6g
Actc1
Rps27a
Krt1-c29
Tpt1
S100a3
Apoe
EST AA763275
Hba-a1
EST AI851762
Calm4
Krt1-24
Krt2-6a
Krt2-1
S100a3
Scd1
Krt1-2
Ncl
Krt1-3
Krt2-18
Rps2
EST AI019679
Krt2-10
Krt2-19
Keratin associated 3.1
Krt1-24
Insulin-like growth factor
Krt1-1
Fatty acid synthase
Gata3
HGT keratin
Krtap6-1
EST AW107884
Dlx3
Emp2
EST AA791234
EST AI645662
Fructose 1,6 bisphosphate
Archain1
Amd2
Rpo1-1
EST AA867655
Notch1
Itpr5
Hsp105
FAE
Pura
Map3k1
EST D10627
Ptprr
Utx
EST AI83622
Narg1
EST AI849432
Myosin heavy chain 2x
Mt4
Krt2a
EST AI840094
Msx1
EST AW212708
EfnB1
Ty r p1
Pdl3
To p2 b
Nol5
Pcdn7
Rev1l
Klf3
Alcam
Cbx5
EST AA692708
EST AA796831
Ptxna3
Matr3
Pelota
EST AI787137
Bml1
Zfp97
Cldn1
Ctse
Nfyb
EST AI153246
Spr
Cbx3
Ppp1r3c
EST AI785289
Dsc3
EST AW212071
EST AI507524
Prss12
Sh3d19
Rad50
EST AI1852376
T complex1
Cd2ap
Nfia
Cyp51
Zfp292
Sdfr2
EST AA982595
Zt3
EST C80108
Sprr1b
EST AA690483
Atp7a
Mtap6
Amd2
EST AW047616
Mbd4
EST AI606577
EST AA612212
EST C81257
Narg1
Diap3
Wnt5a
EST AI561567
Stag1
Glf
Egfr
Ube3a
Grpei2
Nflc
TIF1
Nr3c1
Dmd
EST C76988
Zinc finger S11-6
MrpS15
Pnn
Runx1
EST AI842544
Bmpr1a
EST AA407332
Zfa
EST AW123402
Vsc2
T cell receptor
Zfp26
Myosin heavy chain 2B
Rps24
EST AI648925
Acvr2
Sox2
Ptgfrn
L1Md-Tf29
Ccne2
Hsp70-2
Cdh6
EST AU45946
Npy6r
EST AI850509
Chgb
Kif1b
Tshr
Hmgcr
Crem
Pvri3
EST AI049391
MEF2A
EST C78948
EST AI851008
EST AI843267
Itga4
EST AA162144
EST AI324972
Msr1
Nrg3
Zfp46
EST AA517023
Lox-1
(a)
(b) (c) (d) (e)
R5.10 Genome Biology 2004, Volume 6, Issue 1, Article R5 Cooper et al. />Genome Biology 2004, 6:R5
ure 7Ab), and they confirm the absence of expression in PU.1
null wounds (Figure 7Ac). The wound-restricted expression
pattern of L-plastin suggests that expression of this gene is
limited to activated leukocytes only.
Also expressed by leukocytes in the early inflammatory clus-
ter are C3, a key component of the classical and alternative
complement pathways, and its receptor, C3R. C3 is expressed
at similar levels in unwounded PU.1 null and wild-type skin,
but whereas expression is rapidly upregulated by 30 minutes
post-wounding and continues until 24 hours in wild-type
wounds, upregulation of C3 is delayed and much weaker in
the PU.1 null wound (Figure 7Ad-f). This delay in C3 expres-
sion suggests that inflammation has a significant role in
raising and maintaining a rapid complement response at the
wound site.
Onzin also appears as a member of the early inflammatory
cluster; it encodes a leukaemia-inhibitory factor-regulated
protein that has previously been identified in a screen for
genes controlling inflammatory dermatitis [36]. Unwounded
wild-type skin expresses Onzin at low levels but it is com-
pletely absent in PU.1 null, unwounded skin and remains so
until 12 hours post-wounding, when it is upregulated, but to a
much lesser extent than in wild-type (Figure 7Ag). In situ
hybridization studies reveal a rather similar expression pat-
tern in both wild-type and PU.1 null wounds (Figure 7Ah,i).
This suggests that Onzin might be expressed in wild-type skin
by resident inflammatory cells and in the PU.1 null wound,
either by inflammatory cells whose development is delayed,
such as T cells, or that there may be an alternative or compen-
satory mechanism of gene regulation in non-inflammatory
cells at the wound site.
Heatmaps for inflammation-dependent genesFigure 6
Heatmaps for inflammation-dependent genes. (a-c) Heatmaps of the temporal profiles of mRNA intensity during the 24 h repair period for inflammation-
dependent genes in wild-type and PU.1 null wounds. (a) The early inflammatory cluster corresponds to the earliest onset of the inflammatory response
with a temporally later induction seen in the late inflammatory cluster (b). (c) The inflammation-maintained cluster also appears to be regulated by the
inflammatory response. Highest levels of expression are indicated by progressively brighter shades of red and lower expression levels represented by
progressively brighter shades of green, as shown by the scale bar. Genes are ordered, for each cluster, with the most highly expressed first, and gene
names are shown to the right of the maps.
Pplc
Gas5
B2m
Hnrph1
Ucp1
Rptn
Elf4a2
Slfn4
EST AI849035
EST AI849035
CDC10
Clk
Acadm
EST AI153421
Pcee
Ctss
EST AA684508
EST AA032310
EST AA543502
Cldea
EST AI848479
Sfrs5
Zfp265
Agtr2
Gbp3
EST C77009
EST AA199023
Sh3bgr1
Ars2
EST AI848330
EST AA816121
EST AA846922
EST AA866655
Ppicap
Elf3
Wsb1
Ifit3
Zac1
EST AI844043
EST AA755234
Cyp2b19
Kitl
Fin16
Ifit1
EST AI553463
Fmr1
Czp-1
EST AI837467
Gtf2h1
EST AI836552
EST AI844131
Ifi202a
EST AI854581
EST AI838094
Mup3
EST AW047223
Gas5
EST AW124151
Cacybp
Np220
Ta nk
EST AI845607
EST AW047237
C4
Nssr
EST AI462516
Uchl5
MHC
EST AI037577
Casp8ap2
Fnbp4
Slfn3
EST AI183202
Ptbp2
Ifit2
Ilgp
Ifi1
EST AW121855
Cops2
EST AW045664
EST AI853642
Nmyc1
EST AI94254
EST AI098965
Adam9
Birc3
EST AW121646
EST AI595322
EST AI132380
EST AI152353
Dbt
Zfp118
EST AW047237
Ledgf
EST AI853444
Nucb2
Ttrap
Clk4
Ccr2
EST AI848222
Tgtp
Sucla2
EST AW124115
EST AW1450597
Helis
EST AI035334
EST AW047134
EST AI836641
EST AA623379
Zfp101
Clk1
Zfp97
Thra
EST AI957030
Rbmx
EST AI648091
Cbp143
Impact
Tpr
EST AA189811
EST AA958903
MTCP1
EST AI131982
EST AI037032
EST AI838094
EST AA717740
Clecaf6
Complement factor H
EST AI853444
EST AA672926
EST AW047929
Mcpt5
Hdc-c
Mup1
Ccl2
Cpa3
Cish3
C1qa
Tnf1p6
Ccl7
C1qc
Cma2
Mup4
Ptx3
Sic6a4
EST AI255271
Mup5
IL-6
0.5 3 0.5 3
(a) Early inflammatory cluster
WT control
PU.1 null
0
12 24 0 12 24
Absolute expression
(fluoresence units)
3,000 400 0
(b) Late inflammatory cluster
0.5 3 0.5 3
WT control
PU.1 null
0
12 24 0 12 24
0.5 3 0.5 3
(c) Inflammation-maintained cluster
WT control
PU.1 null
0
12 24 0 12 24
0.5 3 0.5 3
WT control
PU.1 null
0
12 24 0 12 24
S100a9
Cd14
Ccl9
Onzin
CC3
IL1b
Slfn2
Spp1
Cxcl2
Dab2
EST AA1444469
Lcp1
Prg
MSP1
Sy3L
Gp49a
C3ar1
Mcpt7
Lzp-s
Pglyrp
Clecsf8
Isgl2
Ifi204
Ccr1
EST AA204579
Irg1
CD53
Slfn2
Gbp2
EST AI504305
Mx1
Mrc1
Fpr-rs2
Properdin
Cxcl10
Sqrdl
Ifl203
Casp1
Genome Biology 2004, Volume 6, Issue 1, Article R5 Cooper et al. R5.11
comment reviews reports refereed researchdeposited research interactions information
Genome Biology 2004, 6:R5
As discussed previously, both the genes for MRP8 and its
binding partner MRP14 are upregulated by wound-edge
keratinocytes. Both are also expressed by leukocytes, and in
the case of MRP14 this expression predominates and leads to
cluster separation of the two genes, with MRP14 categorized
as part of the early inflammatory cluster. In the wild-type
wound, it is expressed from 3 hours, with expression peaking
at 12 hours post-wounding, whereas in the PU.1 null, expres-
sion does not begin until 12 hours post-wounding and levels
are much reduced compared with wild-type (Figure 7Aj). In
situ hybridization clearly shows MRP14 to be expressed, in
addition to expression in keratinocytes, in the region of the
wound populated by inflammatory cells in the wild-type only
(Figure 7Ak,l), and indeed, previous experiments suggest that
both neutrophils and macrophages express MRP8 and
MRP14 [22].
It may be that genes expressed by host connective-tissue cells
at the wound site as a consequence of inflammatory signals
are detrimental to healing and lead to some of the imperfect
aspects of repair seen in adult healing such as fibrosis and
scarring. One candidate for such a gene is Osteopontin (Spp1,
minopontin), encoding a glycoprotein that can mediate cell-
matrix interactions via the engagement of a number of adhe-
sive receptors (reviewed in [37]). Previous wound-healing
studies on Spp1 null mice report differences from wild-type in
that repair is characterized by abnormal macrophage debri-
dement and abnormal maturation of collagen bundles [38].
Osteopontin has a clear inflammation-related profile (Figure
7Am) and in situ hybridization reveals an unusual pattern of
expression at the wild-type wound site, with some expression
by a subset of leukocytes but with most positive cells located
in what appears to be the deep dermal or muscle layers of the
wound region (Figure 7An,o).
Both the early and late inflammatory clusters contain chem-
okine and growth factor receptors unique to leukocytes, and
presumably used by these cells to detect various chemotactic
cues that will guide them to the wound site. For example, the
gene for chemokine receptor 1 (CCr1), a receptor for several
chemokines including MIP-1α, CCL5 and Scya7, is expressed
as early as 3 hours post-wounding, with expression levels
peaking by 12 hours. There is no expression at the PU.1 null
wound site (Figure 7Ap). In situ studies show CCr1 to be
expressed in the wild-type wound by leukocytes recruited to
the wound site (Figure 7Aq,r). As well as chemokine recep-
tors, chemokines themselves are found in these clusters.
CXCL10 (IP-10) encodes an α-chemokine that functions as a
potent chemoattractant for macrophages and T cells, and is
upregulated by 12 hours in wild-type wounds but is absent in
PU.1 null wounds (Figure 7As). In situ studies reveal intense
staining by what could be either leukocytes or host fibroblasts
at the wild-type wound site (Figure 7At,u). Either this chem-
okine is an amplifying chemotactic signal expressed by leuko-
cytes to draw in further leukocytes, or its expression is
triggered in fibroblasts, but only if they receive signals from
the first influx of neutrophils.
Temporal and spatial expression profiles of sample genes from the three inflammation-dependent clustersFigure 7 (see following page)
Temporal and spatial expression profiles of sample genes from the three inflammation-dependent clusters. Temporal and spatial profiles of the (A) early
inflammatory, (B) late inflammatory and (C) inflammation-maintained clusters. Line graphs display absolute temporal expression levels (y-axis) at each
time point (x-axis) for both PU.1 null (pink) and wild-type (blue) wounds. y-axis expression levels vary according to individual gene expression levels. In situ
hybridization studies of (A) 12 h, (B) 24 h or (C) 3 h frozen sections illustrate the contrasting expression patterns of each of these classes of genes in wild-
type (WT) versus PU.1 null wounds. (Aa,d,g,j,m,p,s) In the early inflammatory cluster, expression in wild-type wounds peaks at 12 h but is absent or
significantly reduced in PU.1 null wounds. (Ab,c) In situ studies show L-plastin to be expressed by activated leukocytes in the wild-type only (arrow). (Ae,f)
Faint expression of C3 is seen in both genotypes (see arrows). (Ah,i) Onzin expression appears to be in the same cells within the connective tissue in both
genotypes. (Ak,l) Both keratinocytes and leukocytes (arrows) express MRP14 in the wild-type but only keratinocyte expression (arrow) is seen in the
PU.1 null wound. (An,o) Osteopontin displays a possible 'fibrosis' gene spatial profile with expression in deep dermal cell layers (arrow) in the wild-type
only. (Aq,r) CCr1 is expressed only in the wild-type wound, in cells whose clustered location suggests they are one of the leukocyte lineages.(At,u)
Expression of CXC10 is broad and throughout the wound connective tissue of wild-type wounds (arrow) suggesting that expressing cells are wound
fibroblasts. (B) In the late inflammatory cluster, expression in wild-type wounds appears to peak beyond 12 h in wild-type wounds and is absent or reduced
in PU.1 null wounds. (Bb,c) Expression of Cathepsin S is seen in activated leukocytes in the wild-type only (arrow). (Bd) Repetin is expressed by both
genotypes but to a lower level in the PU.1 null. (Be,f) Repetin is only upregulated by keratinocytes but is not restricted only to wild-type wounds (arrows).
(Bh,i) Expression of the potential fibrosis gene Angiotensin II Receptor 1 is seen in deep dermal cell layers of wild-type and, to a significantly reduced level,
PU.1 null wounds (arrows). (C) In the inflammation maintained cluster, the expression profiles suggest that while these genes may be initially expressed in
PU.1 null wounds, persistent expression requires the presence of an inflammatory response as in the wild-type wound situation. (Cb,c) Expression of
Mcpt5 is seen at both wound sites (arrows) in scattered cells throughout the wound connective tissue. (Ce,f) CCL2 appears to be expressed by host
wound cells at both wound sites (see arrows). (Ch,i) CCL7 is expressed in an almost identical temporal and spatial profile to CCL2. Scale bars = 400 µm
(Aa-o, Ba-f, C) and 250 µm (Ap-u and Bh,i).
R5.12 Genome Biology 2004, Volume 6, Issue 1, Article R5 Cooper et al. />Genome Biology 2004, 6:R5
Figure 7 (see legend on previous page)
B(i) B(ii)
WT
KO
WT
KO
WT
KO
WT
KO
WT
KO
WT
KO
WT
KO
WT
KO
WT
KO
WT
KO
WT
KO
WT
KO
WT
KO
WT control PU.1 null
Early inflammatory cluster
WT control PU.1 null
WT control
PU.1 null
WT control
PU.1 null
Late inflammatory cluster Inflammation-maintained cluster
0
hours
0.5
hours
3
hours
12
hours
24
hours
0
hours
0.5
hours
3
hours
12
hours
24
hours
0
hours
0.5
hours
3
hours
12
hours
24
hours
0
hours
0.5
hours
3
hours
12
hours
24
hours
0
hours
0.5
hours
3
hours
12
hours
24
hours
0
hours
0.5
hours
3
hours
12
hours
24
hours
0
hours
0.5
hours
3
hours
12
hours
24
hours
0
hours
0.5
hours
3
hours
12
hours
24
hours
0
hours
0.5
hours
3
hours
12
hours
24
hours
0
hours
0.5
hours
3
hours
12
hours
24
hours
0
hours
0.5
hours
3
hours
12
hours
24
hours
0
hours
0.5
hours
3
hours
12
hours
24
hours
0
hours
0.5
hours
3
hours
12
hours
24
hours
0
100
200
300
400
500
600
0
150
300
450
600
750
900
0
200
400
600
800
1000
1200
1400
0
500
1000
1500
2000
2500
3000
3500
4000
0
150
300
450
600
750
900
0
200
400
600
800
1000
1200
0
400
800
1200
1600
2000
0
200
400
600
800
1000
0
50
100
150
200
250
300
0
50
100
150
200
250
300
0
1000
2000
3000
4000
5000
0
300
600
900
1200
1500
0
100
200
300
400
500
600
L-Plastin (Lcp1)
Complement C3
Onzin
MRP14(S100a9)
Osteopontin (Spp1)
(a) (b) (c)
(d) (e) (f)
(g) (h) (i)
(j) (k) (l)
(m) (n) (o)
(q) (r)
(t)
(p)
(s) (u)
(A)
(B) (C)
(a)
(d)
(g)
(b)
(e)
(h)
(c) (a) (b) (c)
(d) (e) (c)
(g) (h) (i)
(f)
(i)
Cathepsin S (Ctss)
Repetin (Rptn)
Angiotensin II Receptor
(Agtr2)
Mast Cell protease (Mcpt5)
Chemokine CCL2
Chemokine CCL7
Chemokine (C-C)
Receptor 1
Chemokine CXCL10
Genome Biology 2004, Volume 6, Issue 1, Article R5 Cooper et al. R5.13
comment reviews reports refereed researchdeposited research interactions information
Genome Biology 2004, 6:R5
Late inflammatory cluster
Cathepsin S is a typical gene of the late inflammatory cluster,
being highly upregulated at 24 hours post-wounding in the
wild-type, but with no expression in the PU.1 null wound (Fig-
ure 7Ba). Cathepsin S is one of a large family of leukocytic
proteases - this one largely macrophage-specific - that cata-
lyze the remodelling of ECM proteins. In situ hybridization
studies in the wild-type wound show Cathepsin S to be
expressed by macrophages clustered around the wound site,
but also by cells in the dermis at skin sites well away from the
wound (data not shown), suggesting that it is constitutively
expressed by cells of the monocyte lineage, rather than being
part of the macrophage activation profile. No expression of
Cathepsin S is seen in wounded or unwounded skin of the
macrophageless PU.1 null mouse (Figure 7Bb,c).
Repetin is an epidermal differentiation gene and a member of
the fused gene subgroup of the S100 family that encodes mul-
tifunctional epidermal matrix proteins [39]. This temporal
profile at the wound site implicates Repetin as being respon-
sive to inflammatory signals (Figure 7Bd), and yet in situ
hybridization studies reveal it is not expressed by inflamma-
tory cells, but rather by leading-edge keratinocytes in both
wild-type and PU.1 null wounds (Figure 7Be,f). While not
absolutely dependent on inflammatory signals, it appears
that Repetin expression by wound keratinocytes is signifi-
cantly enhanced by inflammatory cues. As several studies
have shown somewhat enhanced rates of re-epithelialization
where one or more components of the inflammatory response
are reduced during healing [6,40,41], it is tempting to specu-
late that genes like Repetin, which are upregulated in the
wound epidermis in response to inflammatory signals, may in
some way retard the re-epithelialization process.
As with the early inflammatory cluster, there are several
genes in the late inflammatory cluster that may directly or
indirectly, via their effects on signaling pathways, be respon-
sible for wound fibrosis. The angiotensin II receptor has pre-
viously been implicated in mediating the fibrotic response in
several tissue injury situations, such as myocardial infarction
[42-45]; its gene is also a member of the late inflammatory
cluster but is expressed at both wild-type and PU.1 null
wounds. Expression is clear in both wild-type and PU.1 null
wounds but significantly higher in the wild-type (Figure 7Bg).
The spatial expression pattern of Angiotensin II receptor is
reminiscent of Osteopontin in the early inflammatory cluster,
with the brightest staining in the deep dermal or muscle layer
of the wild-type wound and only very faint expression seen at
the PU.1 null wound site (Figure 7Bh,i). Presumably, a subset
of genes found in these inflammatory clusters, which are
upregulated by host granulation tissue lineages rather than by
leukocytes, may turn out to be markers, or direct regulators,
of the fibrotic response that is routinely activated in adult
wound granulation tissue. Clearly, therapeutic reduction of
the products of these genes at the wound site might result in
the reduction of wound fibrosis.
Inflammation-maintained cluster
A final cluster of genes appears to be regulated by the inflam-
matory response in that they are generally expressed at early
stages post-repair in both PU.1 null and wild-type mice, but,
whereas their expression subsequently diminishes in the PU.1
null mouse, expression is maintained, or increases, coinci-
dent with the inflammatory response in wild-type wounds.
This temporal expression profile is most clearly visualized
from heatmap data (Figure 6c). Some of the genes in this clus-
ter implicate mast cells in the recruitment of other leukocyte
lineages which then amplify the inflammatory signal. For
example, Mast Cell Protease 5 (Mcpt5) is a serine chymase
stored in the secretory granules of mast cells and acts as a
potent chemoattractant [46]. Mcpt5 is rapidly and transiently
upregulated immediately post-wounding and by 12 hours is
back to near basal levels in the wild-type wound. However, it
is secondarily upregulated at 24 hours. Expression is also
clear at the PU.1 null wound site as an immediate response
but levels remain low and there is no second peak of expres-
sion (Figure 7Ca). In situ hybridization studies show expres-
sion by scattered cells within the wild-type wound, with low
levels of expression detected at the PU.1 null wound site also
(Figure 7Cb,c). These data suggest that Mcpt5 is initially
expressed independently of signals from macrophages and
neutrophils, but that leukocytes are subsequently responsible
for a secondary expression, either directly by expressing
Mcp5 themselves, or indirectly by triggering expression in
another cell type, possibly supplying cues that reinforce
expression by mast cells or prevent their dispersal from the
wound site.
Chemokines are also represented in this inflammation-main-
tained cluster. CCL2 and CCL7 are C-C chemokines with roles
in directing the cellular composition of the inflammatory
response. They are upregulated at 3 hours with expression
tailing off by 24 hours post-wounding in the wild-type. In the
PU.1 null wound, CCL2 and CCL7 are also upregulated at 3
hours but to a lesser degree than in the wild-type, and unlike
in the wild-type, expression is immediately downregulated,
so that by 12 hours post-wounding there is a complete
absence of expression (Figure 7Cd,g). This suggests that
expression is enhanced and maintained in the wild-type by
the presence of macrophages and neutrophils, whereas in the
PU.1 null wound, initial expression is independent of these
leukocytes but without them expression cannot be amplified
and maintained. Our in situ studies suggest that these chem-
okines are expressed by host wound connective-tissue cells
rather than leukocytes at both the wild-type and PU.1 null
wound sites (Figure 7Ce,f, and Ch,i).
Conclusions
Here we report an Affymetrix GeneChip microarray study of
in vivo wound healing using a neonatal mouse wound model
where all phases of the repair process are compressed into a
24-hour period. Cluster analysis of wild-type wounds versus
R5.14 Genome Biology 2004, Volume 6, Issue 1, Article R5 Cooper et al. />Genome Biology 2004, 6:R5
those of PU.1 null mice that are genetically incapable of rais-
ing an inflammatory response allow us to distinguish repair
genes from those involved in, and a consequence of, wound
inflammation.
Several previous studies have modeled wound healing in
vitro by exposure of fibroblasts to serum, as tissue damage to
blood vessels in vivo leads to exposure of connective-tissue
cells to blood serum [3]. Our results show that for the earliest
phases of the repair process, this model does indeed mirror
the in vivo repair response. When we consider only those
genes present on both experimental microarrays, we see that
more than 40% of the genes that are upregulated with an
immediate early profile at the wound site have previously
been shown to have similar temporal profiles after in vitro
activation of fibroblasts. Other in vitro models of repair also
turn out to be rather good predictors of the in vivo response.
For example, exposure of keratinocytes to keratinocyte
growth factor (KGF) in vitro reveals many of the early and
late effector genes that are expressed by keratinocytes at the
wound edge [22].
Other aspects of the repair process, in particular the stopping
phase where migratory and proliferative behaviors cease as
wound edges confront one another, have not yet been suc-
cessfully modeled in vitro, but our study shows that even in
the complexity of in vivo healing, many hints as to the genes
responsible for these episodes can be gleaned by microarray
surveys.
Clearly, the most novel aspect of our study is its capacity to
highlight those gene responses that are specifically associated
with, or a consequence of, the wound-activated inflammatory
response. Those genes expressed at the wound site by virtue
of their being expressed by the invading leukocytes provide
clues as to the migratory machinery of leukocytes in vivo,
informing us, for example, which chemokines might be key
attractive cues by revealing which of the chemokine receptors
are expressed by these cells. Of most therapeutic significance
are those genes expressed as a consequence of inflammation
by host wound fibroblasts, endothelial and muscle cells.
These genes are clearly not absolutely essential for repair, or
PU.1 skin wound not heal. Rather, they will include genes that
contribute to the negative side effects of inflammation at the
wound site including retarded re-epithelialization and fibro-
sis. Dissecting out exactly which genes from the inflamma-
tion-associated clusters might sit in such a category will be a
major goal of our future studies.
How full a survey of the wound healing process is revealed by
our microarray study? The Affymetrix GeneChip we used cov-
ered approximately half of the mouse genome and so we can-
not claim this to be a saturation screen. Moreover, it has not
escaped our attention that several well established wound
players that we know to be represented on the chips are
apparently absent from any of the wound clusters. This is true
for several growth factors, most notably TGFβ1, which we
have previously shown to be differentially expressed in wild-
type versus PU.1 null wounds in RNase protection assays [6],
and the same may be true for several other classes of genes
expressed at low copy number. A similar observation was
made in a recent serial analysis of gene expression (SAGE)
study of Drosophila genes expressed downstream of JNK sig-
naling, which highlighted many such genes but revealed
barely any change in expression of the TGFβ family member
dpp, for which there is excellent genetic evidence for down-
stream activation by JNK signaling [47]. For these reasons it
is clear that our screen underestimates the numbers of genes
associated with each of the repair episodes and is perhaps
somewhat biased towards genes expressed at higher copy
number.
As we have highlighted throughout this paper, revealing a
temporal expression profile that coincides with one of the
physiological episodes of the repair process in no way proves
function for a wound-expressed gene. Although limited to a
small sample of genes, our in situ hybridization studies add
spatial resolution to this dataset, revealing whether a gene is
expressed by the wound epidermis or connective tissue cells,
or by inflammatory cells, but given the vast array of genes
expressed at the wound site, how can one dissect each of their
roles during the repair process? Using recent developments
in Cre driver lines, it will be possible to knockout genes spe-
cifically in appropriate cell lineages within the mouse, so that
the requirement for a particular chemokine receptor in the
recruitment of inflammatory cells can be assessed, or the link
between expression of a candidate 'fibrosis' gene by wound
fibroblasts and subsequent scarring, can be tested. Comple-
mentary studies in which mRNAs for candidate
inflammation/fibrosis genes are simply knocked down by
local delivery to the wound site of antisense oligodeoxynucle-
otides (AS ODNs) [48] will provide a testbed for whether such
approaches may be of therapeutic benefit to improve the
repair process. While mammalian models may remain the
best guide for potential clinical application, it may be faster
and more efficient to turn to simpler, more genetically tracta-
ble organisms to trawl through the vast numbers of candidate
repair and inflammation genes revealed by microarray
studies. Indeed, we and others [49-51] have begun to use Dro-
sophila as a testbed to dissect the genetics of some aspects of
the repair process and to determine by mutant analysis pre-
cisely which genes are required for which repair episodes.
In summary, we present here a portfolio of genes expressed
during the in vivo wound healing process and categorized
according to the physiological episodes that best correlate
with their temporal expression profile. Such a classified
listing provides good clues to the genetic regulation of all the
cell behaviors that contribute to healing, and supplies us with
a pool of genes whose modulation may prove to be therapeu-
tically beneficial to the repair process.
Genome Biology 2004, Volume 6, Issue 1, Article R5 Cooper et al. R5.15
comment reviews reports refereed researchdeposited research interactions information
Genome Biology 2004, 6:R5
Materials and methods
Mice and wounding
Generation and PCR genotyping of PU.1 mice has been
described previously [6]. Tail-tip blood smears were stained
with Giesma (Sigma) for rapid identification of null individu-
als by the absence of neutrophils. Two-day pups received local
anesthetic and full-thickness incisional wounds were made to
a 1 cm × 0.5 cm area of the back skin. For the microarray
study, a criss-cross network of 10 × 8 incisional wounds were
made with a scalpel (Figure 1a) such that all cells within the
rectangle of skin were adjacent to a cut. For in situ hybridiza-
tion studies, three incisional wounds were made along the
long axis of this patch of skin (Figure 1b). Subsequently, PU.1
null mice and control sibs were maintained with daily antibi-
otic injections until sacrifice at appropriate times. For micro-
array experiments, full-thickness back skin was dissected and
immediately transferred, without fixation, into liquid nitro-
gen for subsequent RNA extraction. Wound harvesting and
cryostat tissue sectioning for immunohistochemistry and in
situ hybridization were performed after perfusion fixation
with 4% paraformaldehyde in PBS as described [6] with tis-
sue sections cut at 14 µm.
RNA extraction and preparation for hybridization
Total RNA was isolated from all skin samples using RNAzol
(Biogenesis) according to the manufacturer's instructions
with a secondary clean-up stage using an RNeasy kit (Qia-
gen). RNA was amplified and labeled with biotin as described
previously [52].
Array hybridization and scanning
Double-stranded cDNA was generated from 10 µg total RNA
using Superscript Choice kit (Life Technologies) with a T7-
poly(T) primer. Approximately 1 µg cDNA was used to gener-
ate biotinylated cRNA by in vitro transcription using Bioarray
High Yield RNA Transcript Labelling kit (Enzo Diagnostics
Inc). Fragmented cRNA (10 µg) was hybridized in 100 mM β-
mercaptoethanol, 1 M NaCl, 20 mM EDTA, 0.01% Tween20,
0.1 mg/ml herring sperm DNA, 0.5 mg/ml acetylated BSA, 50
pM control oligonucleotide and eukaryotic hybridization con-
trols, to Affymetrix MGU74A arrays at 45°C for 16 h. Arrays
were washed using Affymetrix protocols in nonstringent
buffer (6x SSPE buffer, 0.01% Tween20, 0.005% antifoam) at
25°C and stringent wash buffer (100 mM MES buffer, 0.1 M
NaCl, 0.01%Tween20) at 50°C and stained with streptavidin
phycoerythrin (10 µg/ml) including an antibody amplifica-
tion step. Arrays were scanned using an Affymetrix confocal
scanner.
Analysis of GeneChip data
The data were analyzed using Microarray Analysis Suite ver-
sion 4.0 (Affymetrix). The data were scaled to a target inten-
sity of 300. Values representing genes not expressed are
unreliable and are given an absent call. All genes were sub-
jected to a filter to identify genes with at least one present call
across the full eight time points and that had on one or more
occasion a greater than twofold change in gene expression
levels between time points or between the wild-type and PU.1
null. The remaining genes were sorted into nine clusters
using Spotfire Array Explorer 3.0 software, of which seven
correlated with clear physiological episodes of repair or
inflammation and we have loosely named those clusters
according to these criteria.
Resin histology and c-fms in situ hybridization
Wound tissues were processed for resin histology with sec-
tions cut at 5 µm and stained with Toluidine Blue as previ-
ously described [6]. To visualize macrophages we carried out
in situ hybridization studies using the macrophage-specific c-
fms probe, using the protocol outlined in [6] and see below.
In situ hybridization
Probe details are available in Additional data file 3. In situ
hybridization on frozen sections was performed as previously
described [53], with probe hybridization carried out in a
humidity chamber at 55°C for 16 h. Expression was visualized
by BCIP/NBT precipitation (Roche Biochemicals) and sec-
tions viewed on a Zeiss Axiphot microscope after mounting in
Citifluor (UKC). This spatial expression information gave us a
good indication of which were the expressing cell lineages in
the wound site, particularly for epidermal keratinocytes
(most superficial cell layer), and leukocytes (scattered indi-
vidual cells in the wound granulation tissue), but without
double staining with lineage-specific antibodies we cannot be
definite, particularly in distinguishing specific leukocyte line-
ages from subpopulations of wound fibroblasts and so forth.
Additional data files
The following additional data are available with the online
version of this paper. Additional data file 1, wound gene bio-
informatics, is an Excel file containing an annotated database
for the 1,001 differentially expressed genes in the nine tempo-
ral gene clusters: activation, early effector, late effector, stop,
early inflammatory, late inflammatory; inflammation-main-
tained, and excluded clusters 1 and 2. For each gene this data-
base provides an Affymetrix ID and GenBank description,
together with absolute fluorescence levels and absence/pres-
ence calls for each time point, and known functional informa-
tion gained from GenBank and Swiss-Prot databases.
Additional data file 2, excluded clusters, contains line graphs
displaying the temporal profile of the median expression
levels at each time point to give a representation of excluded
clusters 1 and 2. Additional data file 3, in situ hybridization
probe source, is a Word document listing the origins of the
various RNA probes used in the in situ hybridization studies.
Additional data file 4, full array expression data, is an Excel
file containing the raw data - absolute fluorescence levels and
absence/presence calls - for all genes on the Affymetrix
MGU74 arrays at all experimental time points.
Additional data file 1Wound gene bioinformaticsAn Excel file containing an annotated database for the 1,001 differ-entially expressed genes in the nine temporal gene clusters: activa-tion, early effector, late effector, stop, early inflammatory, late inflammatory; inflammation-maintained, and excluded clusters 1 and 2. For each gene this database provides an Affymetrix ID and GenBank description, together with absolute fluorescence levels and absence/presence calls for each time point, and known func-tional information gained from GenBank and Swiss-Prot databasesClick here for additional data fileAdditional data file 2Excluded clustersLine graphs displaying the temporal profile of the median expres-sion levels at each time point to give a representation of excluded clusters 1 and 2Click here for additional data fileAdditional data file 3In situ hybridization probe sourceA Word document listing the origins of the various RNA probes used in the in situ hybridization studiesClick here for additional data fileAdditional data file 4Full array expression dataAn Excel file containing the raw data - absolute fluorescence levels and absence/presence calls - for all genes on the Affymetrix MGU74 arrays at all experimental time pointsClick here for additional data file
R5.16 Genome Biology 2004, Volume 6, Issue 1, Article R5 Cooper et al. />Genome Biology 2004, 6:R5
Acknowledgements
L.C. was funded by a Pfizer Prize studentship. We are also grateful to
Marine Mione for excellent tips on successful in situ hybridization with dif-
ficult probes, and to Kate Nobes and Scott McKercher for comments on
the manuscript.
References
1. Martin P: Wound healing - aiming for perfect skin
regeneration. Science 1997, 276:75-81.
2. Werner S, Grose R: Regulation of wound healing by growth
factors and cytokines. Physiol Rev 2003, 83:835-870.
3. Iyer VR, Eisen MB, Ross DT, Schuler G, Moore T, Lee JCF, Trent JM,
Staudt LM, Hudson J Jr, Boguski MS, et al.: The transcriptional pro-
gram in the response of human fibroblasts to serum. Science
1999, 283:83-87.
4. Chang HY, Sneddon JB, Alizadeh AA, Sood R, West RB, Montgomery
K, Chi JT, Rijn Mv M, Botstein D, Brown PO: Gene expression sig-
nature of fibroblast serum response predicts human cancer
progression: similarities between tumors and wounds. PLoS
Biol 2004, 2:E7.
5. McKercher SR, Torbett BE, Anderson KL, Henkel GW, Vestal DJ,
Baribault H, Klemsz M, Feeney AJ, Wu GE, Paige CJ, Maki RA: Tar-
geted disruption of the PU.1 gene results in multiple hemat-
opoietic abnormalities. EMBO J 1996, 15:5647-5658.
6. Martin P, D'Souza D, Martin J, Grose R, Cooper L, Maki R, McKercher
SR: Wound healing in the PU.1 null mouse-tissue repair is not
dependent on inflammatory cells. Curr Biol 2003, 13:1122-1128.
7. Grose R, Harris BS, Cooper L, Topilko P, Martin P: Immediate
early genes krox-24 and krox-20 are rapidly up-regulated
after wounding in the embryonic and adult mouse. Dev Dyn
2002, 223:371-378.
8. Martin-Blanco E, Gampel A, Ring J, Virdee K, Kirov N, Tolkovsky AM,
Martinez-Arias A: puckered encodes a phosphatase that medi-
ates a feedback loop regulating JNK activity during dorsal
closure in Drosophila. Genes Dev 1998, 12:557-570.
9. Kustikova O, Kramerov D, Grigorian M, Berezin V, Bock E, Lukanidin
E, Tulchinsky E: Fra-1 induces morphological transformation
and increases in vitro invasiveness and motility of epithelioid
adenocarcinoma cells. Mol Cell Biol 1998, 18:7095-7105.
10. Zajchowski DA, Bartholdi MF, Gong Y, Webster L, Liu HL, Munishkin
A, Beauheim C, Harvey S, Ethier SP, Johnson PH: Identification of
gene expression profiles that predict the aggressive behavior
of breast cancer cells. Cancer Res 2001, 61:5168-5178.
11. Martin P, Nobes CD: An early molecular component of the
wound healing response in rat embryos - induction of c-Fos
protein in cells at the epidermal wound margin. Mech Dev
1992, 38:209-215.
12. Dieckgraefe BK, Weems DM: Epithelial injury induces egr-1 and
fos expression by a pathway involving protein kinase C and
ERK. Am J Physiol 1999, 276:G322-G330.
13. Eisen MB, Spellman PT, Brown PO, Botstein D: Cluster analysis
and display of genome-wide expression patterns. Proc Natl
Acad Sci USA 1998, 95:14863-14868.
14. Makkinje A, Quinn DA, Chen A, Cadilla CL, Force T, Bonventre JV,
Kyriakis JM: Gene 33/Mig-6, a transcriptionally inducible
adapter protein that binds GTP-Cdc42 and activates SAPK/
JNK. A potential marker transcript for chronic pathologic
conditions, such as diabetic nephropathy. Possible role in the
response to persistent stress. J Biol Chem 2000,
275:17838-17847.
15. Wick M, Burger C, Funk M, Muller R: Identification of a novel
mitogen-inducible gene (mig-6): regulation during G1 pro-
gression and differentiation. Exp Cell Res 1995, 219:527-535.
16. Davis RJ: Signal transduction by the JNK group of MAP
kinases. Cell 2000, 103:239-252.
17. Huang C, Rajfur Z, Borchers C, Schaller MD, Jacobson K: JNK phos-
phorylates paxillin and regulates cell migration. Nature 2003,
424:219-223.
18. Xiao JH, Feng X, Di W, Peng ZH, Li LA, Chambon P, Voorhees JJ:
Identification of heparin-binding EGF-like growth factor as a
target in intercellular regulation of epidermal basal cell
growth by suprabasal retinoic acid receptors. EMBO J 1999,
18:1539-1548.
19. Paladini RD, Takahashi K, Bravo NS, Coulombe PA: Onset of re-epi-
thelialization after skin injury correlates with a reorganiza-
tion of keratin filaments in wound edge keratinocytes:
defining a potential role for keratin 16. J Cell Biol 1996,
132:381-397.
20. Roth J, Burwinkel F, van den Bos C, Goebeler M, Vollmer E, Sorg C:
MRP8 and MRP14, S-100-like proteins associated with mye-
loid differentiation, are translocated to plasma membrane
and intermediate filaments in a calcium-dependent manner.
Blood 1993, 82:1875-1883.
21. Goebeler M, Roth J, van den Bos C, Ader G, Sorg C: Increase of cal-
cium levels in epithelial cells induces translocation of cal-
cium-binding proteins migration inhibitory factor-related
protein 8 (MRP8) and MRP14 to keratin intermediate
filaments. Biochem J 1995, 309:419-424.
22. Thorey IS, Roth J, Regenbogen J, Halle JP, Bittner M, Vogl T, Kaesler
S, Bugnon P, Reitmaier B, Durka S, et al.: The Ca
2+
-binding pro-
teins S100A8 and S100A9 are encoded by novel injury-regu-
lated genes. J Biol Chem 2001, 276:35818-35825.
23. Harrison CA, Raftery MJ, Walsh J, Alewood P, Iismaa SE, Thliveris S,
Geczy CL: Oxidation regulates the inflammatory properties
of the murine S100 protein S100A8. J Biol Chem 1999,
274:8561-8569.
24. Murthy AR, Lehrer RI, Harwig SS, Miyasaki KT: In vitro candida-
static properties of the human neutrophil calprotectin
complex. J Immunol 1993, 151:6291-6301.
25. Davy A, Gale NW, Murray EW, Klinghoffer RA, Soriano P, Feuerstein
C, Robbins SM: Compartmentalized signaling by GPI-
anchored ephrin-A5 requires the Fyn tyrosine kinase to reg-
ulate cellular adhesion. Genes Dev 1999, 13:3125-3135.
26. Holmberg J, Clarke DL, Frisen J: Regulation of repulsion versus
adhesion by different splice forms of an Eph receptor. Nature
2000, 408:203-206.
27. Gale NW, Yancopoulos GD: Ephrins and their receptors: a
repulsive topic? Cell Tissue Res 1997, 290:227-241.
28. Klein R: Excitatory Eph receptors and adhesive ephrin
ligands. Curr Opin Cell Biol 2001, 13:196-203.
29. Dravis C, Yokoyama N, Chumley MJ, Cowan CA, Silvany RE, Shay J,
Baker LA, Henkemeyer M: Bidirectional signaling mediated by
ephrin-B2 and EphB2 controls urorectal development. Dev
Biol 2004, 271:272-290.
30. Talora C, Sgroi DC, Crum CP, Dotto GP: Specific down-modula-
tion of Notch1 signaling in cervical cancer cells is required
for sustained HPV-E6/E7 expression and late steps of malig-
nant transformation. Genes Dev 2002, 16:2252-2263.
31. Fuss B, Josten F, Feix M, Hoch M: Cell movements controlled by
the Notch signalling cascade during foregut development in
Drosophila. Development 2004, 131:1587-1595.
32. Kameyama T, Murakami Y, Suto F, Kawakami A, Takagi S, Hirata T,
Fujisawa H: Identification of a neuronal cell surface molecule,
plexin, in mice. Biochem Biophys Res Commun 1996, 226:524-529.
33. Buxton RS, Wheeler GN, Pidsley SC, Marsden MD, Adams MJ, Jenkins
NA, Gilbert DJ, Copeland NG: Mouse desmocollin (Dsc3) and
desmoglein (Dsg1) genes are closely linked in the proximal
region of chromosome 18. Genomics 1994, 21:510-516.
34. Karakesisoglou I, Yang Y, Fuchs E: An epidermal plakin that inte-
grates actin and microtubule networks at cellular junctions.
J Cell Biol 2000, 149:195-208.
35. Park T, Chen ZP, Leavitt J: Activation of the leukocyte plastin
gene occurs in most human cancer cells. Cancer Res 1994,
54:1775-1781.
36. Betts CJ, Moggs JG, Caddick HT, Cumberbatch M, Orphanides G,
Dearman RJ, Ryan CA, Hulette BC, Frank Gerberick G, Kimber I:
Assessment of glycosylation-dependent cell adhesion mole-
cule 1 as a correlate of allergen-stimulated lymph node
activation. Toxicology 2003, 185:103-117.
37. Denhardt DT, Noda M, O'Regan AW, Pavlin D, Berman JS: Oste-
opontin as a means to cope with environmental insults: reg-
ulation of inflammation, tissue remodeling, and cell survival.
J Clin Invest 2001, 107:1055-1061.
38. Liaw L, Birk DE, Ballas CB, Whitsitt JS, Davidson JM, Hogan BL:
Altered wound healing in mice lacking a functional oste-
opontin gene (spp1). J Clin Invest 1998, 101:1468-1478.
39. Krieg P, Schuppler M, Koesters R, Mincheva A, Lichter P, Marks F:
Repetin (Rptn), a new member of the 'fused gene' subgroup
within the S100 gene family encoding a murine epidermal
differentiation protein. Genomics 1997, 43:339-348.
40. Ashcroft GS, Yang X, Glick AB, Weinstein M, Letterio JL, Mizel DE,
Anzano M, Greenwell-Wild T, Wahl SM, Deng C, Roberts AB: Mice
lacking Smad3 show accelerated wound healing and an
Genome Biology 2004, Volume 6, Issue 1, Article R5 Cooper et al. R5.17
comment reviews reports refereed researchdeposited research interactions information
Genome Biology 2004, 6:R5
impaired local inflammatory response. Nat Cell Biol 1999,
1:260-266.
41. Dovi JV, He LK, DiPietro LA: Accelerated wound closure in neu-
trophil-depleted mice. J Leukoc Biol 2003, 73:448-455.
42. Fabris B, Jackson B, Kohzuki M, Perich R, Johnston CI: Increased
cardiac angiotensin-converting enzyme in rats with chronic
heart failure. Clin Exp Pharmacol Physiol 1990, 17:309-314.
43. Viswanathan M, Saavedra JM: Expression of angiotensin II AT2
receptors in the rat skin during experimental wound healing.
Peptides 1992, 13:783-786.
44. Sun Y, Cleutjens JP, Diaz-Arias AA, Weber KT: Cardiac angi-
otensin converting enzyme and myocardial fibrosis in the
rat. Cardiovasc Res 1994, 28:1423-1432.
45. Sun Y, Weber KT: Angiotensin converting enzyme and myofi-
broblasts during tissue repair in the rat heart. J Mol Cell Cardiol
1996, 28:851-858.
46. McNeil HP, Austen KF, Somerville LL, Gurish MF, Stevens RL: Molec-
ular cloning of the mouse mast cell protease-5 gene. A novel
secretory granule protease expressed early in the differenti-
ation of serosal mast cells. J Biol Chem 1991, 266:20316-20322.
47. Jasper H, Benes V, Schwager C, Sauer S, Clauder-Munster S, Ansorge
W, Bohmann D: The genomic response of the Drosophila
embryo to JNK signaling. Dev Cell 2001, 1:579-586.
48. Qiu C, Coutinho P, Frank S, Franke S, Law LY, Martin P, Green CR,
Becker DL: Targeting connexin43 expression accelerates the
rate of wound repair. Curr Biol 2003, 13:1697-1703.
49. Wood W, Jacinto A, Grose R, Woolner S, Gale J, Wilson C, Martin
P: Wound healing recapitulates morphogenesis in Drosophila
embryos. Nat Cell Biol 2002, 4:907-912.
50. Kiehart DP, Galbraith CG, Edwards KA, Rickoll WL, Montague RA:
Multiple forces contribute to cell sheet morphogenesis for
dorsal closure in Drosophila. J Cell Biol 2000, 149:471-490.
51. Galko MJ, Krasnow MA: Cellular and genetic analysis of wound
healing in Drosophila larvae. PLoS Biol 2004, 2:E239.
52. Wodicka L, Dong H, Mittmann M, Ho MH, Lockhart DJ: Genome-
wide expression monitoring in Saccharomyces cerevisiae. Nat
Biotechnol 1997, 15:1359-1367.
53. Costagli A, Kapsimali M, Wilson SW, Mione M: Conserved and
divergent patterns of Reelin expression in the zebrafish cen-
tral nervous system. J Comp Neurol 2002, 450:73-93.
54. Kacinski BM, Scata KA, Carter D, Yee LD, Sapi E, King BL, Chambers
SK, Jones MA, Pirro MH, Stanley ER, et al.: FMS (CSF-1 receptor)
and CSF-1 transcripts and protein are expressed by human
breast carcinomas in vivo and in vitro. Oncogene 1991, 6:941-952.
55. Sukhatme VP, Cao XM, Chang LC, Tsai-Morris CH, Stamenkovich D,
Ferreira PC, Cohen DR, Edwards SA, Shows TB, Curran T, et al.: A
zinc finger-encoding gene coregulated with c-fos during
growth and differentiation, and after cellular depolarization.
Cell 1988, 53:37-43.