Báo cáo y học: "Conservation anchors in the vertebrate genome" pdf
Bạn đang xem bản rút gọn của tài liệu. Xem và tải ngay bản đầy đủ của tài liệu tại đây (211.74 KB, 7 trang )
Genome Biology 2005, 6:115
comment
reviews
reports
deposited research
interactions
information
refereed research
Opinion
Conservation anchors in the vertebrate genome
Ronny Aloni and Doron Lancet
Address: Department of Molecular Genetics and the Crown Human Genome Center, Weizmann Institute of Science, Rehovot 76100, Israel.
Correspondence: Doron Lancet. E-mail:
Published: 29 June 2005
Genome Biology 2005, 6:115 (doi:10.1186/gb-2005-6-7-115)
The electronic version of this article is the complete one and can be
found online at />© 2005 BioMed Central Ltd
One of the most exciting recent outcomes of comparative
genomics is the realization that when two or more vertebrate
genomes are compared via phylogenetic footprinting,
numerous highly similar non-coding segments emerge [1-4].
Many acronyms have been proposed for such highly con-
served segments (Table 1); here they are referred to as
ANCORs (ancestral non-coding conserved regions). Several
recent papers address this topic in new ways, and refer to the
origin and potential function of such conserved sequences.
Initially, small-scale analyses comparing human and mouse (or
other species) suggested conservation outside coding regions
[5,6]. The identification of such conservation in the vicinity
of specific genes (in proximal flanking regions, untranslated
regions or UTRs, and introns) helped in the exploration of
corresponding regulatory regions. Somewhat broader studies
suggested sequence conservation in large sets of orthologous
pairs [3,7,8]. The advent of full genomic sequences of human
[9] and mouse [10] allowed the first large-scale analyses not
limited to gene-related regions. A comparison between
human chromosome 21 and the syntenic region in mouse [11]
revealed a significant number of noncoding conserved
elements, many of them far from gene-coding regions [12].
Discovering ANCORs
Different reports use not only different nomenclature, but also
different definitions in terms of compared species, ANCOR
length, and percentage identity. We propose to unite these
parameters by using a labeling system that refers to frequency
within the genome (Figure 1), a property that follows from any
filtering process. Thus, for example, segments defined as
being within the top 5% of interspecies conservation [13] will
be denoted here as ANCOR
5%
, while much more highly con-
served 250 base-pair (bp) segments, which have a count of
only 256 within 3 x 10
9
bp of human-rodent sequence [14],
have an incidence of 0.002% and are therefore labeled
ANCOR
0.002%
(see Additional data file 1). Thus, different
reports focus on tips of different magnitude of the ‘conserva-
tion iceberg’.
ANCORs of different conservation and frequency are identi-
fied by diverse in silico methodologies that aim to identify
genomic segments with a high probability of being func-
tional. The first, and most common, is multispecies compari-
son (Figure 2). These may employ a dozen species or more
and look for genomic segments that manifest high similarity
in a subset of the species compared. A larger number of com-
pared genomes improves specificity by filtering out sporadic
similarity [13,15], and enhances sensitivity by detecting ele-
ments absent from some of the compared species [16].
Often, a scheme is employed to provide more weight to
identity between distant species [17].
A second approach relies on distant vertebrate comparison and
is thus an extension of species comparison. An evolutionary
Abstract
Genomic segments that do not code for proteins yet show high conservation among vertebrates
have recently been identified by various computational methodologies. We refer to them as
ANCORs (ancestral non-coding conserved regions). The frequency of individual ANCORs within
the genome, along with their (correlated) inter-species identity scores, helps in assessing the
probability that they function in transcription regulation or RNA coding.
distance of more than 300 million years will result in two
orthologs drifting to a similarity level like that of unrelated
sequences (around 30%), unless selection is at work [3]. Any
human sequence that can reliably be aligned to chicken or
fish sequence, therefore, strongly suggests functional con-
straints. The chicken genome (around 300 million years
divergence from human) was proposed years ago as the best
candidate for identifying human ANCORs [3], but only
recently has the full genome sequencing of this species been
accomplished [18]. The consequent interspecies comparison
shows that about 2.5% of the human genome can be reliably
aligned to a chicken sequence. This portion is predicted as
functional with high specificity, supported by the fact that
more than half of it is among the 5% most conserved
between human and rodents [18]. However, a sensitivity
reduction is reflected by a low representation of known
human regulatory elements (30% are conserved in chicken,
as compared to 60% in mouse). This is in accordance with a
previous multispecies comparison [13] that noted the effec-
tiveness of the chicken genome in comparative analyses but
indicated its limited sensitivity for detecting functional non-
coding elements.
The most distant complete vertebrate genome available for
comparison with the human is that of the pufferfish Fugu
rubripes [19]. Here, the number of detectable non-coding
conserved elements is dramatically reduced [20] but the
likelihood that they are functional improves as well, as a
result of 450 million years of divergence. The Fugu compar-
ative study identified approximately 1,400 ANCOR
0.01%
seg-
ments genome-wide (typical length of 200 bp and average
identity of 84%). These are greatly conserved in chicken and
rodents (average identity of 96-97% with human sequences).
A third protocol is pinpointing the tip of the conservation
iceberg in a comparison between human and a relatively
close species, such as rodent. As an example, a recent study
[14] presents a unique set of predicted functional elements
identified by a stringent similarity criterion. A set of 256
‘ultraconserved’ non-exonic segments of absolute (100%)
identity, each longer than 200 bp, was identified in a
human-mouse-rat comparison. These may be labeled as
ANCOR
0.002%
, constituting the rarest ANCOR thus far
defined. A majority of these are also highly conserved in dog,
chicken and fish (Figure 3). The detailed comparison with
the chicken genome has in fact expanded the set of ultracon-
served elements [18]. Some of the elements are common to
115.2 Genome Biology 2005, Volume 6, Issue 7, Article 115 Aloni and Lancet />Genome Biology 2005, 6:115
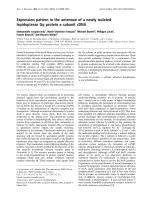
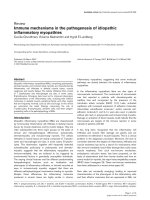
Figure 1
Correspondence between frequency and percentage identity of
interspecies alignments. Frequency is seen to be related to ANCOR
parameters: for a given species and percentage identity, decreased
frequency is observed for longer segments, as expected. Likewise, for a
given length and percentage identity, ANCORs will tend to be rarer in a
species that is more remote evolutionarily. Pairwise alignments of human
versus mouse, chicken and Fugu were analyzed as described [10] to
produce percentage identities for non-overlapping 100 base-pair blocks
with maximum 10% gaps. A frequency value associated with a given
percentage identity is the fraction of segments with equal or higher
percentage identity out of all 100 bp segments of the human genome. This
calculation was based on the fraction of such segments out of the total
number of blocks analyzed for a given species, scaled by the fraction of
the human genome that is aligned to this species: 40%, 2.5% and 1%, for
mouse, chicken and Fugu respectively (details are in Additional data files 2
and 3). Dashed lines represent the same analysis for 50 bp blocks. The
pairwise alignments were downloaded from the UCSC browser [36], and
relate to the following assemblies: human, May 2004 (hg17); mouse, May
2004 (mm5); chicken, February 2004 (galGal2); and Fugu, August 2002
(fr1). In order to produce a comparable number of aligned blocks when
analyzing different species, only human chromosome 17 alignments to
mouse were considered, as compared to whole genome alignments in the
case of chicken and Fugu.
60
10
−5
10
−4
10
−3
10
−2
10
−1
10
0
70 80 90 100
Percentage sequence identity
Frequency
Human versus mouse
Human versus chicken
Human versus Fugu
Table 1
The acronyms used for conserved regions (or elements, tags, or
sequences) in different publications
Acronym Meaning Indicative references
HCR Highly conserved region [3]
CNS Conserved noncoding sequence [4]
CNC Conserved non coding [37]
CNG Conserved non genic [26]
CST Conserved sequence tag [40]
MCS Multispecies conserved sequence [13,17]
UCE Ultra conserved element [14,18]
ECR Evolutionary conserved region [41]
CNE Conserved noncoding element [20]
ANCOR Ancestral non-coding conserved region This article
This article opts for a pronounceable acronym (ANCOR) as a means of
facilitating communication.
both chicken and rodents, yet even those that are fully con-
served only in one of these species are considerably con-
served in the other.
A fourth property used for functional element identification
is hierarchical organization into a family-like structure
within a reference species. A paper utilizing this approach
[21] has demonstrated that while the vast majority of the top
5% of conserved elements between human and rodents are
unique (singletons) in the human genome, a small number
(4%) of these elements form intra-human paralogous clus-
ters containing from two to around 1,000 members. The
implication is that belonging to such a paralogous group
enhances the probability of function. Statistically, these ele-
ments have a frequency of 0.1% in the genome (ANCOR
0.1%
),
but the independent parameter of paralogy adds a new
dimension to the functional pursuit. It should be stressed,
though, that the resulting subset is not necessarily the most
conserved 0.1%.
The ANCORs discovered by the methods described above
can be examined for potential function on the basis of an
array of attributes, such as overlap with expressed sequence
tags (ESTs), inferred transcribed RNA structure, and loca-
tion in the vicinity of exons [13,21]. Some studies explore
conservation-independent parameters, such as the potential
for being nuclear matrix/scaffold attachment regions [22],
which have subsequently been shown to be correlated with
inter-species conservation [23]. Sometimes, a conjunction of
both interspecies comparisons and conservation-indepen-
dent criteria are used, as exemplified by a study that offers
an improved definition of transcription factor binding sites
[24]. Given that, in general, not all functional elements are
highly conserved, and vice versa, direct prediction of func-
tional properties serves as a powerful complement to the
comparative methods described.
The resulting sets of ANCORs obtained by the five methods
are partially overlapping, as may be expected (Figure 3).
Moreover, in some cases overlap may be limited to a shared
subset of ANCORs identified by the different methods. Thus,
assessing the exact relationships among the sets requires
careful scrutiny.
comment
reviews
reports
deposited research
interactions
information
refereed research
Genome Biology 2005, Volume 6, Issue 7, Article 115 Aloni and Lancet 115.3
Genome Biology 2005, 6:115
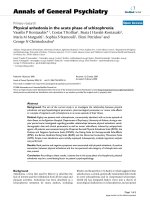
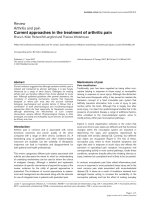
Figure 2
Interspecies comparison produced by the VISTA server [37,38],
highlighting conserved elements. The conservation profiles were
obtained with the human sequence as reference (chromosome 6,
human genome build 34, megabase coordinates as indicated on the
horizontal axis, in an intergenic region). The percentage identity was
computed in sliding 100 bp windows by comparison with five different
species. Frog is Xenopus tropicalis, and fish is Fugu rubripes. Arrows
indicate: (a) an element conserved in mouse, frog and chicken, but not
in rat; (b) ultraconserved element uc.196 [14] (221 bp, 100%
conserved in mouse and rat); (c) an element conserved in all five
species down to fish. The somewhat arbitrary conservation
relationships (for example, a segment highly conserved between human
and frog but not found in rat) is indicative of a stochastic process, in
line with notions embodied in Figures 4 and 5.
100%
85%
100%
85%
100%
85%
100%
85%
100%
85%
97.9M
Fish
Frog
Chicken
Rat
Mouse
98M 98.1M 98.2M 98.3M 98.4M
(a) (b) (c)
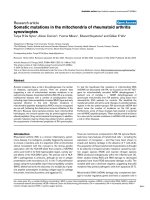
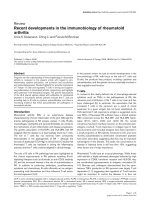
Figure 3
Overlap between different ANCOR sets. The quantitative relations are
illustrative. The highlighted square zooms in on rare ANCORs, which are
predicted to be functional. Ro, top 5% of conserved elements in a human-
rodent comparison; Ch, the approximately 2.5% of the human genome
that can be reliably aligned with chicken [18]; Func, the 5% portion of the
human genome estimated to be functional on the basis of rodent
comparisons [10,15]. Paralogs, noncoding sequences which belong to
paralogous families within human genome [21]; Fi, elements conserved in
the pufferfish Fugu rubripes genome [20]; RoU, ultraconserved elements,
defined as > 200bp of 100% identity between human, mouse and rat [14];
ChU, the same definition for ultraconserved elements applied to human-
chicken comparison [18].
Ch
Ro
Func
Paralogs
Fi
ChU
RoU
Where are ANCORs located?
ANCORs are dispersed throughout the genome. They are
located in ‘gene territories’: transcribed 3Ј UTRs, 5Ј UTRs or
introns, as well as gene-proximal upstream and downstream
non-transcribed regions. In the latter case they are more
likely to serve as cis-regulatory elements. But they are also
found outside such territories, in regions remote from any
genes. In general, interspecies conservation decreases with
increasing distance from coding exons [8,25], implying that
gene territories should be enriched in ANCORs. Indeed, a sig-
nificant ANCOR
5%
enrichment has been reported for introns
as compared to intergenic regions in the human CFTR region
(encoding the cystic fibrosis transmembrane regulator) [13].
In contrast, whole-genome perspectives have identified a
negative correlation between the number of ANCORs and the
number of coding sequences within genomic intervals
[18,26,27]. This is also corroborated by the observation that
one third of the rare ANCOR
0.002%
elements are located in
‘gene deserts’, more than 100 kb away from any gene.
Another feature of nonrandom genomic distribution is a ten-
dency of ANCORs to appear in clusters [18,20]. In parallel,
ANCORs are reported to be enriched in gene deserts whose
flanking genes are associated with transcription regulation,
DNA binding, or development [14,18,20,28]. The latter
result points to a likelihood that ANCORs serve as distal cis-
regulatory elements, potentially involved specifically in ver-
tebrate development [14,20].
ANCOR functional validation
Because of the conjectural aspects of ANCOR functionality,
experimental evidence is extremely important for their vali-
dation. It is of course inherently impossible to prove that an
ANCOR is non-functional, given the vast spectrum of poten-
tial ensuing phenotypes. One of the most obvious proposed
ANCOR functions is transcription regulation. Accordingly,
one of the earliest relevant studies has demonstrated that
approximately the top 20% of mouse-human conserved seg-
ments (ANCOR
20%
) contain a statistically significant twofold
excess of experimentally verified upstream transcription
factor binding sites [29]. Similarly, the set of ANCOR
5%
in
the CFTR region overlaps with 63% of the functionally
validated regulatory elements [13].
In an experimental comparative study, multispecies mam-
malian sequence conservation was identified by DNA
hybridization to human arrayed sequences in a 365 kb interval
surrounding the single-minded (SIM2) gene [16]. Seven of
eight ANCOR
10%
segments, conserved in between two and six
species, showed nuclear-protein-binding activity, compared
with none of six non-conserved segments. In another study of
two mouse segments of gene deserts around 1 Mb in length,
functional validation was carried out by genomic deletions
[30]. Intriguingly, the manipulated animals were found to
have no detectable phenotype, despite the fact that the
deleted regions had a typical distribution of low-frequency
ANCORs (Figure 4), and that they contained 15 ANCOR
0.3%
elements (typical length 400 bp and human-mouse identity
score > 90%). These elements were assayed for an enhancer
activity by a transgenic embryo assay, but only one was
active. This could indicate that deleting segments with
ANCORs of yet lower frequency may be necessary to observe
a profound phenotype.
A corroboration for this notion is found in numerous func-
tional assessments of ANCORs revealed by human-fish
comparison (see [28,31] for reviews). In one example [32],
two gene deserts, flanking the human dachshund homolog 1
(DACH1) gene, were subjected to amphibian and fish com-
parisons. This appears to be a rather atypical region in terms
of ANCOR content (Figure 4), having a strongly elevated
incidence of highly conserved segments. Of nine conserved
115.4 Genome Biology 2005, Volume 6, Issue 7, Article 115 Aloni and Lancet />Genome Biology 2005, 6:115
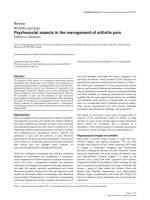
Figure 4
Similarity distribution within three different genomic regions. Percentage
identity was calculated as described in Figure 1 for non-overlapping 50 bp
blocks of human-mouse alignments. The frequency of blocks with a given
identity level was calculated out of all blocks analyzed in a specified
genomic region. The genomic regions are: the complete human
chromosome 21; the human orthologous regions of two mouse gene
deserts, MMU3 and MMU19 [30]; full upstream and downstream
intergenic regions flanking DACH1 gene [32]. Blocks of 100% identity
consist of around 1.5% of the DACH1-flanking DNA, whereas their
fraction is only 0.1% within the two other regions. For comparison, the
distribution of identity values for coding segments in human chromosome
17 (selected to obtain adequate statistics) is shown, with an intermediate
level fraction of 0.8% of the blocks of 100% identity. The latter
distribution is seen to be similar to the computed distribution for
functional regions depicted in Figure 5. The coordinates of coding exons
were extracted using UCSC Table Browser [36] from the primary table
‘refGene’. Genomic coordinates of the selected regions and statistical
properties of the distributions are given in Additional files 4 and 5.
40 60 80 100
Percentage identity
Frequency
0.01
0.03
0.05
0.07
0.09
0.11
Human
chromosome 21
Human
chromosome
17 coding
Human orthologs
of MMU3 and MMU19
Intergenic
regions
flanking
DACH1
elements identified, seven displayed in vivo enhancer activity
in transgenic mice. Similarly, when ANCOR
0.01%
segments
were identified by human-Fugu whole-genome comparison, a
functionality rate of 23 out of 25 ANCORs (> 90%) was
observed by an enhancer assay, based on a transient co-injec-
tion of each element with a promoter-reporter gene construct
[20]. The general conclusion is that only the top few hundred
ANCORs (at incidence levels of < 0.01%) have a high proba-
bility of being functional. Alternatively, it is also possible that
the function of this fraction of ANCORs is more obvious and
can be tested using conventional experimental protocols, but
the function of the remainder is more subtle.
ANCOR evolution
Two remote mammalian genomes, such as human and
mouse, typically show a bell-shaped distribution of segmental
DNA sequence identity (Figure 4), and this is true for diverse
genomic element types, such as introns, exons and UTRs,
each being characterized by different average percentage
identity [10]. Whereas the mean identity is 67% for ancestral
repeats, believed to evolve neutrally, the mean identity can be
as high as 85% for functional coding segments (exons) that
evolve under purifying selection (Figure 5a). A clear challenge
for ANCOR elucidation is attempting to infer a sequence-
identity distribution for functional segments of non-coding
DNA. This is not a straightforward task, because of the
current paucity of prediction and annotation tools.
We propose a parsimony-based conjecture, namely that
functional non-coding segments (Figure 5a) manifest a
sequence-similarity distribution similar to that of coding
exons (Figure 4). This is based on the observation that the
number of ultraconserved segments is comparable in coding
and non-coding regions [14], and on the notion that selective
constraints are not expected to be vastly different for the two
types of functional segments. In both, different elements are
expected to be under varied stringencies of selection, yield-
ing a normal-like distribution. It may be computed that non-
functional blocks of 100 bp with total identity (100%) are too
rare to appear even once in the entire mammalian genome
when neutral DNA is concerned, while a few dozen such
elements are expected within the selected fraction (Figure
5b). Importantly, this very crude model predicts an appreciable
comment
reviews
reports
deposited research
interactions
information
refereed research
Genome Biology 2005, Volume 6, Issue 7, Article 115 Aloni and Lancet 115.5
Genome Biology 2005, 6:115
Figure 5
Inferred human-mouse similarity distributions for aligned genomic blocks. (a) Standard normal distributions were calculated as an estimation of human-
mouse similarity in the neutral genomic fraction (solid), and in the selected genomic fraction (dashed), assuming a mean percentage identity of 66.7% and
84.7% respectively. The graphs represent analyses for different block sizes: 50 bp, 100 bp, and 200 bp. Calculations are based on the normal approximation
to binomial distribution with n = block size and p= mean percentage identity. This provides the probability distribution of the number of matches in a
pairwise alignment of length n. Each alignment position is considered an independent Bernoulli trial, where p is the probability for an identical nucleotide in
the two aligned sequences. All frequencies are normalized to a sum of 1, with the selected population being 1/8 of the total. Compare to [10,39] for
whole-genome analysis of actual data, and to Figure 4 for specified genomic regions. Note that the standard deviation of real data is larger than that
computed for the binomial model with independent sequence positions. In addition, while the model assumes a fixed probability for nucleotide identity (p),
the real substitution rate varies locally across the genome. (b) Logarithmic transform of the distributions presented in (a). The frequency of 100% identical
100 bp blocks is 10
-12
for the neutral portion, and approximately 2 x 10
-6
for the selected portion. Given that around 1.2 x 10
9
bases are aligned (1.2 x 10
7
blocks), about 20 blocks are expected to be of 100% identity among the selected DNA segments, and much fewer than one (10
-5
) of the neutral ones.
These values are a lower bound for the actual number of such blocks in the genome, because they relate to non-overlapping windows.
60 70 80
Percentage identity
90 100
60 70 80
Percentage identity
90 100
Frequency
Frequency
0.02
10
−40
10
−30
10
−20
10
−10
10
0
0.04
0.06
0.08
0.1
200 bp
100 bp
100 bp100 bp
50 bp50 bp
50 bp
200 bp
100 bp
50 bp
200 bp200 bp
(a)
(b)
number of instances of perfect identity, without assuming a
distinguished population of hyper-selected or hypo-mutable
DNA elements. Nevertheless, in reality there is an excess of
perfect identity regions [14] (Figure 4), suggesting a further
contribution of selective pressure.
According to this model, and as corroborated by assertions
in the literature [10], mere knowledge of interspecies
sequence identity is a rather weak predictor of functional
importance. For example, according to the computed curves
shown in Figure 5b, a sequence identity level of around 80%
is associated with an equal probability of being functional
or nonfunctional. On the other hand, it is expected that
sequence identity criteria will continue to be a key method
for identifying functional noncoding DNA. Thus, focusing
on ultraconserved segments - ANCORs with identity scores
near 100% and/or frequency of < 0.01% - will be instru-
mental, their status more clearly implying an association
with function.
The definition of a gene is far from straightforward [33]. It is
widely accepted that genomic segments that are transcribed
into functional RNAs but do not code for proteins may be
regarded as genes. This includes genes for, among others,
microRNAs that fulfill central roles in gene regulatory net-
works [34,35]. Many ANCORs may belong to existing cate-
gories of RNA-coding genes, or may be related to
gene-proximal control elements that can safely be defined as
parts of existing protein-coding genes. But the broader con-
servation picture that emerges, as described in this review,
suggests the existence of highly conserved segments far away
from other genes. Some of these have already been submit-
ted to the EMBL database with gene-like annotations [20].
Future scrutiny will help decide whether these genomic
objects may be legitimately regarded as new classes of bona
fide genes.
Additional data files
The following additional data files are available with the
online version of this article: Additional data file 1 listing
reported sets of noncoding conserved elements, and calcula-
tion of their frequency values; Additional data file 2 detailing
the statistical properties of similarity distributions used to
produce Figure 1; Additional data file 3 providing the raw
data of percentage identity versus frequency as presented in
Figure 1; Additional data file 4 giving the genomic coordi-
nates of the DNA segments analyzed in Figure 4; and Addi-
tional data file 5 detailing the statistical properties of the
similarity distributions presented in Figure 4.
Acknowledgements
D.L. holds the Ralph and Lois Chair in Human Genetics. This research was
supported by the Crown Human Genome Center, and by an Israel Min-
istry of Science and Technology grant to the National Knowledge Center
in Genomics.
References
1. Tagle D, Koop B, Goodman M, Slightom J, Hess D, Jones R: Embry-
onic epsilon and gamma globin genes of a prosimian
primate (Galago crassicaudatus). Nucleotide and amino acid
sequences, developmental regulation and phylogenetic foot-
prints. J Mol Biol 1988, 203:439-455.
2. Gumucio DL, Heilstedt-Williamson H, Gray TA, Tarle SA, Shelton
DA, Tagle DA, Slightom JL, Goodman M, Collins FS: Phylogenetic
footprinting reveals a nuclear protein which binds to
silencer sequences in the human gamma and epsilon globin
genes. Mol Cell Biol 1992, 12:4919-4929.
3. Duret L, Bucher P: Searching for regulatory elements in human
noncoding sequences. Curr Opin Struct Biol 1997, 7:399-406.
4. Dubchak I, Brudno M, Loots GG, Pachter L, Mayor C, Rubin EM,
Frazer KA: Active conservation of noncoding sequences
revealed by three-way species comparisons. Genome Res 2000,
10:1304-1306.
5. Hardison R, Miller W: Use of long sequence alignments to
study the evolution and regulation of mammalian globin
gene clusters. Mol Biol Evol 1993, 10:73-102.
6. Koop BF, Hood L: Striking sequence similarity over almost
100 kilobases of human and mouse T-cell receptor DNA.
Nat Genet 1994, 7:48-53.
7. Jareborg N, Birney E, Durbin R: Comparative analysis of non-
coding regions of 77 orthologous mouse and human gene
pairs. Genome Res 1999, 9:815-824.
8. Shabalina SA, Ogurtsov AY, Kondrashov VA, Kondrashov AS: Selec-
tive constraint in intergenic regions of human and mouse
genomes. Trends Genet 2001, 17:373-376.
9. International Human Genome Sequencing Consortium: Initial
sequencing and analysis of the human genome. Nature 2001,
409:860-921.
10. Mouse Genome Sequencing Consortium: Initial sequencing and
comparative analysis of the mouse genome. Nature 2002,
420:520-562.
11. Dermitzakis ET, Reymond A, Lyle R, Scamuffa N, Ucla C, Deutsch S,
Stevenson BJ, Flegel V, Bucher P, Jongeneel CV, et al.: Numerous
potentially functional but non-genic conserved sequences on
human chromosome 21. Nature 2002, 420:578-582.
12. Dermitzakis ET, Kirkness E, Schwarz S, Birney E, Reymond A,
Antonarakis SE: Comparison of human chromosome 21 con-
served nongenic sequences (CNGs) with the mouse and dog
genomes shows that their selective constraint is indepen-
dent of their genic environment. Genome Res 2004, 14:852-859.
13. Thomas JW, Touchman JW, Blakesley RW, Bouffard GG, Beck-
strom-Sternberg SM, Margulies EH, Blanchette M, Siepel AC,
Thomas PJ, McDowell JC, et al.: Comparative analyses of multi-
species sequences from targeted genomic regions. Nature
2003, 424:788-793.
14. Bejerano G, Pheasant M, Makunin I, Stephen S, Kent WJ, Mattick JS,
Haussler D: Ultraconserved elements in the human genome.
Science 2004, 304:1321-1325.
15. Rat Genome Sequencing Project Consortium: Genome sequence
of the Brown Norway rat yields insights into mammalian
evolution. Nature 2004, 428:493-521.
16. Frazer KA, Tao H, Osoegawa K, de Jong PJ, Chen X, Doherty MF,
Cox DR: Noncoding sequences conserved in a limited number
of mammals in the SIM2 interval are frequently functional.
Genome Res 2004, 14:367-372.
17. Margulies EH, Blanchette M, Haussler D, Green ED: Identification
and characterization of multi-species conserved sequences.
Genome Res 2003, 13:2507-2518.
18. International Chicken Genome Sequencing Consortium: Sequence
and comparative analysis of the chicken genome provide
unique perspectives on vertebrate evolution. Nature 2004,
432:695-716.
19. Aparicio S, Chapman J, Stupka E, Putnam N, Chia J-M, Dehal P,
Christoffels A, Rash S, Hoon S, Smit A, et al.: Whole-genome
shotgun assembly and analysis of the genome of Fugu
rubripes. Science 2002, 297:1301-1310.
20. Woolfe A, Goodson M, Goode DK, Snell P, McEwen GK, Vavouri T,
Smith SF, North P, Callaway H, Kelly K, et al.: Highly conserved
non-coding sequences are associated with vertebrate devel-
opment. PLoS Biol 2005, 3:e7.
21. Bejerano G, Haussler D, Blanchette M: Into the heart of dark-
ness: large-scale clustering of human non-coding DNA. Bioin-
formatics 2004, 20(Suppl 1):i40-i48.
22. Liebich I, Bode J, Frisch M, Wingender E: S/MARt DB: a database
on scaffold/matrix attached regions. Nucleic Acids Res 2002,
30:372-374.
115.6 Genome Biology 2005, Volume 6, Issue 7, Article 115 Aloni and Lancet />Genome Biology 2005, 6:115
23. Glazko GV, Koonin EV, Rogozin IB, Shabalina SA: A significant
fraction of conserved noncoding DNA in human and mouse
consists of predicted matrix attachment regions. Trends Genet
2003, 19:119-124.
24. Lenhard B, Sandelin A, Mendoza L, Engstrom P, Jareborg N, Wasser-
man W: Identification of conserved regulatory elements by
comparative genome analysis. J Biol 2003, 2:13.
25. Keightley PD, Gaffney DJ: Functional constraints and frequency
of deleterious mutations in noncoding DNA of rodents. Proc
Natl Acad Sci USA 2003, 100:13402-13406.
26. Dermitzakis ET, Reymond A, Scamuffa N, Ucla C, Kirkness E,
Rossier C, Antonarakis SE: Evolutionary discrimination of
mammalian conserved non-genic sequences (CNGs). Science
2003, 302:1033-1035.
27. Gaffney DJ, Keightley PD: Unexpected conserved non-coding
DNA blocks in mammals. Trends Genet 2004, 20:332-337.
28. Boffelli D, Nobrega MA, Rubin EM: Comparative genomics at
the vertebrate extremes. Nat Rev Genet 2004, 5:456-465.
29. Levy S, Hannenhalli S, Workman C: Enrichment of regulatory
signals in conserved non-coding genomic sequence. Bioinfor-
matics 2001, 17:871-877.
30. Nobrega MA, Zhu Y, Plajzer-Frick I, Afzal V, Rubin EM: Megabase
deletions of gene deserts result in viable mice. Nature 2004,
431:988-993.
31. Elgar G: Identification and analysis of cis-regulatory elements
in development using comparative genomics with the
pufferfish, Fugu rubripes. Semin Cell Dev Biol 2004, 15:715-719.
32. Nobrega MA, Ovcharenko I, Afzal V, Rubin EM: Scanning human
gene deserts for long-range enhancers. Science 2003, 302:413.
33. Mattick J: Challenging the dogma: the hidden layer of non-
protein-coding RNAs in complex organisms. BioEssays 2003,
25:930-939.
34. Bartel DP: MicroRNAs: genomics, biogenesis, mechanism,
and function. Cell 2004, 116:281-297.
35. He L, Hannon GJ: MicroRNAs: small RNAs with a big role in
gene regulation. Nat Rev Genet 2004, 5:631.
36. UCSC Genome Browser [ />37. Couronne O, Poliakov A, Bray N, Ishkhanov T, Ryaboy D, Rubin E,
Pachter L, Dubchak I: Strategies and tools for whole-genome
alignments. Genome Res 2003, 13:73-80.
38. VISTA Genome Browser [ />39. Chiaromonte F, Weber RJ, Roskin KM, Diekhans M, Kent WJ, Haus-
sler D: The share of human genomic DNA under selection
estimated from human-mouse genomic alignments. Cold
Spring Harb Symp Quant Bio 2003, 68:245-254.
40. Mignone F, Grillo G, Liuni S, Pesole G: Computational identifica-
tion of protein coding potential of conserved sequence tags
through cross-species evolutionary analysis. Nucleic Acids Res
2003, 31:4639-4645.
41. Ovcharenko I, Nobrega MA, Loots GG, Stubbs L: ECR Browser: a
tool for visualizing and accessing data from comparisons of
multiple vertebrate genomes. Nucleic Acids Res 2004, 32(Suppl
2):W280-W286.
comment
reviews
reports
deposited research
interactions
information
refereed research
Genome Biology 2005, Volume 6, Issue 7, Article 115 Aloni and Lancet 115.7
Genome Biology 2005, 6:115