Báo cáo y học: "Patterns of intron sequence evolution in Drosophila are dependent upon length and GC conten" ppt
Bạn đang xem bản rút gọn của tài liệu. Xem và tải ngay bản đầy đủ của tài liệu tại đây (259.56 KB, 8 trang )
Genome Biology 2005, 6:R67
comment reviews reports deposited research refereed research interactions information
Open Access
2005Haddrillet al.Volume 6, Issue 8, Article R67
Research
Patterns of intron sequence evolution in Drosophila are dependent
upon length and GC content
Penelope R Haddrill
*
, Brian Charlesworth
*
, Daniel L Halligan
*
and
Peter Andolfatto
†
Addresses:
*
Institute of Evolutionary Biology, School of Biological Sciences, University of Edinburgh, Edinburgh EH9 3JT, UK.
†
Section of
Ecology, Behavior and Evolution, Division of Biological Sciences, University of California San Diego, La Jolla, CA 92093, USA.
Correspondence: Penelope R Haddrill. E-mail:
© 2005 Haddrill et al.; licensee BioMed Central Ltd.
This is an Open Access article distributed under the terms of the Creative Commons Attribution License (
which permits unrestricted use, distribution, and reproduction in any medium, provided the original work is properly cited.
Patterns of intron sequence evolution in Drosophila<p>An analysis of inter-specific divergence in 225 intron fragments in <it>Drosophila melanogaster </it>and <it>D. simulans </it>reveals a strongly negative correlation between intron length and divergence and intron divergence and GC content. This suggests that most intronic DNA is evolving under considerable constraint.</p>
Abstract
Background: Introns comprise a large fraction of eukaryotic genomes, yet little is known about
their functional significance. Regulatory elements have been mapped to some introns, though these
are believed to account for only a small fraction of genome wide intronic DNA. No consistent
patterns have emerged from studies that have investigated general levels of evolutionary constraint
in introns.
Results: We examine the relationship between intron length and levels of evolutionary constraint
by analyzing inter-specific divergence at 225 intron fragments in Drosophila melanogaster and
Drosophila simulans, sampled from a broad distribution of intron lengths. We document a strongly
negative correlation between intron length and divergence. Interestingly, we also find that
divergence in introns is negatively correlated with GC content. This relationship does not account
for the correlation between intron length and divergence, however, and may simply reflect local
variation in mutational rates or biases.
Conclusion: Short introns make up only a small fraction of total intronic DNA in the genome.
Our finding that long introns evolve more slowly than average implies that, while the majority of
introns in the Drosophila genome may experience little or no selective constraint, most intronic
DNA in the genome is likely to be evolving under considerable constraint. Our results suggest that
functional elements may be ubiquitous within longer introns and that these introns may have a
more general role in regulating gene expression than previously appreciated. Our finding that GC
content and divergence are negatively correlated in introns has important implications for the
interpretation of the correlation between divergence and levels of codon bias observed in
Drosophila.
Background
Non-coding DNA makes up a large proportion of the genomes
of most eukaryotes, yet little is known about its functional sig-
nificance and the forces affecting its evolution. The identifica-
tion of functional regions of the genome has tended to
concentrate on coding DNA, yet the recent shift in focus
Published: 27 July 2005
Genome Biology 2005, 6:R67 (doi:10.1186/gb-2005-6-8-r67)
Received: 4 March 2005
Revised: 25 April 2005
Accepted: 29 June 2005
The electronic version of this article is the complete one and can be
found online at />R67.2 Genome Biology 2005, Volume 6, Issue 8, Article R67 Haddrill et al. />Genome Biology 2005, 6:R67
towards non-coding DNA has revealed that introns and inter-
genic sequences may be subject to considerable levels of
selective constraint, implying that they contain functional
elements [1-6]. No consistent patterns have emerged from the
relatively few studies that have thus far investigated levels of
constraint on intron DNA sequences; some studies conclude
that such DNA is evolving under little or no selective con-
straint, while others find considerable levels of constraint (for
examples, see [3,7-10]). Moreover, the mode of evolution for
such types of sequence is still unclear.
Several recent studies have attempted to estimate the propor-
tion of sites within introns that is subject to selective con-
straint. For example, Jareborg et al. [11] estimate that 23% of
intronic sites in mouse-rat genome comparisons are evolu-
tionarily conserved. Similarly, Shabalina and Kondrashov
[12] estimate (conservatively) that 17% of nucleotide sites
within introns are selectively constrained between
Caenorhabditis elegans and Caenorhabditis briggsae; this
was at least in part due to their function in splicing, because
constraint appeared to be higher at the edges of introns. Like-
wise, Bergman and Kreitman [3] estimate that 22-26% of
non-coding sequences (intergenic and intronic) are highly
constrained between Drosophila melanogaster and Dro-
sophila virilis. In contrast to these studies, Halligan et al. [9]
found that most intronic sites (excluding those necessary for
correct splicing) in Drosophila were evolving approximately
17% faster than fourfold synonymous sites. They concluded
that these sites were effectively evolving free from selective
constraint. The discrepancies among previous studies suggest
that no clear conclusions can yet be drawn regarding the lev-
els of selective constraint in non-coding intronic DNA.
Intron size is one possible factor that may explain these con-
flicting results. Comeron and Kreitman [13] and others have
noted an asymmetrical distribution of intron lengths in D.
melanogaster; a large number of short introns clustered
around a minimal intron length and a broader distribution of
longer introns (median intron size of 86 base-pairs (bp),
mean intron size of 1411 bp; [14]). Based on multi-species
data for 15 introns (13 short and 2 long), Parsch [15] showed
that there were significantly fewer substitutions per site in the
two longer introns. He suggested that this pattern may be due
to the presence of a greater number of regulatory elements
that are subject to purifying selection in longer introns.
If regulatory elements occur frequently in introns, and these
are of some minimal size, it follows that size may be an impor-
tant factor in intron evolution. In agreement with this predic-
tion, Marais et al. [16] noted a marginally significant (P =
0.03) negative correlation between intron divergence and size
for first introns (but not other introns) in the dataset of Hal-
ligan et al. [9]. Marais et al. [16] suggested that this correla-
tion between divergence and length may be expected for first
introns because they are on average two times longer than
other introns [17] and also tend to contain more known regu-
latory elements, at least in mammals [8]. Because the dataset
used consisted mostly of short introns, it is unclear whether
the pattern they observed is specific to first introns (due to an
association between first introns and regulatory elements)
and whether the relationship between divergence and size is
primarily driven by the fact that first introns are longer. Here
we revisit the relationship between intron length and evolu-
tionary constraint (as measured by levels of divergence
between D. melanogaster and D. simulans) by combining
published data for 225 intron fragments sampled from a
much broader distribution of intron lengths and positions
within genes.
Results and discussion
Levels of divergence are correlated with intron length
We investigated levels of divergence at a total of 225 introns
(a mixture of complete short introns and several hundred
base-pair fragments of longer introns) scattered across the
Drosophila genome. The relationship between intron length
and nucleotide divergence for all complete introns and intron
fragments surveyed is shown in Figure 1. A strongly negative
correlation between intron length and divergence is apparent
(Spearman correlation coefficient R
s
= -0.388, P < 10
-4
). We
also divided the data into two size classes based on the
median intron size of 86 bp in Drosophila [14]; small (≤86
bp) introns and large (>86 bp) introns. The large intron class
showed significantly lower divergences than the small intron
class (Wilcoxon two-sample test statistic W = 17079.5, P < 10
-
4
). The correlation between intron length and divergence is
somewhat weaker, but still significant within the longer
intron class (R
s
= -0.278, P = 0.006).
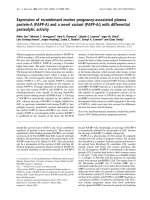
The relationship between intron length and the level of divergence between D. melanogaster and D. simulans for the combined dataset of 225 intronsFigure 1
The relationship between intron length and the level of divergence
between D. melanogaster and D. simulans for the combined dataset of 225
introns. A significantly negative correlation is found for all introns
(Spearman correlation coefficient R
s
= -0.388, P < 10
-4
), first introns (R
s
= -
0.451, P < 10
-4
) and non-first introns (R
s
= -0.304, P < 10
-4
).
0.30
0.25
0.20
0.15
10 100 1,000
Length of intron (base-pairs)
Divergence
10,000 100,000
First introns
Non-first introns
0.10
0.05
0.00
Genome Biology 2005, Volume 6, Issue 8, Article R67 Haddrill et al. R67.3
comment reviews reports refereed researchdeposited research interactions information
Genome Biology 2005, 6:R67
It has been noted that introns harbouring regulatory ele-
ments tend to be first introns [6,8], and that first introns tend
to be longer in Drosophila [17]. Thus a relationship between
intron size and divergence might only be expected for first
introns [16]. Indeed, previous studies have failed to find evi-
dence of constraint outside first introns [16,18]. In Figure 1,
we show that the strong correlation between divergence and
intron length is not specific to first introns (first introns R
s
=
-0.451, P < 10
-4
; non-first introns R
s
= -0.304, P < 10
-4
). Mean
divergences were not significantly different between first and
non-first introns when compared within short and long size
classes (Table 1). These results suggest that regulatory ele-
ments may be common enough across all longer introns that
constraint is independent of the position of an intron within a
gene.
While this is strong evidence for evolutionary constraint on
longer introns, short introns do not appear to evolve much
more slowly than synonymous sites in Drosophila. To illus-
trate this, Figure 2 shows average divergence estimates (with
two standard errors) for synonymous sites from 102 coding
regions [19] compared to those for the small (≤86 bp) and
large (>86 bp) size classes of introns. Average divergence at
non-synonymous sites [19] is also shown for comparison.
Synonymous site divergence is significantly higher than levels
of divergence for large introns (Wilcoxon two-sample W =
7745.5, P < 10
-4
) but not small introns (Wilcoxon two-sample
W = 15115.5, P = 0.617). This finding is consistent with the
conclusions of Halligan et al. [9] that introns and synony-
mous sites evolve at similar rates, given that their dataset con-
tained few long introns. One half of the introns in the genome
are less than 86 base-pairs long, but these comprise only
about 5% of total intronic DNA in the genome [14]. Thus,
ironically, while the majority of introns in the Drosophila
genome may be evolving under little or no selective con-
straint, most intronic DNA in the genome is likely to be evolv-
ing under considerable constraint.
Divergence and base composition of introns
Introns are more AT-rich than synonymous sites in Dro-
sophila [20] (Table 1). Could lower levels of divergence then
be an artefact of local GC content? There is a significantly neg-
ative relationship between divergence and GC content in the
intron dataset (R
s
= -0.345, P < 10
-4
) (Figure 3a), and a signif-
icantly positive relationship between intron length and GC
content (R
s
= 0.237, P < 10
-3
) (Figure 3b). The partial correla-
tion coefficient for divergence versus length, controlling for
GC content, is -0.132 (95% bootstrap confidence interval: -
0.192/-0.089). The partial correlations for divergence versus
GC content (controlling for length) and GC content versus
length (controlling for divergence) were -0.292 (-0.410/-
0.168) and 0.030 (-0.037/0.120), respectively. These results
suggest that the relationship between intron length and diver-
Table 1
Mean divergence and GC content values for each class of DNA
Divergence GC Content
All Short* Long* All Short* Long*
Introns
All 0.093 (0.004) 0.110 (0.005) 0.070 (0.003) 0.357 (0.006) 0.345 (0.009) 0.371 (0.007)
First 0.101 (0.005) 0.114
†
(0.006) 0.072
†
(0.006) 0.361 (0.010) 0.352
†
(0.013) 0.383
†
(0.011)
Non-first 0.085 (0.005) 0.105
†
(0.009) 0.069
†
(0.004) 0.352 (0.007) 0.337
†
(0.012) 0.365
†
(0.008)
Synonymous sites 0.127 (0.019) 0.654 (0.014)
Values are mean (standard error). *Introns were divided into two classes based on the median intron length (86 bp) [14]: short, ≤86 bp; long, >86
bp.
†
Divergence and GC content values did not differ between first and non-first introns when compared within long and short size classes.
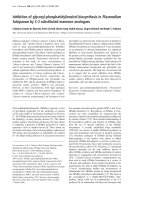
Mean divergences for non-synonymous sites, synonymous sites and both small and large intronsFigure 2
Mean divergences for non-synonymous sites, synonymous sites and both
small and large introns. Mean levels of divergence between D. melanogaster
and D. simulans for non-synonymous and synonymous sites of coding data,
introns ≤86 bp and introns >86 bp. Error bars indicate two standard
errors. Synonymous site divergence is significantly greater than large
(Wilcoxon two-sample test statistic W = 7745.5, P < 10
-4
) but not small
(W = 15115.5, P = 0.6173) intron divergences. Small intron divergence is
significantly greater than large intron divergence (W = 17079.5, P < 10
-4
).
0.18
Divergence
0.16
0.14
0.12
0.10
0.08
Non-synonymous
sites
Synonymous
sites
Introns
86 bp
Introns
>86 bp
0.06
0.04
0.02
0.00
_
<
R67.4 Genome Biology 2005, Volume 6, Issue 8, Article R67 Haddrill et al. />Genome Biology 2005, 6:R67
gence is not a confounding effect of GC content, despite the
negative correlation between divergence and GC content.
Similar to the pattern we observe in introns, a negative asso-
ciation between synonymous site substitution rates and GC
content at the third position of codons has previously been
noted in Drosophila [21] and in mammals [22]. This pattern
at synonymous sites has been cited as evidence of selection
for codon usage bias, as preferred codons are usually GC rich
[21,23]; however, selection on codon usage obviously cannot
explain the same pattern in introns. The negative relationship
between divergence and GC content in introns might instead
reflect local variation in the extent of mutational rates or
biases [22,24], or the effects of biased gene conversion
favouring GC over AT, which mimics the effect of selection in
favour of GC nucleotides [25].
The possible role of mutational bias can be examined using
the following method. It follows from the standard model of
drift and reversible mutation that, if AT mutates to GC at rate
u and GC mutates to AT at rate ku the equilibrium frequency
of GC for neutral sites (neglecting polymorphic sites) is
approximated by p = 1/(1 + k), and the equilibrium rate of
substitutions is K = 2uk/(1+k) [26,27]. This yields the relation
K = 2u(1 - p), so that the equilibrium rate of substitution is
negatively and linearly related to GC content. This formula
predicts that the intercept (divergence at zero GC content) is
equal to the absolute value of the slope, and so this hypothesis
is testable. The regression coefficient of divergence on GC
content in the complete dataset is -0.180 (-0.254/-0.106),
and the corresponding intercept is 0.157 (0.115/0.163), which
at first sight is consistent with the hypothesis that variation in
the level of the mutational bias parameter, k, is sufficient to
account for the relation between divergence and GC content.
The relationship between divergence and length, however,
makes the above test problematic, in view of the wide varia-
tion in intron length. If only the 127 short introns (length ≤ 86
bp) are used, which are much more uniform in length, the
regression of divergence on GC content is almost unchanged
at -0.116 (-0.207/-0.023), and the intercept is 0.150 (0.142/
0.162). Note, however, that there is a significant partial corre-
lation of 0.166 (0.041/0.345) between GC content and length
for short introns, but not for long introns, so there is still a
residual relation between length and GC content in short
introns. While we cannot rule out the possibility that biased
gene conversion and/or selection in favour of GC versus AT
explains the relationship between GC content and divergence,
our analysis suggests that variation in mutational bias may be
sufficient. If this process also explains the relationship
between synonymous site divergence and GC content, tests
for selection on codon bias based on negative correlations
between codon bias and divergence (recently discussed by
Bierne and Eyre-Walker [28] and Dunn et al. [29]) lose their
force. These have been criticized on other theoretical grounds
by Eyre-Walker and Bulmer [26].
The density of functional elements in introns
The correlation analyses strongly suggest that longer introns
show lower levels of divergence, and that this is not simply
caused by mutational rate differences related to GC content,
although other sources of mutation rate differences cannot of
course be ruled out. So why might longer introns be subject to
higher levels of constraint? Introns are known to contain reg-
ulatory elements (for examples, see [30,31], and see [32] for a
recent review of the mammalian literature), so it is possible
that longer introns are more constrained because they con-
tain more of these elements.
Are putative regulatory elements in longer introns discrete
entities (such as clusters of binding sites for transcription fac-
tors), or is this regulatory function more diffuse? If intronic
regulatory elements occur in clusters, surrounded by uncon-
strained regions, we might expect to find higher levels of
divergence in the short, several hundred base-pair regions of
very long introns (such as those surveyed here), compared to
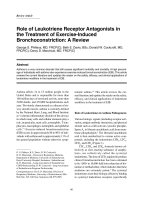
The relationship between intron fragment GC content and both divergence and lengthFigure 3
The relationship between intron fragment GC content and both
divergence and length. (a) The relationship between GC content of intron
fragments and divergence between D. melanogaster and D. simulans
(Spearman correlation coefficient R
s
= -0.345, P < 10
-4
). (b) The
relationship between GC content of intron fragments and intron length (R
s
= 0.237, P < 10
-3
).
0.30
0.25
0.20
0.15
0.10
0.05
0.00
100,00010,0001,000
Length of intron (base-pairs)
GC content
DivergenceGC content
10010
0.0 0.1 0.2 0.3 0.4 0.5 0.6 0.7
0.7
0.6
0.5
0.4
0.3
0.2
0.1
0.0
(a)
(b)
Genome Biology 2005, Volume 6, Issue 8, Article R67 Haddrill et al. R67.5
comment reviews reports refereed researchdeposited research interactions information
Genome Biology 2005, 6:R67
intermediate-sized introns, provided that they have similar
total amounts of regulatory sequences. The rationale for this
is that, if constrained regulatory elements are clustered into
one region, short fragments of very long introns would be
unlikely to coincide by chance with a functional element,
whereas similarly sized regions from introns of intermediate
length would be more likely to coincide with such elements.
Such clustering is possible, given that transcription factor
binding sites and regulatory elements can range in size from
a few base-pairs up to several hundred base-pairs (for exam-
ples, see [33-36]). If the proportion of regulatory sequence is
similar in long and intermediate introns, however, no differ-
ence in mean divergence is expected, but clustering would
cause a higher variance in divergence in very long versus
intermediate-length introns (after removing the binomial
sampling variance). If regulatory elements in introns are
widely dispersed, however, there is no reason to expect
greater means or variances of divergence in fragments from
very long introns. In fact, the mean divergence for the small
number of intron fragments from introns longer than 4,500
bp is 0.054 (SE = 0.004, n = 9). This is significantly smaller
than for the small (≤86 bp) intron class (mean divergence =
0.110, n = 127, Wilcoxon two-sample W = 252, P = 0.001) and
marginally significantly lower than for introns of intermedi-
ate size (between 87 bp and 4,500 bp: mean divergence =
0.072, n = 89, W = 4494, P = 0.044). The non-binomial
standard deviation in divergence is estimated to be 0.0056
for the very long introns, compared with 0.023 for the 38
intermediate-sized ones for which fragments at least 20 bp
shorter than the introns were used for estimating divergence
(this ensures that both classes represent samples rather than
complete sequences). This is the opposite pattern to what is
expected with strong clustering of regulatory sequences. Lev-
els of constraint, and thus the density of putatively funtional
regulatory elements, therefore appear to be relatively uniform
across longer introns.
A uniform density of regulatory functions is unexpected if
these often involve clusters of, for example, transcription fac-
tor binding sites. However, it might be expected, for example,
if the regulatory functions of introns often involve the forma-
tion of complex secondary structures. Evidence suggesting
that intron sequence and length affects the secondary struc-
ture of precursor messenger RNA (pre-mRNA) is accumulat-
ing. If this secondary structure plays a regulatory role, it is
likely to be conserved. Several studies have found evidence
for epistatic selection on introns to maintain pre-mRNA sec-
ondary structure [37-39], and there is also evidence for a
functional role of RNA secondary structure in splicing [40,41]
and gene expression [42,43]. For example, Chen and Stephan
[44] found that mutations disrupting a hairpin structure in
intron 1 of the D. melanogaster Adh gene reduce splicing effi-
ciency and decrease production of the Adh protein. These
authors show that compensatory mutations that restore the
secondary structure result in a mutant indistinguishable from
the wild type in splicing efficiency and protein production. A
hairpin structure in the second intron of this gene also shows
striking structural conservation across ten species in three
sub-genera of Drosophila [45]. Our finding that the density of
constrained sequences does not appear to be a function of
intron length (within the long intron class) suggests that pre-
mRNA secondary structure may be a more common mecha-
nism mediating gene regulation than discrete regulatory ele-
ments such as intronic transcriptional enhancers.
Conclusion
Most introns in Drosophila are relatively short, but these
short introns make up only a small fraction of total intronic
DNA in the genome. We demonstrate that levels of selective
constraint are higher with increasing intron length. Thus,
while the majority of introns in the Drosophila genome may
be evolving under little or no selective constraint, the major-
ity of intronic DNA in the genome is likely to be evolving
under considerable constraint. We also find that the density
of functionally important elements within longer introns does
not appear to depend on their length. This suggests that func-
tional elements may be ubiquitous within longer introns and
that these introns may have a more general role in regulating
gene expression than previously appreciated, possibly via the
formation of pre-mRNA secondary structures. This pattern
contrasts with that found in mammals, where constraint does
not appear to be a function of intron length [46] (A
Kondrashov, personal communication). An unexpected cor-
ollary of our study is the finding of a negative correlation
between divergence and GC content in introns. This finding
implies that a similar pattern observed for synonymous sites
in Drosophila may reflect mutational biases rather than
selection for codon usage.
Materials and methods
Introns
We combined data from three recent studies of complete
introns or several hundred base-pair fragments of longer
introns located on the X chromosome of D. melanogaster.
Halligan et al. [9] compiled previously published data for D.
melanogaster and D. simulans sequences for each of 163
introns. We combined these data with introns surveyed in D.
melanogaster and D. simulans by Glinka et al. [47]. All the
Glinka et al. [47] intron fragments were compared to the DNA
sequence of the D. melanogaster genome [48]. Ten of these
intron fragments were removed from the analysis because
they contained exonic or 5'/3' untranslated region sequences.
The alignments for a further 12 of the Glinka et al. [47] frag-
ments were trimmed to remove small quantities of exonic or
untranslated region sequences. The final Glinka et al. [47]
dataset used in the analysis therefore contained 53 intron
fragments (details on request to PR Haddrill). To this we
added nine more intron fragments surveyed by Haddrill et al.
[49]. For consistency with Halligan et al. [9], we realigned
these sequences with the program MCALIGN, using the
R67.6 Genome Biology 2005, Volume 6, Issue 8, Article R67 Haddrill et al. />Genome Biology 2005, 6:R67
insertion-deletion frequency model defined for Drosophila
intronic DNA [50,51]. Divergence estimates per site and the
GC content of introns were generated for each alignment
(excluding the 6 bp/16 bp at the 5'/3' end of the intron, which
include bases that are constrained because they are necessary
for correct splicing) using the DnaSP software package (Ver-
sion 4) [52], which corrects divergence values for multiple
hits using the Jukes-Cantor equation [53]. The use of diver-
gence as a proxy for constraint is appropriate, because the
level of selective constraint in a sequence will directly affect
the divergence between two species; highly constrained
sequences will show little divergence, whereas sequences
under little or no selective constraint will accumulate differ-
ences more rapidly. Sites overlapping alignment gaps were
excluded from the count of total base-pairs. The total length
of each intron was determined using the DNA sequence of the
D. melanogaster genome [48]. The mean total intron length
across the entire dataset was 936.5 bp and the mean length of
the fragments of introns analyzed here was 230.2 bp.
Because we did not analyse the entire length of all of the
introns included in this study, we were unable to investigate
whether intron lengths vary substantially between D. mela-
nogaster and D. simulans. Previous evidence suggests that
intron lengths are unlikely to differ to any great extent
between the two species, however, and that transitions
between the short and long intron size class are rare
[15,20,54].
Partial moment correlation coefficients and least-squares
regression coefficients were calculated by the standard for-
mulae, and their significance assessed by bootstrapping over
loci 1,000 times to obtain their resampling distributions [55].
Coding regions
As a comparison for levels of divergence at intron sites, we
used synonymous site divergences from 102 genes compiled
by Betancourt and Presgraves [19]. Single-pass sequenced
ESTs from this same study were not included in the analysis.
Estimates of synonymous site divergences calculated using
the Nei and Gojobori [56] correction were kindly provided by
A Betancourt. Divergence estimates for synonymous sites
based on D. melanogaster - D. simulans alignments for 35
additional X-linked coding regions were identical, and did not
differ significantly from divergence estimates for fourfold
degenerate sites (P Andolfatto, unpublished data). Several
previous studies have documented a positive relationship
between exon length and synonymous site divergences [57-
59]. This relationship is in the opposite direction to that
which would be expected if there were some (unknown) factor
co-varying with gene length and neutral divergence that was
responsible for the negative association between intron
length and intron divergence. Non-synonymous site diver-
gences from the same 102 genes compiled by Betancourt and
Presgraves [19] (kindly provided by A Betancourt) were also
used in Figure 2 for visual comparison with synonymous and
intron sites; as expected, these are smaller than the other val-
ues, consistent with strong selection against most amino acid
substitutions.
Effects of sex linkage
As our data come from three different sources, we investi-
gated possible biases relating to how and why the data were
collected. In particular, the studies of Haddrill et al. [49] and
Glinka et al. [47] surveyed intron fragments from longer
introns on the X chromosome, whereas the data of Halligan et
al. [9] contains mostly short introns from all chromosomes.
We note a significant difference between autosomal versus X-
linked introns in both levels of divergence (Wilcoxon two-
sample W = 13502.5, P = 0.006) and GC content (W =
13211.5, P = 0.005). When comparing within size classes (≤86
bp versus >86 bp), however, levels of divergence are not sig-
nificantly different between autosomal and X-linked introns,
and GC content is significantly different for the short intron
class, but not the long intron class. The negative correlation
between intron length and divergence holds for autosomal
and X-linked introns separately (autosomes, Spearman R
s
= -
0.261, P = 0.006; X-linked, Spearman R
s
= -0.403, P < 10
-4
)
as does the negative relationship between GC content and
divergence (autosomes, Spearman R
s
= -0.281, P = 0.003; X-
linked, Spearman R
s
= -0.371, P < 10
-4
). The differences in
levels of divergence and GC content between autosomal and
X-linked introns, therefore, cannot explain the observed rela-
tionships between intron length versus divergence and GC
content versus divergence.
Additional data files
The following additional data are available with the online
version of this paper. Additional data file 1 is an Excel file list-
ing all introns analyzed. Additional data files 2, 3 and 4 cona-
tain alignments of the Glinka et al. [47], Haddrill et al. [49]
and Halligan et al. [9] data, respectively. Additional data file
5 contains programs written to carry out partial moment cor-
relations, least-squares regressions and bootstrapping proce-
dures and the data used for these analyses.
Additional File 1An Excel file listing all introns analyzedAn Excel file listing all introns analyzedClick here for fileAdditional File 2Alignments of the Glinka et al. [47] dataAlignments of the Glinka et al. [47] dataClick here for fileAdditional File 3Alignments of the Haddrill et al. [49] dataAlignments of the Haddrill et al. [49] dataClick here for fileAdditional File 4Alignments of the Halligan et al. [9] dataAlignments of the Halligan et al. [9] dataClick here for fileAdditional File 5Programs written to carry out partial moment correlations, least-squares regressions and bootstrapping procedures and the data used for these analysesPrograms written to carry out partial moment correlations, least-squares regressions and bootstrapping procedures and the data used for these analysesClick here for file
Acknowledgements
We thank A Betancourt for providing divergence estimates for the Betan-
court and Presgraves [19] dataset. We thank D Bachtrog, M Przeworski, K
Dyer, F Kondrashov and D Presgraves for comments on the manuscript.
This work was funded in part by a Biotechnology and Biological Sciences
Research Council Grant (to PA and BC) and an AP Sloan Fellowship in
Molecular and Computational Biology to PA. BC is supported by The Royal
Society.
References
1. Hardison RC: Conserved noncoding sequences are reliable
guides to regulatory elements. Trends Genet 2000, 16:369-372.
2. Clark AG: The search for meaning in noncoding DNA. Genome
Res 2001, 11:1319-1320.
3. Bergman CM, Kreitman M: Analysis of conserved noncoding
DNA in Drosophila reveals similar constraints in intergenic
and intronic sequences. Genome Res 2001, 11:1335-1345.
Genome Biology 2005, Volume 6, Issue 8, Article R67 Haddrill et al. R67.7
comment reviews reports refereed researchdeposited research interactions information
Genome Biology 2005, 6:R67
4. Shabalina SA, Ogurtsov AY, Kondrashov VA, Kondrashov AS: Selec-
tive constraint in intergenic regions of human and mouse
genomes. Trends Genet 2001, 17:373-376.
5. Dermitzakis ET, Reymond A, Lyle R, Scamuffa N, Ucla C, Deutsch S,
Stevenson BJ, Flegel V, Bucher P, Jongeneel CV, Antonarakis SE:
Numerous potentially functional but non-genic conserved
sequences on human chromosome 21. Nature 2002,
420:578-582.
6. Gaffney DJ, Keightley PD: Unexpected conserved non-coding
DNA blocks in mammals. Trends Genet 2004, 20:332-337.
7. Li W-H, Graur D: Fundamentals of Molecular Evolution. Sunderland,
Massachusetts: Sinauer; 1991.
8. Majewski J, Ott J: Distribution and characterization of regula-
tory elements in the human genome. Genome Res 2002,
12:1827-1836.
9. Halligan DL, Eyre-Walker A, Andolfatto P, Keightley PD: Patterns of
evolutionary constraints in intronic and intergenic DNA of
Drosophila. Genome Res 2004, 14:273-279.
10. Gibbs RA, Weinstock GM, Metzker ML, Muzny DM, Sodergren EJ,
Scherer S, Scott G, Steffen D, Worley KC, Burch PE, et al.: Genome
sequence of the Brown Norway rat yields insights into mam-
malian evolution. Nature 2004, 428:493-521.
11. Jareborg N, Birney E, Durbin R: Comparative analysis of noncod-
ing regions of 77 orthologous mouse and human gene pairs.
Genome Res 1999, 9:815-824.
12. Shabalina SA, Kondrashov AS: Pattern of selective constraint in
C. elegans and C. briggsae genomes. Genet Res Camb 1999,
74:23-30.
13. Comeron JM, Kreitman M: The correlation between intron
length and recombination in Drosophila: dynamic equilib-
rium between mutational and selective forces. Genetics 2000,
156:1175-1190.
14. Yu J, Yang Z, Kibukawa M, Paddock M, Passey DA, Wong GK-S: Min-
imal introns are not "junk". Genome Res 2002, 12:1185-1189.
15. Parsch J: Selective constraints on intron evolution in Dro-
sophila. Genetics 2003, 165:1843-1851.
16. Marais G, Nouvellet P, Keightley PD, Charlesworth B: Intron size
and exon evolution in Drosophila. Genetics 2005, 170:481-485.
17. Duret L: Why do genes have introns? Recombination might
add a new piece to the puzzle. Trends Genet 2001, 17:172-175.
18. Keightley PD, Gaffney DJ: Functional constraints and frequency
of deleterious mutations in noncoding DNA of rodents. Proc
Natl Acad Sci USA 2003, 100:13402-13406.
19. Betancourt AJ, Presgraves DC: Linkage limits the power of nat-
ural selection in Drosophila. Proc Natl Acad Sci USA 2002,
99:13616-13620.
20. Akashi H: Molecular evolution between Drosophila mela-
nogaster and D. simulans: reduced codon bias, faster rates of
amino acid substitution, and larger proteins in D.
melanogaster. Genetics 1996, 144:1297-1307.
21. Moriyama EN, Hartl DL: Codon usage bias and base composi-
tion of nuclear genes in Drosophila. Genetics 1993, 134:847-858.
22. Filipski J: Why the rate of silent codon substitutions is variable
within a vertebrate’s genome. J Theor Biol 1988, 134:159-164.
23. Akashi H: Synonymous codon usage in Drosophila mela-
nogaster: natural selection and translational accuracy. Genet-
ics 1994, 136:927-935.
24. Wolfe K, Sharp PM, Li W-H: Mutation rates differ among
regions of the mammalian genome. Nature 1989, 337:283-285.
25. Nagylaki T: Evolution of a finite population under gene
conversion. Proc Natl Acad Sci USA 1983, 80:6278-6281.
26. Eyre-Walker A, Bulmer M: Synonymous substitution rates in
enterobacteria. Genetics 1995, 140:1407-1412.
27. Sueoka N: Directional mutation pressure, mutator muta-
tions, and dynamics of molecular evolution. J Mol Evol 1993,
37:137-153.
28. Bierne N, Eyre-Walker A: The problem of counting sites in the
estimation of the synonymous and nonsynonymous substitu-
tion rates: Implications for the correlation between the syn-
onymous substitution rate and codon usage bias. Genetics
2003, 165:1587-1597.
29. Dunn KA, Bielawski JP, Yang ZH: Substitution rates in Drosophila
nuclear genes: Implications for translational selection. Genet-
ics 2001, 157:295-305.
30. Lou L, Bergson C, McGinnis W: Deformed expression in the Dro-
sophila central nervous system is controlled by an autoacti-
vated intronic enhancer. Nucleic Acids Res 1995, 23:3481-3487.
31. Bartoszewski S, Gibson JB: Regulation of the expression of the
sn-glycerol-3-phosphate dehydrogenase gene in Drosophila
melanogaster. Biochem Genet 1998, 36:329-350.
32. Shabalina SA, Spiridonov NA: The mammalian transcriptome
and the function of non-coding DNA sequences. Genome Biol
2004, 5:105.
33. Berman BP, Nibu Y, Pfeiffer BD, Tomancak P, Celniker SE, Levine M,
Rubin GM, Eisen MB: Exploiting transcription factor binding
site clustering to identify cis-regulatory modules involved in
pattern formation in the Drosophila genome. Proc Natl Acad Sci
USA 2002, 99:757-762.
34. Dermitzakis ET, Bergman CM, Clark AG: Tracing the evolution-
ary history of Drosophila regulatory regions with models
that identify transcription factor binding sites. Mol Biol Evol
2003, 20:703-714.
35. Berezikov E, Guryev V, Plasterk RHA, Cuppen E: CONREAL: Con-
served regulatory elements anchored alignment algorithm
for identification of transcription factor binding sites by phy-
logenetic footprinting. Genome Res 2004, 14:170-178.
36. Bergman CM, Carlson JW, Celniker SE: Drosophila DNase I foot-
print database: a systematic genome annotation of tran-
scription factor binding sites in the fruitfly, Drosophila
melanogaster. Bioinformatics 2005, 21:1747-1749.
37. Schaeffer SW, Miller EL: Estimates of linkage disequilibrium and
the recombination parameter determined from segregating
nucleotide sites in the alcohol dehydrogenase region of Dro-
sophila pseudoobscura. Genetics 1993, 135:541-552.
38. Kirby DA, Muse SV, Stephan W: Maintenance of pre-mRNA sec-
ondary structure by epistatic selection. Proc Natl Acad Sci USA
1995, 92:9047-9051.
39. Matzkin LM, Eanes WF: Sequence variation of alcohol dehydro-
genase (Adh) paralogs in cactophilic Drosophila. Genetics
2003, 163:181-194.
40. Solnick D: Alternative splicing caused by RNA secondary
structure. Cell 1985, 43:667-676.
41. Leicht BG, Muse SV, Hanczyc M, Clark AG: Constraints on intron
evolution in the gene encoding the Myosin alkali light chain
in Drosophila. Genetics 1995, 139:299-308.
42. Liebhaber SA, Cash F, Eshleman SS: Translation inhibition by an
mRNA coding region secondary structure is determined by
its proximity to the AUG initiation codon. J Mol Biol 1992,
226:609-621.
43. Carlini DB, Chen Y, Stephan W: The relationship between third-
codon position nucleotide content, codon bias, mRNA
secondary structure and gene expression in the Drosophilid
alcohol dehydrogenase genes Adh and Adhr. Genetics 2001,
159:623-633.
44. Chen Y, Stephan W: Compensatory evolution of a precursor
messenger RNA secondary structure in the Drosophila mela-
nogaster Adh gene. Proc Natl Acad Sci USA 2003, 100:11499-11504.
45. Stephan W, Kirby DA: RNA folding in Drosophila shows a dis-
tance effect for compensatory fitness interactions. Genetics
1993, 135:97-103.
46. Ogurtsov AY, Sunyaev S, Kondrashov AS: Indel-based evolution-
ary distance and mouse-human divergence. Genome Res 2004,
14:1610-1616.
47. Glinka S, Ometto L, Mousset S, Stephan W, De Lorenzo D: Demog-
raphy and natural selection have shaped genetic variation in
Drosophila melanogaster: A multi-locus approach. Genetics
2003, 165:1269-1278.
48. FlyBase: A database of the Drosophila genome [http://
www.flybase.org]
49. Haddrill PR, Thornton KR, Charlesworth B, Andolfatto P: Multilo-
cus patterns of nucleotide variability and the demographic
and selection history of Drosophila melanogaster populations.
Genome Res 2005, 15:790-799.
50. Keightley PD, Johnson T: MCALIGN: stochastic alignment of
noncoding DNA sequences based on an evolutionary model
of sequence evolution. Genome Res 2004, 14:442-450.
51. MCALIGN for alignment of noncoding DNA [http://
homepages.ed.ac.uk/eang33/mcinstructions.html]
52. DnaSP Software [ />53. Jukes TH, Cantor CR: Evolution of protein molecules. In Mam-
malian Protein Metabolism III. Edited by: Munro HN. New York: Aca-
demic Press; 1969:21-132.
54. Stephan W, Rodriguez VS, Zhou B, Parsch J: Molecular evolution
of the Metallothionein gene Mtn in the melanogaster species
group: results from Drosophila ananassae. Genetics 1994,
138:135-143.
R67.8 Genome Biology 2005, Volume 6, Issue 8, Article R67 Haddrill et al. />Genome Biology 2005, 6:R67
55. Sokal RR, Rohlf FJ: Biometry. San Francisco: WH Freeman; 1995.
56. Nei M, Gojobori T: Simple methods for estimating the num-
bers of synonymous and nonsynonymous nucleotide
substitutions. Mol Biol Evol 1986, 3:418-426.
57. Powell JR, Moriyama EN: Evolution of codon usage bias in Dro-
sophila. Proc Natl Acad Sci USA 1997, 94:7784-7790.
58. Comeron JM, Kreitman M, Aguade M: Natural selection on syn-
onymous sites is correlated with gene length and recombina-
tion in Drosophila. Genetics 1999, 151:239-249.
59. Duret L, Mouchiroud D: Expression pattern and, surprisingly,
gene length shape codon usage in Caenorhabditis, Drosophila
and Arabidopsis. Proc Natl Acad Sci USA 1999, 96:4482-4487.