Báo cáo y học: "he discovery, positioning and verification of a set of transcription-associated motifs in vertebrates" pps
Bạn đang xem bản rút gọn của tài liệu. Xem và tải ngay bản đầy đủ của tài liệu tại đây (4.51 MB, 14 trang )
Genome Biology 2005, 6:R104
comment reviews reports deposited research refereed research interactions information
Open Access
2005Ettwilleret al.Volume 6, Issue 12, Article R104
Method
The discovery, positioning and verification of a set of
transcription-associated motifs in vertebrates
Laurence Ettwiller
¤
*
, Benedict Paten
¤
*
, Marcel Souren
¤
†
, Felix Loosli
†
,
Jochen Wittbrodt
†
and Ewan Birney
*
Addresses:
*
EBI, Wellcome Trust Genome Campus, Hinxton, Cambridgeshire, CB10 1SD, UK.
†
EMBL, Meyerhofstrasse, 69012 Heidelberg,
Germany.
¤ These authors contributed equally to this work.
Correspondence: Ewan Birney. E-mail:
© 2005 Ettwiller et al.; licensee BioMed Central Ltd.
This is an open access article distributed under the terms of the Creative Commons Attribution License ( which
permits unrestricted use, distribution, and reproduction in any medium, provided the original work is properly cited.
Transcription-related vertebrate motifs<p>Short abstract here</p>
Abstract
We have developed several new methods to investigate transcriptional motifs in vertebrates. We
developed a specific alignment tool appropriate for regions involved in transcription control, and
exhaustively enumerated all possible 12-mers for involvement in transcription by virtue of their
mammalian conservation. We then used deeper comparative analysis across vertebrates to identify
the active instances of these motifs. We have shown experimentally in Medaka fish that a subset of
these predictions is involved in transcription.
Background
A genome encodes more than just the structural proteins or
RNA sequences that form active biological molecules. In
addition, the control of expression of these structural genes is
determined by elements that act at the DNA, RNA or epige-
netic level and are associated with specific genes in some
manner. Considerable knowledge of these regulatory net-
works is available for specific sets of genes; for example, the
network of largely transcription based control involved in
muscle specific gene expression in mammals [1], or the con-
trol of sex determination in the Drosophilids [2], which is pri-
marily via regulation of RNA processing. In the case of
transcriptional control, these elements work by modulating
the rate of transcription from promoters (reviewed in [3]).
Surprisingly, we have no strong computational model to allow
us to predict where the genomic elements involved in gene
expression lie despite often detailed knowledge of certain
control elements, perhaps best illustrated by the set of genes
involved in the development of the sea urchin [4]. This is true
either in a whole genome context or when one restricts the
problem to areas suspected to be involved, for example,
regions directly upstream of genes. In contrast, for constitu-
tive RNA processing of pre-mRNA molecules, we have com-
putational models that provide reasonably good predictions,
through programs such as Genscan [5] and Fgenesh [6]. Per-
haps more importantly, these computational models have
allowed the development of programs, such as Genewise [7],
Genie [8] and est2genome [9], that integrate experimental
data and gene model aspects to provide highly accurate gene
prediction. We have not found all the protein coding genes in
any large genome, but we do have a good sense of where a
large portion of the genes are located due to this computa-
tional model. Having a practical, predictive model for the
transcriptional elements of a genome would provide a signif-
icant advance in the understanding of the regulation of
Published: 2 December 2005
Genome Biology 2005, 6:R104 (doi:10.1186/gb-2005-6-12-r104)
Received: 22 August 2005
Revised: 18 October 2005
Accepted: 8 November 2005
The electronic version of this article is the complete one and can be
found online at />R104.2 Genome Biology 2005, Volume 6, Issue 12, Article R104 Ettwiller et al. />Genome Biology 2005, 6:R104
specific genes and the interpretation of mutations that are
associated with human disease.
We, like many researchers, make a distinction between short
'motifs' and longer 'regions' involved in cis-regulation. For an
excellent review on the subject with a discussion of evolution-
ary aspects see Wray et al. [10] and for a review from the bio-
informatics perspective see Wasserman and Sandelin [11]. A
motif is a subsequence of DNA of between 6 and 20 base pairs
(bp) of fixed or almost fixed width. In most cases, each motif
has a particular sequence consensus that generalizes all cop-
ies of the motif. It is thought that a single factor or a small
multimeric complex of transcription factors binds the motif,
and the sequence consensus is a property of this binding.
Regions are far longer, up to approximately 1,000 bp of
genomic sequence. The promoter can be classed as a region
just proximal to the transcription start whereas enhancers or
locus control regions are regions some distance from the pro-
moter. This simplistic classification by distance probably
incorrectly combines and separates underlying mechanistic
classes. Generalizing from the elegant work done on specific
examples [4], we expect that most regions have clusters of
motifs that somehow act synergistically.
One perplexing aspect of transcriptional control mediated by
cis-regulatory motifs is that, in large genomes, one expects
and observes between 10e4 to 10e6 instances of each motif in
the genome. It is hard to imagine that all these instances are
equally likely to be occupied, with transcriptional control
occurring via this occupancy. Suggested reasons to reconcile
the direct experimental evidence of binding affinities with
this large excess of potential sites include epigenetic features,
in particular chromatin modeling and methylation, and coop-
erative binding of complex combinations of motifs that allows
multiple weak signals to be combined to provide specificity.
For an excellent review of this area see Jenuwein and Allis
[12]. Sadly, the epigenetic factors are not as amenable to
experimental analysis as the raw DNA sequence, though there
has been considerable progress in recent years [13,14]. More
importantly for this paper, these aspects are hard to model
computationally.
Previous attempts at computational investigations of cis-reg-
ulation have focused on three main avenues of attack. One is
to build carefully curated results of direct experimental work,
in the hope that either there are enough experiments to effec-
tively cover a particular genome or that such collections pro-
vide useful computational generalizations applicable to the
whole genome. The TransFac database [15] and the Tran-
scription Regulatory Regions Database (TRRD) [16] are good
examples of this approach, and in our hands we find the Jas-
par database [17] the most accurate representation of known
transcription factor binding data. The second approach is to
use large scale experimental techniques, in particular chro-
matin immunoprecipitation followed by large scale assay
using microarrays, so called chIP on Chip techniques [18,19].
The final approach is to use pure bioinformatics investigation
of genome sequences. Conventionally, researchers have com-
bined genome data with a second dataset. Two datasets are
commonly used; gene expression data [20-24] and compara-
tive data such as in [25]. Many groups have had considerable
success in studying motifs in Saccharomyces cerevisiae,
including comparative genomics approaches [26]. In our own
previous work, we have used protein-protein interaction data
and metabolic information in combination with the yeast
genome to provide an effective (although partial) investiga-
tion [27]. Comparative information is often used in more lim-
ited studies when a researcher is only interested in a small set
of genes, using methods commonly termed 'phylogenetic
footprinting' [25]. As most of these techniques need several
relatively close species to be sequenced to be effective, many
of these phylogenetic techniques are not yet applicable
genome-wide in vertebrates. The recent paper by Xie et al.
[28] shows the current state of the art in this area: using four
genome sequences they were able to identify motifs that were
over-represented in conserved regions around genes, and
showed that these motifs are non-randomly distributed with
respect to gene expression data. Xie et al. were not able, how-
ever, to identify the specific instances of the motif that were
the active copies of these motifs in the genome. The 'evolu-
tionary selex' method presented in this paper is similar to the
Xie et al. technique and was developed independently.
In this paper we propose a novel genome-wide computational
method that also uses comparative genomics in two distinct
stages. Similar to the Xie et al. method, we do not attempt to
make direction predictions of motif positions on genomes
from individual promoter sequences. Instead we aim to pre-
dict an accurate dictionary of motifs with statistical proper-
ties that seem specific to cis-regulatory motifs using a
technique we have called 'evolutionary selex' with inter-mam-
malian alignments. Specifically for this project, we developed
a novel alignment routine that we believe models more closely
promoter evolution and show in passing that for most, but not
all, cases promoter elements seem to remain co-linear over
human/mouse evolutionary distances. We then used an effi-
cient method to allow direct enumeration of all possible
motifs up to 12-mers, including motifs with wild cards. This
brute force enumeration means that we do not have a
machine learning optimization problem to solve. We there-
fore have independently confirmed the generation of a motif
set using comparative genomics, similar to the Xie et al.
paper, but we extended this work to find specific instances.
We used a more distant comparative genomics approach of
over-representation in related orthologs across vertebrates to
identify specific instances for these motifs. We show by direct
experiments in Medaka fish that these active motifs are nec-
essary to drive expression in vivo and their removal affects
transcription.
Genome Biology 2005, Volume 6, Issue 12, Article R104 Ettwiller et al. R104.3
comment reviews reports refereed researchdeposited research interactions information
Genome Biology 2005, 6:R104
Results
Alignment of promoters
We wished to develop an alignment program focused on the
evolution of regions involved in transcriptional processes. We
reasoned that such a tool should be tolerant to inversions and
translocations as well as the more usual insertions and dele-
tions. We also felt that long insertions or deletions should be
tolerated. When considering inversions or translocations, the
resulting alignment grammar becomes a context-sensitive
style grammar, and there is, therefore, no polynomial time
method to find a maximum score for a given scoring scheme
of these events [29]. We therefore used a pragmatic heuristic
of seeding from small ungapped alignments followed up by a
series of local alignments using the DNA Block Aligner (DBA)
alignment model [30] implemented in the program promot-
erwise (see Materials and methods for more detail).
The DBA method is parameterized as a probabilistic model of
short, relatively gap-free conserved sequences compared to a
null model of unrelated bases [30]. The natural scoring
method of such a probabilistic model is to report the log of the
likelihood ratio of the two models, which is calculated in a sin-
gle dynamic programming routine. The likelihood ratio could
be used to generate a posterior probability assessment of the
significance of each alignment, but one would still need to
choose a prior probability for the chance of seeing an align-
ment before examining the data. This prior becomes equiva-
lent to a threshold of log-odd likelihood score above which
one believes the alignment to be significant. We investigated
a number of properties of both real and random promoter-
wise alignments select this threshold. We performed simula-
tion studies with random sequence that showed that bit
scores >20 bits are extremely rare when aligning randomly
generated sequences. Turning to real alignments, we com-
pared promoter regions from several different species pairs,
in each case taking orthologous genes from Ensembl and
using the 5 kb upstream of the longest transcript to define the
potential promoter. As the bit score cutoff was increased, a
greater fraction of the alignments matched the direction of
transcription in both genes. A striking discontinuity was
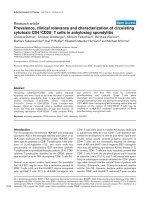
observed around 20 bits (Figure 1). Other characteristics of
promoterwise behavior also changed at around 20 bits,
including a sharp discontinuity of the number of pairs of
orthologs showing alignment of this score or higher.
We compared promoterwise alignment to other alignment
methods, in particular BLASTZ [31], which is a robust and
well tested heuristic method based around a Smith-Water-
man style alignment. BLASTZ has a scoring scheme tuned to
cover the maximal amount of human/mouse orthologous
base pairs. Promoterwise alignments greater than 25 bits are
found 96% of the time inside BLASTZ alignments but repre-
sent only 13% of the BLASTZ aligned base pairs. When the
'tight' scoring matrix used by the University of California
Santa Cruz Genome Browser Group (UCSC) is applied to the
BLASTZ alignments, only 42% of the promoterwise align-
ments overlap tight BLASTZ alignments. A similar compari-
son to LAGAN alignments (from a four-way MLAGAN across
human, mouse, dog and rat, and then taking the projected
pairwise human/mouse alignment) showed similar results of
promoterwise alignments being a specific subset of the
LAGAN alignment, but not a different alignment of the bases.
Our interpretation is that the promoterwise scoring scheme
with a 25 bit cutoff selects for a particular subset of DNA that
is likely to be under negative selection. This is because of the
sharp increase of the strand ratio of the alignments towards
mainly collinear orientations, suggesting that a different
process from random alignments (including neutral inver-
sions or translocations) is occurring. Furthermore we will
assume later on that these negatively selected alignments will
be enriched in functional sequences in promoters and that
these are most likely to be transcriptional motifs. This is
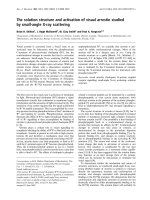
A plot showing the ratio of +/+ orientation promoterwise alignments (being collinear with the direction of transcription) versus all alignments for human/mouse (blue lines) and human/chicken (magenta) promotersFigure 1
A plot showing the ratio of +/+ orientation promoterwise alignments
(being collinear with the direction of transcription) versus all alignments
for human/mouse (blue lines) and human/chicken (magenta) promoters.
The x-axis is the bit score range, binned in 1 bit intervals. The y-axis is the
ratio of +/+ alignments to the total number in this range. All species
except mouse/rat show similar 'step' behavior between 20 and 25 bits.
The depression below 0.5 of mouse/human alignments at low bit scores at
first seems surprising, as one expects random data to show a 0.5 ratio.
This depression is because there is a significant amount of +/+ alignments
which, when close to random alignments, will often capture low scoring
alignments, especially if it is straddled by two high scoring alignments, and
merge into one high scoring alignment. As this predominantly occurs in
forward/forward alignments, this means that there is a depression of low
scoring forward/forward alignments.
0.3
0.4
0.5
0.6
0.7
0.8
0.9
1
020406080
Sco
re
Rat
io
Human versus
Chicken
Human versus
Mouse
R104.4 Genome Biology 2005, Volume 6, Issue 12, Article R104 Ettwiller et al. />Genome Biology 2005, 6:R104
because we expect that removal of transcriptional motifs
would, in general, be detrimental to the organism. At closer
distances (for example, mouse/rat) we observed different
behavior, probably due to neutral DNA still aligning because
the neutral inversions have not had enough time to accumu-
late 'drift' mutations. In human, we produced a set of nega-
tively selected DNA from the comparison with mouse in the
upstream regions of 10,300 genes, totaling 6,571,106 bp
(0.21% of the human genome).
Motif discovery by evolutionary selex
We wished to use this negatively selected pool of DNA to dis-
cover motifs. We investigated several objective functions that
could distinguish potential cis-regulatory motifs from other
motifs. A poor result was observed when using over-represen-
tation of motifs in promoter sequences versus background
genome (data not shown). In our hands, an excellent objec-
tive function was the relative distribution of motifs in con-
served versus non-conserved regions in significant
promoterwise based alignments (see Materials and methods).
We term this approach 'evolutionary selex' as it mimics the
selex method [32] of discovering the binding site of a motif by
looking at a population of sequences that satisfy a criterion.
Rather than using immunoprecipitation to select these
sequences, we used evolution to enrich our sequence pool.
There are two main challenges to solve here: finding the right
metric to confidently distinguish a real motif from the back-
ground and then a way to use this metric to find new motifs.
Statistics of small subsequences in conserved regions
The relationship between the occurrence of motifs in the
restricted regions of negative selection versus overall occur-
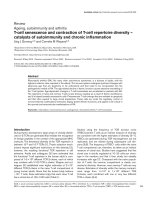
rence in promoters can be seen in Figure 2, which shows this
ratio for three different regions of the human genome for all
7-mer words. The choice of 7-mers is to show reasonably com-
plex word behavior for this discussion; the enumeration
described later tests all n-mers up to 12. Notice that for both
randomly chosen and downstream regions there seems to be
a well defined relationship between the total occurrence of a
motif and its occurrence in these conserved regions. The CG
motifs show classic suppression across the genome. The well
understood phenomena of cytosine methylation on CpG
dinucleotides allows the methylated cytosine to mutate far
faster than any other base pair in the genome, leading to a rel-
ative lack of CG dinucleotides in the genome except in
unmethylated regions.
The downstream and random distributions are reasonably
well modeled by a simple binomial distribution where there is
some probability of landing in a conserved region, so that, for
a given overall occurrence of a motif, a proportion of the
motifs randomly fall in these conserved regions. The shape of
the distribution is a good fit but there is too much variance of
the conserved number for a particular occurrence number.
We believe this is simply due to non-random behavior of
words in the human genome (probably changing the total
occurrence number in a complex manner). Given that the
shape of the distribution is a good model, however, we believe
that motifs >10 standard deviations can be considered very
non-random and thus interesting for further study.
Figure 2 shows the ratio of occurrence versus conservation for
upstream regions. This plot is radically different from the
other plots: most obviously the CG containing motifs are
behaving separately from their non-CG peers. More subtly,
there are many more motifs in the top left side of the distribu-
tions (found more times in conserved regions than their peers
of similar overall occurrence). This radically different behav-
ior indicates that conservation is behaving differently with
respect to words in upstream regions. A complex relationship
between occurrence and conservation counts, however,
prevents a simple statistical model. In particular, there is no
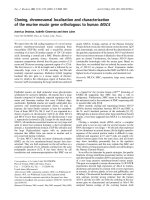
Three panels showing the conservation versus occurrence of all 7-mer words in three different areas of the genomeFigure 2
Three panels showing the conservation versus occurrence of all 7-mer words in three different areas of the genome. (a) Random regions. (b) Regions 5
kb upstream of genes. (c) Regions 5 kb downstream of genes. Each word is colored either red if it has one or more CG dinucleotides or green otherwise.
0 2,000 4,000 6,000 8,000 10,000
0
50
150
Random
Occurrences
Conserved occurrences
0 2,000 4,000 6,000 8,000 10,000
0
100
200
300
400
500
Upstream
Occurrences
Conserved occurrences
0 2,000 4,000 6,000 8,000 10,00
0
0
200
400
600
800
Downstream
Occurrences
Conserved occurrences
(a) (b) (c)
100
Genome Biology 2005, Volume 6, Issue 12, Article R104 Ettwiller et al. R104.5
comment reviews reports refereed researchdeposited research interactions information
Genome Biology 2005, 6:R104
single model of the distribution we can use for both the CG
containing motifs and non-CG containing motifs. As well as it
being unsatisfying to have to separate these cases, this dual
distribution precludes us from combining non-CG and CG
motifs sensibly when wild cards are used.
We reasoned that dual behavior was unsurprisingly due to
differential methylation of upstream regions giving rise to the
well known signature of CpG islands. The problem is that we
were combining two different types of regions (methylated
versus unmethylated) with different word behaviors. There is
no direct measurement of this methylation status genome-
wide, so we used the classic observed versus expected ratio of
CpG dinucleotides to make an approximate partitioning of
our dataset. Importantly, we used far less stringent window
lengths for valid sequences: we were not interested in pre-
dicted CpG islands in the context of the whole genome, but
rather in predicting methylation status in the context of pre-
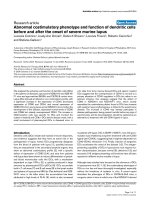
viously defined upstream regions. Figure 3 shows the now
similar plots of the conserved versus total occurrence for
these CpG (putatively unmethylated) and non-CpG (puta-
tively methylated) regions. Now both distributions have the
bulk of the CG containing motifs (red), behaving similarly to
their non-CG containing peers (green), with the methylated
regions showing the classic suppression of CG containing
motifs. Interestingly, the CpG (putatively unmethylated)
regions contain a larger quantity of significant points than the
non-CpG (putatively methylated) regions, though both sets
have significant motifs. These interesting motif points are
both CpG containing motifs and non CG containing motifs
and contain some purely AT motifs, in particular the classic
TATA box (see below).
Motif language enumeration
To perform a thorough search for motifs with significant
objective function scores we used a suffix tree based method.
This has the advantage that comparatively large pattern lan-
guages could be investigated quickly compared to simpler
brute force enumeration strategies, such as using the stand-
ard regular expression in-built into many languages.
Pattern enumeration algorithms based on suffix trees have
been previously published [20,33], but their use has been typ-
ically limited to prokaryotes and yeast because of their exces-
sive memory requirements, despite requiring memory
linearly in proportion to the total sequences used. Rather
than use less memory demanding suffix arrays, here we have
used an efficient but fast suffix tree memory scheme [34] to
get the appropriate compromise between physical memory
use and performance.
Choosing the appropriate pattern language was important for
capturing as much useful information as possible. We tested
pattern languages using both mismatches, where a specified
number were allowed from the consensus sequence, and
IUPAC ambiguity characters. Although both have merit, for
many of our motifs with low information content, mis-
matches unrestricted in position could interrupt vital parts of
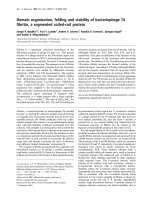
Two panels showing conservation versus occurrence of all 7-mer words upstream of genes split into (a) putatively unmethylated or (b) putatively methylatedFigure 3
Two panels showing conservation versus occurrence of all 7-mer words upstream of genes split into (a) putatively unmethylated or (b) putatively
methylated. In each case, only 5 kb upstream of genes was considered. Each word is colored either red if it has one or more CG dinucleotides or green
otherwise.
2,000 4,000 6,000 8,000 10,000
0
100
200
300
Minus CpG Islands
Occurrences
Conserved occurrences
0 500 1,000 2,000 3,000
0
100
200
300
CpG Islands
Occurrences
Conserved occurrences
1,500 2,500
3,500
(a) (b)
R104.6 Genome Biology 2005, Volume 6, Issue 12, Article R104 Ettwiller et al. />Genome Biology 2005, 6:R104
Table 1
Non-degenerate motifs found by the evolutionary selex (EvoSelex) method
Motif Cluster size Annotation Reference EvoSelex Z-score Comparative P value
CpG region motifs
CCAATC 11 CAAT-BOX [40] 28.1 6.4e-6
GGGCGG 6 SP1 [41] 24.9 1.8e-8
TGACGTCA 3 CRE [42] 23.8 2.8e-9
CGGAAG* 5 ETS [43] 23.4 3.6e-9
CACGTG* 1 E-Box [44] 23.1 3.3e-7
ACTACA* 3 20.4 6.0e-5
GTGACG 2 CRE related [42] 16.5 5.0e-4
CTTTGT 2 16.1 0.5
CCCTCCCCC 5 SP1 related [41] 15.9 0.05
GCGCAGGCGC 2 15.5 1.0e-3
GCGCGC 1 15.5 4.6e-13
AACTTT 4 15.4 0.3
CCTTTAA 3 15.3 0.01
TGCGCA 1 14.6 2.7e-5
CTCGCGAGA 1 14.6 4.13e-8
TTGGCT 1 13.9 0.01
TATAAA 1 TATA-box [45] 13.7 0.49
AAGATGGCGG 1 13.6 0.001
TTTGTT 3 13.4 0.13
ATGCAAAT 1 13.3 1.0e-4
TAATTA 1 13.1 0.06
TTTAAG 1 13.1 0.5
CGCATGCG 1 13.1 1.1e-5
ATAAAT 1 12.6 0.02
TTTAAA 1 12.6 0.02
GCCATTTT 1 11.7 8.5e-7
ATAAAA 1 11.7 0.6
TAAATA 1 11.6 0.5
CAGGTG 1 Helix-turn-helix [46] 11.2 0.2
CTAGCAAC 1 11.0 4.0e-3
TGACGC 1 CRE [42] 10.9 1.6e-4
CATTGT 1 10.7 0.14
GCCATCTT 1 10.6 8.4e-5
ATTTAT 1 10.6 0.02
ATGAAT 1 10.2 9.0e-3
Non-CpG region
motifs
TAATTA 1 20.3 0.064
CAGCTG 1 18.4 0.31
TGAGTCA 2 TRE [47] 18.1 8.0e-3
CAGGAAGT 5 ETS [43] 14.9 0.79
CCCTCCC 2 14.4 2.68e-10
AATAAA 2 14.0 0.31
AATTAA 2 Homeodomain
related
[48] 13.5 0.17
AGAAAA 2 12.9 0.44
ATAAAA 1 12.7 0.68
Genome Biology 2005, Volume 6, Issue 12, Article R104 Ettwiller et al. R104.7
comment reviews reports refereed researchdeposited research interactions information
Genome Biology 2005, 6:R104
the consensus sequence. We settled, therefore, on using a
restricted subset of IUPAC ambiguity characters with motifs
of between 5 and 12 bp long, where for speed of enumeration
we excluded the triply redundant characters {BDHV}, and
limited the total ambiguity of a consensus by a minimum
information content.
Allowing degeneracy in motifs sets, however, poses a different
challenge of deciding which precise motifs to report. Motifs
can partially overlap each other (for example, TATAAT to
AATGCGT have a three letter sequence in common), the par-
tial overlap being even more prevalent when degenerate let-
ters are allowed. In the process of enumeration, for each 'real'
motif that is statistically significant, we expect many closely
related motifs to also show significance. In addition, it is bio-
logically feasible that partially overlapping motifs are more
common than expected due to transcriptional control being
mediated by either cooperativity or steric hindrance. We were
inspired by the 'best explanator' approach of Blanchette [35]
to solve the motif redundancy problem, but as the statistic has
to be implemented in a space and time efficient manner, we
developed a simpler approach along the lines of the same
greedy approach (see Materials and methods).
The results of our scan for all 12-mers, allowing up to four
positions to be fully redundant, found a total of 3.2 million
unique motifs using the 'best explanator' method. At differing
levels of degeneracy, subtly different collections of motifs
were reported, and it is quite challenging to understand
which of these motifs have been previously described. For
annotation purposes, a scan with no degeneracy and applying
the best explanator method resulted in 73 motifs in the CpG
(unmethylated) set and 30 motifs in the non-CpG (methyl-
ated) set. In some cases this set still showed considerable
degeneracy by eye, which we further manually merged. Table
1 lists these 55 motifs (some occur in both the CpG and the
non-CpG sets), with any motif definition from the literature
indicated. We found 12 of these 55 motifs in the Jaspar data-
base. The only bias in these motifs is that they are generally
the more 'basal' transcriptional motifs, present on many pro-
moters. We found no bias in the length of the motif or occur-
rence in the genome, though most motifs occur in such vast
excess of their expected functional number that such global
occurrence ratings are unlikely to be meaningful. The results
of our motif scans at a series of allowed degeneracy levels are
listed in Additional data file 1, with the different degeneracy
levels being potentially useful for different tasks. This list is
clearly far short of the total number of expected motifs
involved in transcription, which we expect due to the need for
motifs to be involved in at least hundreds of promoter func-
tions for them to show significance in our measure. We
expand on this in the Discussion section.
Several known motifs are significant in our scan, in particular
the CAAT box, SP-1site, and the TATA box (Table 1). The first
two cases are examples where a number of similar motifs
were found by the 'best explanator' method but where we
believe there is only one core biological motif underlying
these instances. This could indicate issues with the computa-
tional process of finding the best computational representa-
tion of a binding site or could be related to biological
processes (for example, a particular subset of SP-1 sites that
have a slight variation in structure). The fact that the TATA
box also comes out in both the CpG and non-CpG cases is
reassuring, and it is a good illustration of the power of this
approach, as the motif itself is not over-represented in pro-
moters and indeed is absent from a large number of promot-
ers. We could not find evidence in the literature or in the
Jaspar database for most of our sites, although it is extremely
hard to find motif descriptions in the literature, and we apol-
TTTCCA 2 12.5 0.04
TATAAATAG 1 TATA-box [45] 12.2 0.01
AGGAAA 1 12.2 0.091
TTTCCT 1 12.2 0.091
TTCAAA 1 12.1 0.079
TGACCT 1 11.7 0.040
ATTTGCAT 1 11.3 1.0e-4
TTGTTT 1 10.9 0.011
TTTAAA 2 10.7 0.020
TTTCAG 1 10.4 0.31
The first column gives the motif consensus. *The three tested motifs in the experimental validation. The second column gives the number of related
motifs when by hand analysis was used to remove additional redundancy. The third column gives a brief text description when we found a matched
motif, and the literature reference for these cases is shown in the fourth column. The fifth column gives the Z-score (the number of standard
deviations from the expected mean) for the conserved versus occurrence ratio on the basis of the binomial distribution. The sixth column is the
probability of observing the overlap between fish and human promoters containing this motif. The table is sorted by Z-score.
Table 1 (Continued)
Non-degenerate motifs found by the evolutionary selex (EvoSelex) method
R104.8 Genome Biology 2005, Volume 6, Issue 12, Article R104 Ettwiller et al. />Genome Biology 2005, 6:R104
ogize in advance for the cases that we have missed. The other
novel motifs look in some cases like examples of sequence-
specific binding sites, such as AAGATGGCGG, whereas a
more degenerate motif such as TTTAAA is possibly not bound
by a transcription factor but instead has a structural or some
other role. There is no requirement, of course, that our motifs
are actual binding sites, only that there are evolutionary
advantages in keeping their base pair identity.
Instance identification via distant comparative studies
The evolutionary selex approach provides us with a library of
potential motifs, but does not specify which of the many
instances of the motif in a genome is active. We first
attempted to extend our comparative studies to more distant
vertebrates (fugu, zebrafish, chicken and Xenopus). Even
when controlling for the paucity of established 5' ends in
other vertebrates, we observed that only a fraction of promot-
ers (2% to 10%) had promoterwise alignments over 20 bits.
We did not pursue using these high scoring alignments
because of their low coverage, but we noticed that even in
weak (below 20 bits) alignments between mammals and fish
there were short word matches with our motifs. These low
scoring alignments are ubiquitous and apparently
indistinguishable from random alignments. Indeed, when we
used a simple rule of scoring a motif as positive if we found a
motif word match in the putative promoters to identify
43,052 specific instances of motifs in these genomes that
matched at mammalian/fish distances. In many cases, the
number of positive promoters having both a mammalian
motif and a fish ortholog of a motif instance was clearly non-
random, as judged by a hypergeometric probability of the co-
occurrence. When we used randomized motif libraries or ran-
domized ortholog sets, this signal was greatly reduced to
between 2- and 10-fold less predictions per motif and, as
expected, there were no significant hypergeometric motifs. As
our original evolutionary selex predicted that the instances
are enriched by at least five fold for real sites versus random
sites, this additional screen means that the false discovery
rate is between 1 in 10 and 1 in 100 depending on the motif.
Clearly, this technique is limited by the lack of effective 5' end
definition of genes in many of these species, but with this low
false discovery rate this limitation mainly affects our
sensitivity.
Experimental validation
To directly assess the specificity of this approach we took
advantage of the Medaka fish system, where transient trans-
genic experiments are usually consistently expressed over the
eight days of development. We selected six instances from our
comparative set at random from the specific instances on the
Fugu rubripes genome, which acts as an effective surrogate
for the Medaka genome. The respective promoter regions
were cloned from the Fugu rubripes genome and inserted
into a reporter vector. The reporter vector contains green flu-
orescent protein (GFP) as a reporter gene, which allows mon-
itoring of expression in vivo. For an in vivo promoter assay,
these constructs were tested by transient transgenesis using
the I-SceI meganuclease protocol [36]. Embryos were
screened 24 hours after injection (1 day post fertilization) for
GFP expression. Five of the six promoters resulted in ubiqui-
tous or specific expression in the time of analysis. For three of
them (listed in Materials and methods), we generated both
specific deletion constructs around the identified motifs and
control deletions at a random location in the promoter. It
proved difficult to generate the deletion constructs for the
remaining two. Around 100 transgenic injections were done
for each promoter and the expression patterns were scored in
a double-blind manner (see Materials and methods).
All three promoters showed some ubiquitous expression and,
for two of the genes (Q99JW1 and Q96BU7), there was often
high GFP expression in specific clones of cells distributed
along the entire embryonic axis (Figure 4a,b), indicative of
cell type specific induction. This pattern of high expression in
transient transgenic lines is a common feature of specific
expression [36]. The specific deletion constructs showed both
lower ubiquitous expression in all three cases, and in the case
of Q99JW1 and Q96BU7, dramatically lower numbers of high
expressing clones (for an example, see Figure 4). Figure 5
summarizes the results of 309 transgenic experiments and
shows that there is a specific repression of both ubiquitous
and the clonal GFP expression in the specific deletion com-
pared to both wild-type (WT) and control deletion studies.
The most striking case is Q96BU7 where clonal expression is
present in 53% of the WT transgenics and 40% of the control
deletions, but in only 6% of the specific deletion constructs.
These results are clear evidence that these specific instances
are involved in transcriptional control.
Discussion
We have developed a new method, 'evolutionary selex', to find
motifs involved in transcription using just genome sequence
and transcript start sites, and have made significant specific
predictions about which of these instances are actively con-
trolling transcription. This method uses a highly specific set
of negatively selected DNA, which we isolated using a novel
alignment procedure. We show that this method finds many
known motifs and several apparently novel cases. We have
also shown by direct experiment that these motifs are
involved in transcription.
The work of Xie et al. [28] shows similar results to ours for the
first portion of our method. They use strict conservation
across four mammals whereas we used a specific alignment
routine between only the two most distant mammals in the
set. In both cases, we discovered motifs by over-representa-
tion of motifs in conserved regions, with careful control of
CpG effects. Our method only needs two genomes to be effec-
tive and, therefore, is useful for other clades for which fewer
genomes are expected to be sequenced than for mammals. It
is hard to compare lists of motifs directly because of the many
Genome Biology 2005, Volume 6, Issue 12, Article R104 Ettwiller et al. R104.9
comment reviews reports refereed researchdeposited research interactions information
Genome Biology 2005, 6:R104
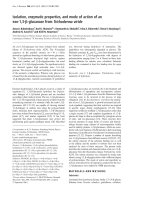
The three deletion mutantsFigure 4
The three deletion mutants. (a-d,i,j) The predominant promoter activity for the indicated constructs, with (e-h,k,l) brightfield images as reference. (a)
The arrow points to one of the strong clones, which is visible in many Q99JW1 wild-type (wt) fish compared to (b) the predominant deletion phenotype.
(c) Similarly for the Q9BU67 native construct, the arrow in indicates an often found cluster of strong clones, which are hardly found in (d) the deletion
construct injected fish. (i) SM31 shows ubiquitous expression found in most embryos injected with the native promoter, whereas (j) depicts the absence of
green fluorescent protein expression with the deletion construct. These figures are representative examples from the large set of injections made for each
construct (see Materials and methods). (m) Summary of the structure of the constructs used for reporter construction. Besides the native promoter, a
construct was created with as precise a deletion of the motif as possible, together with a construct carrying a control deletion in a region presumably
devoid of regulatory motifs.
SM31
Q99JW1 Q9BU67
WT expression
Motif
3
'
5
'
A
TG
WT sequence
3
'
5
'
( )
A
TG
Deletion
Control deletion
Deletion phenotype
WT expression Deletion phenotype
WT expression Deletion phenotype
(k) (j)
SM31
CGGAAG
Q99JW1
CACGTG
Q9BU67
ACTACA
3
'
5
'
A
TG
( )
(a) (b) (c) (d)
(e)
(f)
(g)
(h)
(i) (j)
R104.10 Genome Biology 2005, Volume 6, Issue 12, Article R104 Ettwiller et al. />Genome Biology 2005, 6:R104
arbitrary choices of where significant words start and end and
the differing methods for reducing redundancy. Using a sim-
ple edit-distance measure, there is a large (67%) overlap
between the two motif sets, suggesting both techniques are
focusing on a similar class of motif. Another similarity of the
two methods is the use of direct enumeration of words to find
statistically interesting motifs; this is in contrast to model
based approaches such as HMMs (Hidden Markov Meodels).
Direct enumeration removes the need to be concerned with
finding global optima, in contrast to local optima methods,
and with suffix tree implementations it is not prohibitively
costly in computational time.
The second part of this work, the prediction of specific
instances of these motifs on the genome, is a significant
advance beyond the work of Xie et al. [28]. Although they
found many significant motifs, they are only able to show
enrichment in conservation of these motifs and their bulk
properties (for example, association with tissue expression
patterns). Using more distant vertebrate sequences, we have
overcome this limitation to make specific predictions of
43,052 motif instances. A surprise here is that, although the
promoters of orthologous genes rarely have non-random
alignments at even frog-human distances, word matching of
specific motifs across vertebrates are both non-random and
also provide experimentally verifiable predictions. There are
two possible explanations for this behavior. Firstly, that we
have the wrong alignment model for promoters, and in fact
under the correct scoring scheme these motifs would be align-
ing. Secondly, that motif evolution involves de novo creation
and destruction of these motifs over this timescale, and yet
functional conservation of the presence of this motif in the
promoter. We favor the latter explanation, but in either case
this provides a very effective filter to find specific functional
instances of motifs in the genome.
A bar chart summarizing 309 transgenic experimentsFigure 5
A bar chart summarizing 309 transgenic experiments. Each set of three bars represents a particular construct for a gene, labeled WT (wild type) for
unaltered promoters, control del. for the control deletion of a random motif and specific for the specific deletion of the identified motif. In each bar, the
proportions of embryos that were classified either as having no expression, ubiquitous only expression or ubiquitous with clonal expression are shown in
yellow, maroon and blue, respectively. Each reporter was injected around 30 times and the expression patterns were scored in a double blind manner.
GFP, green fluorescent protein.
Specific motif deletion
0%
10%
20%
30%
40%
50%
60%
70%
80%
90%
100%
Q99JW1 WT
Q
99JW1 Control del
Q99JW1 specific
Fraction of injected clones
No GFP
Ubiquitous only
Ubiqutous and Clonal
Q96bu7 WT
Q
96bu7 Control del
Q96bu7 specific
FSM31 WT
FSM31 Contro
l del
FSM31 specific
Genome Biology 2005, Volume 6, Issue 12, Article R104 Ettwiller et al. R104.11
comment reviews reports refereed researchdeposited research interactions information
Genome Biology 2005, 6:R104
This specific instance identification has allowed us to test
these computational predictions with specific experiments.
This again is an advance over the Xie et al. method, which
only provided correlation with previous expression datasets
as indicative of their use in transcription. Here we show that
these discovered motifs are involved in transcription in both
general and cell type specific transcription. The ability to pre-
dict instances of active motifs is crucial to being able to design
experiments for a particular gene, showing the utility of our
instance discovery.
The map of motif instances across the genome is a first crude
approximation of a genomic model of transcription. In partic-
ular, we have dramatically fewer motifs (55) than the esti-
mated number of transcription factors in the human genome
(at least 1,500 from protein domain content). This is not sur-
prising, as our method is focused on ubiquitous factors, sum-
ming instances across multiple genes. In addition, this, like
other approaches, has been a very promoter-proximal
approach, also restricting the motifs to more basal factors.
Over time, refinements of the negatively selected base pairs
across mammals will help improve the statistical power of
these methods. However, even this crude map will be useful
for many downstream applications. For example, one might
prioritize the analysis of single nucleotide polymorphisms
that change these specific base pairs in disease searches, or
use these motifs as a starting point for detailed experimental
validation of a particular promoter. Clearly, both the con-
struction of the motif dictionary and the mapping of specific
instances must improve to provide a more detailed model for
transcription. Overall, this is likely to require the integration
of large scale experimental work, such as that being piloted in
the ENCODE project [37], in combination with bioinformat-
ics techniques.
Materials and methods
Promoterwise and genome searches
Promoterwise was written in the Wise2 package [38] using
the dynamic programming macro language dynamite. The
seeding system used an in-memory hash system that enumer-
ated all 7-mers in one sequence (on both strands) as the other
sequence was matched on each 7-mer, allowing for one mis-
match by enumeration of all 3*6 one off differences. This was
followed by a configurable step of extending motifs into high
scoring segment pairs (HSPs) along a single diagonal and
merging HSPs if they are close to each other (differing by
under three gaps). The resulting local regions were extended
by a default amount of 50 bp and then the DBA algorithm [30]
was run on them. The resulting alignments were sorted by the
log-odds bits score from the DBA algorithm, followed by a
greedy procedure of accepting progressively lower scoring
alignments only if they did not overlap previous alignments.
In practice, for significant (>20 bits) alignments the align-
ments are nearly always disjoint.
All these programs are freely available under a GPL license in
source code form at [38] as part of the Wise2 package.
Sequence statistics for evolutionary selex
To assess the significance of motifs we needed to quantify the
number of occurrences of a motif within a set of promoterwise
alignments and background sequences from which the align-
ments were made. To do this we took only the human subse-
quences from the promoterwise alignments and the human
set of background sequences. We avoided the issue of motif
self overlap in counting by taking the total number of occur-
rences of a motif within a set of sequences as the maximum
number of non-overlapping instances. To account for
regional differences in the quality of alignment, we counted,
after some experimentation, only completely conserved
instances of a motif. Probabilities were calculated using the
binomial distribution and converted into Z-scores. Clearly,
this is an approximation to a more formal statistical model,
but proved adequate for this genome-wide investigation.
To split the sequences into CpG enriched and negative
regions we used the Emboss CpGIsland program with the
default parameters but an adjusted minimum reportable
length of 50 bp. To split the human alignment sequences we
compared their overlap with the map of CpG islands and par-
titioned them accordingly.
Motif discovery
To enumerate the binomial statistic for a given set of motif
patterns we used the following algorithm. First we con-
structed a single suffix tree containing all our sequences using
McCrieght's linear time algorithm [39] with the memory effi-
cient scheme given in [34]. Practically, this meant we could
hold a tree containing one hundred megabases of sequence in
fewer than two gigabytes of working memory. In a similar
fashion to the algorithm of Marsan and Sagot [34], we then
traversed the tree enumerating patterns in an efficient lexico-
graphic ordering, stopping where the number of occurrences
fell below a threshold, and using multiple pointers where nec-
essary to deal with degeneracy. The software was written in
Java with the aims of speed and flexibility. In this scenario,
we needed only to know total counts of motif occurrences
within the two sets of sequence. In order, therefore, to
prevent unnecessary continual re-enumeration of sub-trees
we stored these counts at each node by a linear time
preprocessing of the tree. Where a motif appeared promising,
which we defined as having a preliminary Z-score of greater
than ten, we reinvestigated the tree to resolve overlaps
between instances of the motif.
To resolve the many high scoring variants of a motif into a
single set of non-redundant motifs is a non-trivial problem.
Adapting Blanchette's statistical approach to our method was
desirable but considered both complex and too computation-
ally expensive for the size of sequence we were using. We
therefore adapted their simple greedy algorithm which,
R104.12 Genome Biology 2005, Volume 6, Issue 12, Article R104 Ettwiller et al. />Genome Biology 2005, 6:R104
starting from the best scoring motif, filtered the sorted list
according to compatibility with a growing set of non-degener-
ate motifs. Here we established compatibility by recalculating
the Z-scores of motifs after counting the number of instances
of a motif that did not overlap instances of motifs already in
the non-degenerate set by greater than a third.
Annotation of our non-degenerate set of motifs was per-
formed by a manual investigation of the literature assisted by
an all against all alignment of our motif set to the Jaspar data-
base of position weight matrices.
Distant comparative studies
We scored each human promoter as positive for the motif if
the motif was found in the context of a >20 bit promoterwise
score for the human-mouse pair. We scored each fish pro-
moter as positive if either the fugu or zebrafish promoter had
an instance of the motif (irregardless of alignment). Zebrafish
and fugu are a considerable evolutionary distance apart, so it
is not feasible to perform the same alignment process as for
human and mouse. A hypergeometric probability was calcu-
lated for the overlap of the mammalian and fish positive pro-
moters using orthology links predicted by Ensembl, with the
total number of fish/mammal orthologs as the background
set (Ensembl version 18 was used throughout, but similar
results were obtained with version 31).
Molecular cloning
Genomic sequences that contained the conserved motif were
retrieved from the Ensembl F. rubripes database. Upstream
sequences of the respective genes of 1 to 2 kb in length were
amplified by PCR. PCR primers were designed using Oligo 6.8
(Molecular Biology Insights, West Cascade, co USA) for
fSM31, Q99JW1 and Q9BU67. Table 2 lists all the primers
used. Upstream regions were amplified with proof reading
Taq polymerase (Takara Bio Inc, Shiga, Japan) using 200 ng
of F. rubripes genomic DNA as template. Cycling conditions
were 35 cycles of 30 minutes at 94°C, 45 minutes at 59°C and
2 minutes at 72°C, followed by a final 5 minutes at 72°C on a
Peltier Thermal cycler (PTC-2000, MJ research, Waltham,
MA, USA).
PCR products of fSM31, Q99JW1 and Q9BU67 were cloned
into pCRII-TOPO (Invitrogen, Carlsbad, CA, USA) and con-
firmed by sequencing before the insert was cloned into a
pBlueScript-based transgenesis vector containing two recog-
nition sites for the meganuclease ISce-I flanking a multiple
cloning site and a 3' cassette containing enhanced GFP and a
SV40-polyadenylation signal.
The deletion of the conserved motif in Q99JW1 was intro-
duced by PCR using primers located 5' to the conserved
motifs. For Q9BU67, fusion PCR was performed to precisely
delete the 19 bp motif. The deletion in SM31 was introduced
by restriction digest with HinP1I and XhoI (New England
Biolabs, Beverly, MA, USA), cutting out a 62 bp fragment, and
religation (T4 Ligase, Roche, Mannheim, Germany). All dele-
tion constructs were sequenced.
Injections
Injections were done as described [36]. Prior to injection, the
DNA was purified using a spin column (nucleotide removal
kit, Qiagen, Hilden, Germany). DNA was injected at concen-
trations of 15 ng/µl for fSM31 and Q99JW1 and 12 ng/µl for
Q9BU67 using a Femtojet injector (Eppendorf, Hamburg,
Germany).
Screening
A Leica fluorescence dissection microscope (Leica MZ 16 FA,
Leica Microsystems AG, Wetzlar, Germany) was used to
examine GFP expression in live embryos. Injected embryos
were analyzed for seven days to determine the spatial and
temporal pattern of GFP expression. The elements fSM31 and
Q99JW1 result in ubiquitous expression and embryos with a
ubiquitous expression pattern were scored as positive. For
Table 2
PCR primers used
Upstream region Construct Direction Sequence
SM31 Control Sense 5'-CCTTCAGGAGCCTCAACAACAACAAAT-3'
Antisense 5'-ACAAATGAATGATTGGTCCCGACACGA-3'
Q99JW1 Control Sense 5'-GCGCTCCTCTCCCGTTATTGTTCAGGC-3'
Antisense 5'-CCTCTGTCCATCCATGCTACTGACCGA-3'
Deletion Antisense 5'-CGTCACGGGCGCTTCCATTTCAAAACT-3'
Q9BU67 Control Sense 5'-CTCTGTCAAGAAAGTGATGCCGTGAAA-3'
Antisense 5'-GAATGTTCAGAAGAGCAGCCGAGGGAT-3'
Deletion Sense 5'-CCAGGCCACGTTGTTATTTTGCTTCCGC-3'
Antisense 5'-AAAATAACAACGTGGCCTGGCCAGAGCC-3'
Genome Biology 2005, Volume 6, Issue 12, Article R104 Ettwiller et al. R104.13
comment reviews reports refereed researchdeposited research interactions information
Genome Biology 2005, 6:R104
Q9BU67, the intensity of the GFP fluorescence was included
in the evaluation.
Statistical analysis of expression data
Injections were repeated three times. Percentages of expres-
sion were weighted according to the total number of scored
embryos for each injection. The statistical analysis was car-
ried out using the Prism 4 software (GraphPad, San Diego,
CA, USA) with a two-grouping variables table with three rep-
licates. Mean and standard deviation were calculated using
the standard algorithms in the program. A paired t test was
carried out to determine the significance.
Additional data files
The following additional data are available with the online
version of this paper. Additional data file 1 is an Excel
spreadsheet of the results of the motif finding method at dif-
ferent levels of degeneracy. The first sheet denotes positive
motifs in CpG positive regions, the second sheet those in CpG
negative regions. Each sheet contains three sets of two-col-
umn data. The first column indicates the motif, and the sec-
ond column indicates the Z-score. Wild cards are represented
as IUPAC ambiguity letters.
Additional data file 1The results of the motif finding method at different levels of degeneracyThe first sheet denotes positive motifs in CpG positive regions, the second sheet those in CpG negative regions. Each sheet contains three sets of two-column data. The first column indicates the motif, and the second column indicates the Z-score. Wild cards are repre-sented as IUPAC ambiguity letters.Click here for file
Acknowledgements
LE provided the original analysis of motifs and the observation that con-
served versus total occurrence is enriched in transcription factor motifs.
BJP developed the binomial model and wrote the pattern enumeration
code. EB wrote promoterwise and did the genome wide analysis. The
Medaka fish experiments were designed by MS, FL and JW from sequence
analysis from LE; MS did the injections and analysis. The paper was written
mainly by EB with contributions from the other authors. LE, BJP, EB, MS, FL
and JW are all supported by EMBL. We would like to thank Sanger Institute
systems group for the computer support, Nick Goldman for advice on the
expected distributions of motifs and Webb Miller, Thomas Down and Tim
Hubbard for comments on the manuscript.
References
1. Buckingham M: Skeletal muscle formation in vertebrates. Curr
Opin Genet Dev 2001, 11:440-448.
2. Penalva LO, Sanchez L: RNA binding protein sex-lethal (Sxl) and
control of Drosophila sex determination and dosage
compensation. Microbiol Mol Biol Rev 2003, 67:343-345.
3. Kadonaga JT: Regulation of RNA polymerase II transcription
by sequence-specific DNA binding factors. Cell 2004,
116:247-257.
4. Davidson EH, Rast JP, Oliveri P, Ransick A, Calestani C, Yuh CH,
Minokawa T, Amore G, Hinman V, Arenas-Mena C, et al.: A genomic
regulatory network for development. Science 2002,
295:1669-1678.
5. Burge C, Karlin S: Prediction of complete gene structures in
human genomic DNA. J Mol Biol 1997, 268:78-94.
6. Salamov AA, Solovyev VV: Ab initio gene finding in Drosophila
genomic DNA. Genome Res 2000, 10:516-522.
7. Birney E, Clamp M, Durbin R: GeneWise and Genomewise.
Genome Res 2004, 14:988-995.
8. Kulp D, Haussler D, Reese MG, Eeckman FH: Integrating database
homology in a probabilistic gene structure model. Pac Symp
Biocomput 1997, 2:232-244.
9. Mott R: EST_GENOME: a program to align spliced DNA
sequences to unspliced genomic DNA. Comput Appl Biosci 1997,
13:477-478.
10. Wray GA, Hahn MW, Abouheif E, Balhoff JP, Pizer M, Rockman MV,
Romano LA: The evolution of transcriptional regulation in
eukaryotes. Mol Biol Evol 2003, 20:1377-1419.
11. Wasserman WW, Sandelin A: Applied bioinformatics for the
identification of regulatory elements. Nat Rev Genet 2004,
5:276-287.
12. Jenuwein T, Allis CD: Translating the histone code. Science 2001,
293:1074-1080.
13. Fazzari MJ, Greally JM: Epigenomics: beyond CpG islands. Nat
Rev Genet 2004, 5:446-455.
14. Novik KL, Nimmrich I, Genc B, Maier S, Piepenbrock C, Olek A, Beck
S: Epigenomics: genome-wide study of methylation
phenomena. Curr Issues Mol Biol 2002, 4:111-128.
15. Matys V, Fricke E, Geffers R, Gossling E, Haubrock M, Hehl R, Hor-
nischer K, Karas D, Kel AE, Kel-Margoulis OV, et al.: TRANSFAC:
transcriptional regulation, from patterns to profiles. Nucleic
Acids Res 2003, 31:374-378.
16. Kolchanov NA, Ignatieva EV, Ananko EA, Podkolodnaya OA,
Stepanenko IL, Merkulova TI, Pozdnyakov MA, Podkolodny NL, Nau-
mochkin AN, Romashchenko AG: Transcription Regulatory
Regions Database (TRRD): its status in 2002. Nucleic Acids Res
2002, 30:312-317.
17. Sandelin A, Alkema W, Engstrom P, Wasserman WW, Lenhard B:
JASPAR: an open-access database for eukaryotic transcrip-
tion factor binding profiles. Nucleic Acids Res 2004:D91-D94.
18. Odom DT, Zizlsperger N, Gordon DB, Bell GW, Rinaldi NJ, Murray
HL, Volkert TL, Schreiber J, Rolfe PA, Gifford DK, et al.: Control of
pancreas and liver gene expression by HNF transcription
factors. Science 2004, 303:1378-1381.
19. Horak CE, Snyder M: ChIP-chip: a genomic approach for iden-
tifying transcription factor binding sites. Methods Enzymol 2002,
350:469-483.
20. Brazma A, Jonassen I, Vilo J, Ukkonen E: Predicting gene regula-
tory elements in silico on a genomic scale. Genome Res 1998,
8:1202-1215.
21. Holmes I, Bruno WJ: Finding regulatory elements using joint
likelihoods for sequence and expression profile data. Proc Int
Conf Intell Syst Mol Biol 2000, 8:202-210.
22. Hughes JD, Estep PW, Tavazoie S, Church GM: Computational
identification of cis-regulatory elements associated with
groups of functionally related genes in Saccharomyces
cerevisiae. J Mol Biol 2000, 296:1205-1214.
23. van Helden J, Rios AF, Collado-Vides J: Discovering regulatory
elements in non-coding sequences by analysis of spaced
dyads. Nucleic Acids Res 2000, 28:1808-1818.
24. Ohler U, Niemann H: Identification and analysis of eukaryotic
promoters: recent computational approaches. Trends Genet
2001, 17:56-60.
25. Wasserman WW, Palumbo M, Thompson W, Fickett JW, Lawrence
CE: Human-mouse genome comparisons to locate regula-
tory sites. Nat Genet 2000, 26:225-228.
26. Kellis M, Patterson N, Endrizzi M, Birren B, Lander ES: Sequencing
and comparison of yeast species to identify genes and regu-
latory elements. Nature 2003, 423:241-254.
27. Ettwiller LM, Rung J, Birney E: Discovering novel cis-regulatory
motifs using functional networks. Genome Res 2003, 13:883-895.
28. Xie X, Lu J, Kulbokas EJ, Golub TR, Mootha V, Lindblad-Toh K,
Lander ES, Kellis M: Systematic discovery of regulatory motifs
in human promoters and 3' UTRs by comparison of several
mammals. Nature 2005, 434:338-345.
29. Day WH, Sankoff D: Computational complexity of inferring
phylogenies from chromosome inversion data. J Theor Biol
1987, 124:213-218.
30. Jareborg N, Birney E, Durbin R: Comparative analysis of noncod-
ing regions of 77 orthologous mouse and human gene pairs.
Genome Res 1999, 9:815-824.
31. Schwartz S, Kent WJ, Smit A, Zhang Z, Baertsch R, Hardison RC,
Haussler D, Miller W: Human-mouse alignments with
BLASTZ. Genome Res 2003, 13:103-107.
32. Tuerk C, Gold L: Systematic evolution of ligands by exponen-
tial enrichment: RNA ligands to bacteriophage T4 DNA
polymerase. Science 1990, 249:505-510.
33. Kurtz S: Reducing the space requirements of suffix trees. Soft-
ware-Practise Experience 1999, 29:1149-1171.
34. Marsan L, Sagot MF: Algorithms for extracting structured
motifs using a suffix tree with an application to promoter
and regulatory site consensus identification. J Comput Biol
2000, 7:345-362.
35. Blanchette M, Sinha S: Separating real motifs from their
R104.14 Genome Biology 2005, Volume 6, Issue 12, Article R104 Ettwiller et al. />Genome Biology 2005, 6:R104
artifacts. Bioinformatics 2001, 17(Suppl 1):S30-S38.
36. Thermes V, Grabher C, Ristoratore F, Bourrat F, Choulika A, Witt-
brodt J, Joly JS: I-SceI meganuclease mediates highly efficient
transgenesis in fish. Mech Dev 2002, 118:91-98.
37. The ENCODE Project Consortium: The ENCODE (ENCyclope-
dia Of DNA Elements) project. Science 2004, 306:636-640.
38. Wise2 [ />39. Gusfield D: Algorithms on Strings, Trees, and Sequences Cambridge Uni-
versity Press: NewYork; 1997.
40. Mantovani R: A survey of 178 NF-Y binding CCAAT boxes.
Nucleic Acids Res 1998, 26:1135-1143.
41. Thiesen HJ, Bach C: Target Detection Assay (TDA): a versatile
procedure to determine DNA binding sites as demonstrated
on SP1 protein. Nucleic Acids Res 1990, 18:3203-3209.
42. Paca-Uccaralertkun S, Zhao LJ, Adya N, Cross JV, Cullen BR, Boros
IM, Giam CZ: In vitro selection of DNA elements highly
responsive to the human T-cell lymphotropic virus type I
transcriptional activator, Tax. Mol Cell Biol 1994, 14:456-462.
43. Solomon DL, Amati B, Land H: Distinct DNA binding prefer-
ences for the c-Myc/Max and Max/Max dimers. Nucleic Acids
Res 1993, 21:5372-5376.
44. Virbasius JV, Virbasius CA, Scarpulla RC: Identity of GABP with
NRF-2, a multisubunit activator of cytochrome oxidase
expression, reveals a cellular role for an ETS domain activa-
tor of viral promoters. Genes Dev 1993, 7:380-392.
45. Bucher P: Weight matrix descriptions of four eukaryotic RNA
polymerase II promoter elements derived from 502 unre-
lated promoter sequences. J Mol Biol 1990, 212:563-578.
46. Mauhin V, Lutz Y, Dennefeld C, Alberga A: Definition of the DNA-
binding site repertoire for the Drosophila transcription fac-
tor SNAIL. Nucleic Acids Res 1993, 21:3951-3957.
47. Pollock R, Treisman R: A sensitive method for the determina-
tion of protein-DNA binding specificities. Nucleic Acids Res
1990, 18:6197-6204.
48. Chen CY, Schwartz RJ: Identification of novel DNA binding tar-
gets and regulatory domains of a murine tinman homeodo-
main factor, nkx-2.5. J Biol Chem 1995, 270:15628-15633.